2729
A Comparison of Deep Learning Convolutional Neural Networks for Liver Segmentation in Radial Turbo Spin Echo Images1Electrical and Computer Engineering, University of Arizona, Tucson, AZ, United States, 2Medical Imaging, University of Arizona, Tucson, AZ, United States, 3Biomedical Engineering, University of Arizona, Tucson, AZ, United States
Synopsis
Motion-robust 2D-RADTSE can provide a high-resolution composite, T2-weighted images at multiple echo times (TEs), and a quantitative T2 map, all from a single k-space acquisition. We use deep-learning CNN for segmentation of liver in abdominal RADTSE images. An enhanced UNET architecture with generalized dice loss based objective function was implemented. Three nets were trained, one for each image type obtained from the sequence. On evaluating net performances on the validation set, we found that nets trained on TE images or T2 maps had higher average dice scores than the one trained on composites, implying information regarding T2 variation aids in segmentation.
Motivation
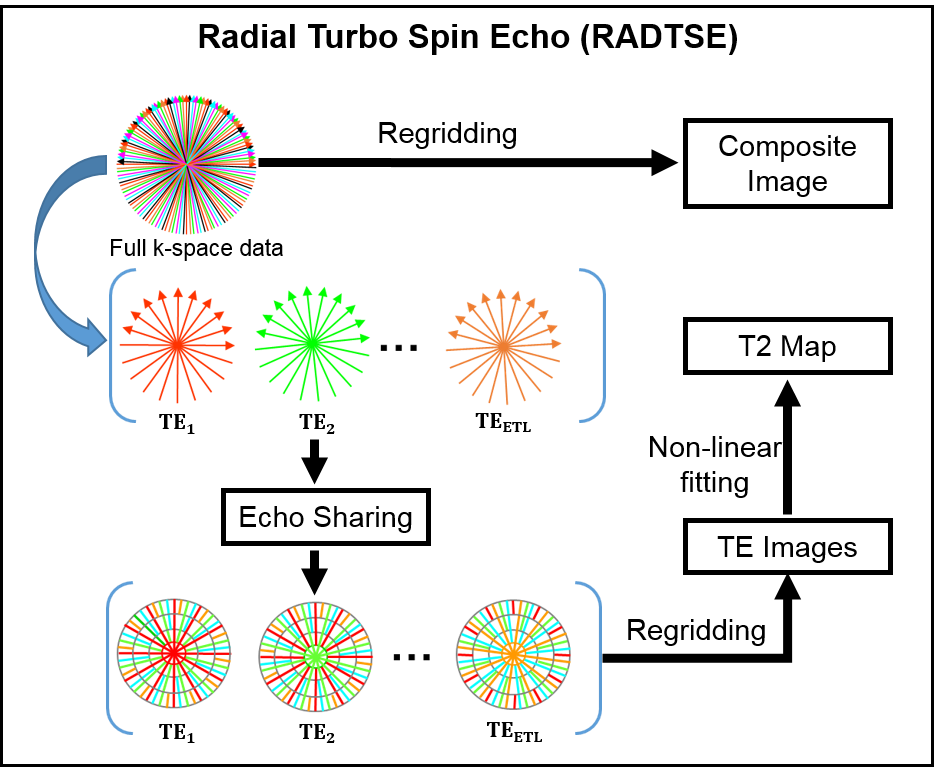
T2-weighted imaging is widely used for diagnosis in hepatic applications and there is a growing role for quantitative imaging in the evaluation of hepatic diseases1,2. Radial Turbo Spin Echo3 (RADTSE) has been used in abdominal imaging since it is motion-insensitive and produces high-resolution images of the liver within a breath-hold. Furthermore, a single RADTSE k-space data set can be used to obtain a high-resolution composite image, T2-weighted images at multiple echo times (TEs) using echo sharing4, and a T2 map for quantitative evaluation. Importantly, all of these different images are co-registered. This process is illustrated in Figure 1.
Liver segmentation is the first step in automated processing of abdominal RADTSE images. Since all images (composite, multiple TEs, and T2 map) are co-registered, liver masks obtained using one image type can be applied to the others. In this work, we investigate the use of deep-learning Convolutional Neural Networks (CNN) for segmentation of RADTSE images. We evaluate the performance of deep-learning CNNs using different types of images obtained from RADTSE data to determine the best image type to use for segmentation.
Methods
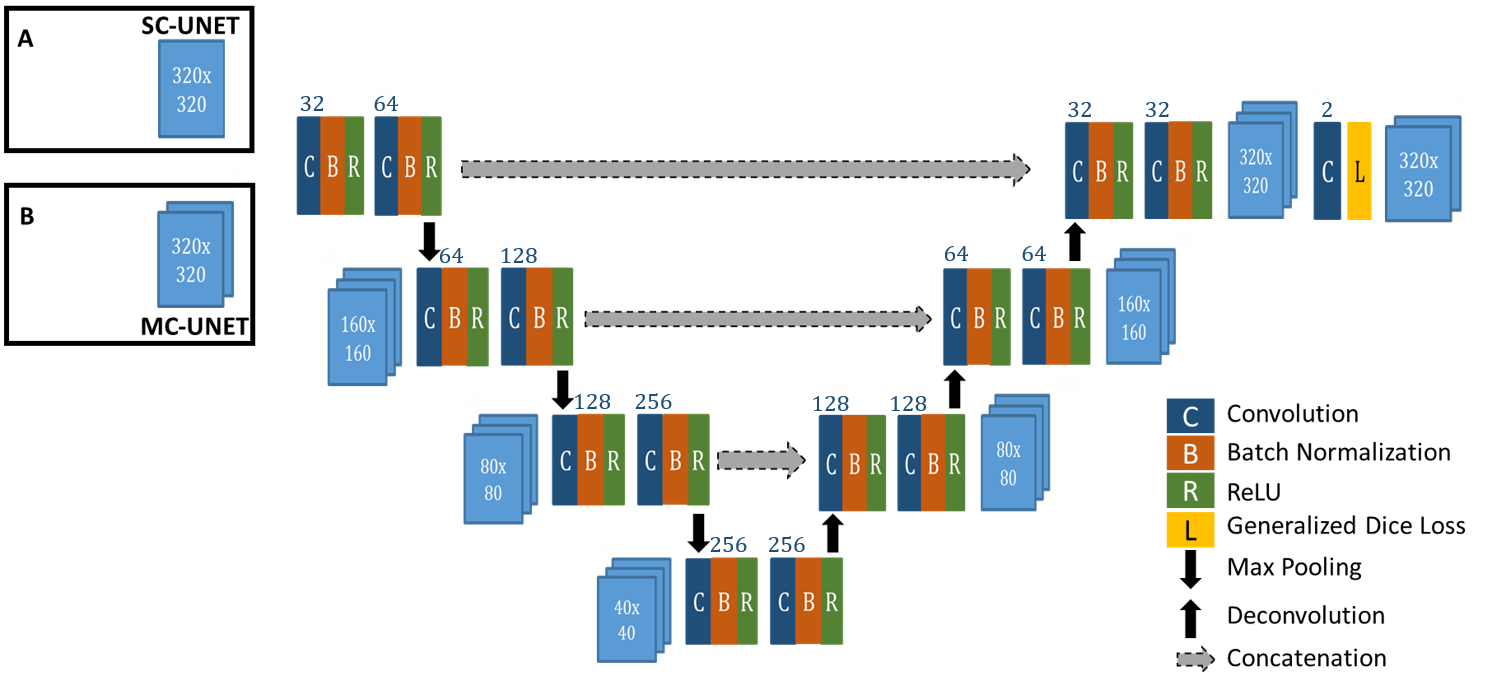
U-NET5 CNN has been introduced as an efficient deep-learning architecture for medical image segmentation tasks. In this work, we introduce an enhanced UNET architecture (Figure 2) for segmentation of RADTSE images. In comparison to the original UNET, our proposed architecture contains several enhancements including four resolution levels, batch normalization layer after every convolution layer, and zero padding of the convolutions to retain input image size at the output. In addition, a generalized dice loss6 (GDL) with an $$$L_2$$$ penalty was implemented as the loss function. Given that $$$r_n$$$ and $$$p_n$$$ refer to the nth pixel in the ground truth and prediction, respectively, GDL is defined as
$$ GDL = 1 - \frac{\sum_n p_n r_n}{ \sum_n p_n + \sum_n r_n} - \frac{\sum_n (1-p_n) (1-r_n)}{ \sum_n (1-p_n) + \sum_n (1-r_n)} $$
The loss function gradients were calculated and implemented to work with the Caffe7 framework. Two networks with different input channel dimensions were implemented; a single-channel UNET (SC-UNET) that takes as its input a single image and its multi-channel variant (MC-UNET) that takes in multiple images.
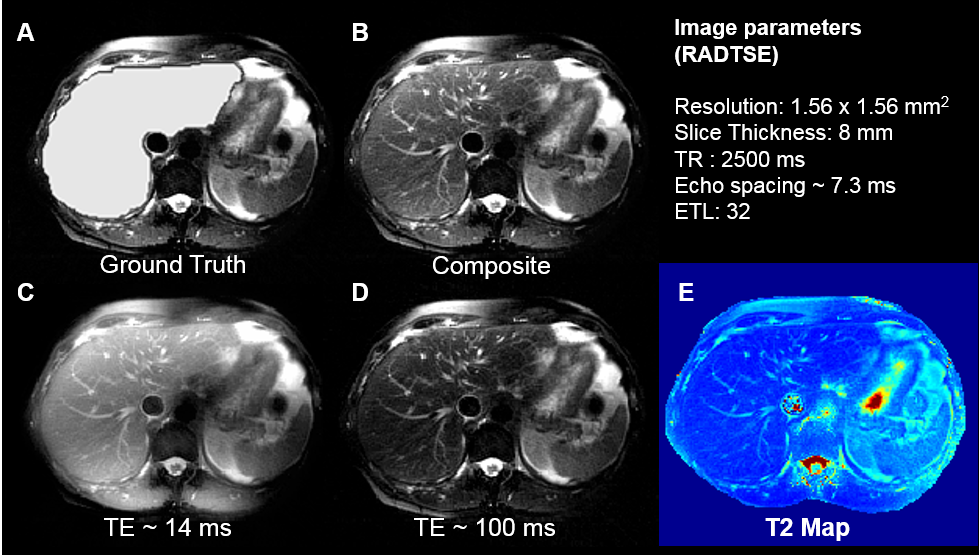
Images were acquired on a 1.5T (Siemens Aera) scanner on 32 subjects. 29 subjects were used for training and 3 for validation. Ground truth labels for the liver were manually drawn. After applying an N4 bias correction algorithm8, the images were pre-processed to enhance the contrast between the liver and the background (Figure 3). Data augmentation using translations, blurring, and elastic deformations5 were performed to increase the size of the training set.
Two separate SC-UNETs were trained; one for the composite images (SC-UNET-Composite) and the other for T2 maps (SC-UNET-T2). A two-channel MC-UNET was trained using T2-weighted images acquired at TEs ~ 14 ms and 100 ms. A coarse search for the best learning-rate (LR) identified a LR of 0.001 with consistent performance for all the three nets. Each net was trained with randomly initialized weights for 75000 iterations (~30 epochs) using a stochastic gradient descent algorithm with momentum 0.99 and a step decay of LR. All networks were trained on a PC with multiple NVIDIA Titan X GPUs. Three validation subjects were used to test the generalizing ability of the nets and performance was evaluated using dice and sensitivity scores.
Results and Discussion
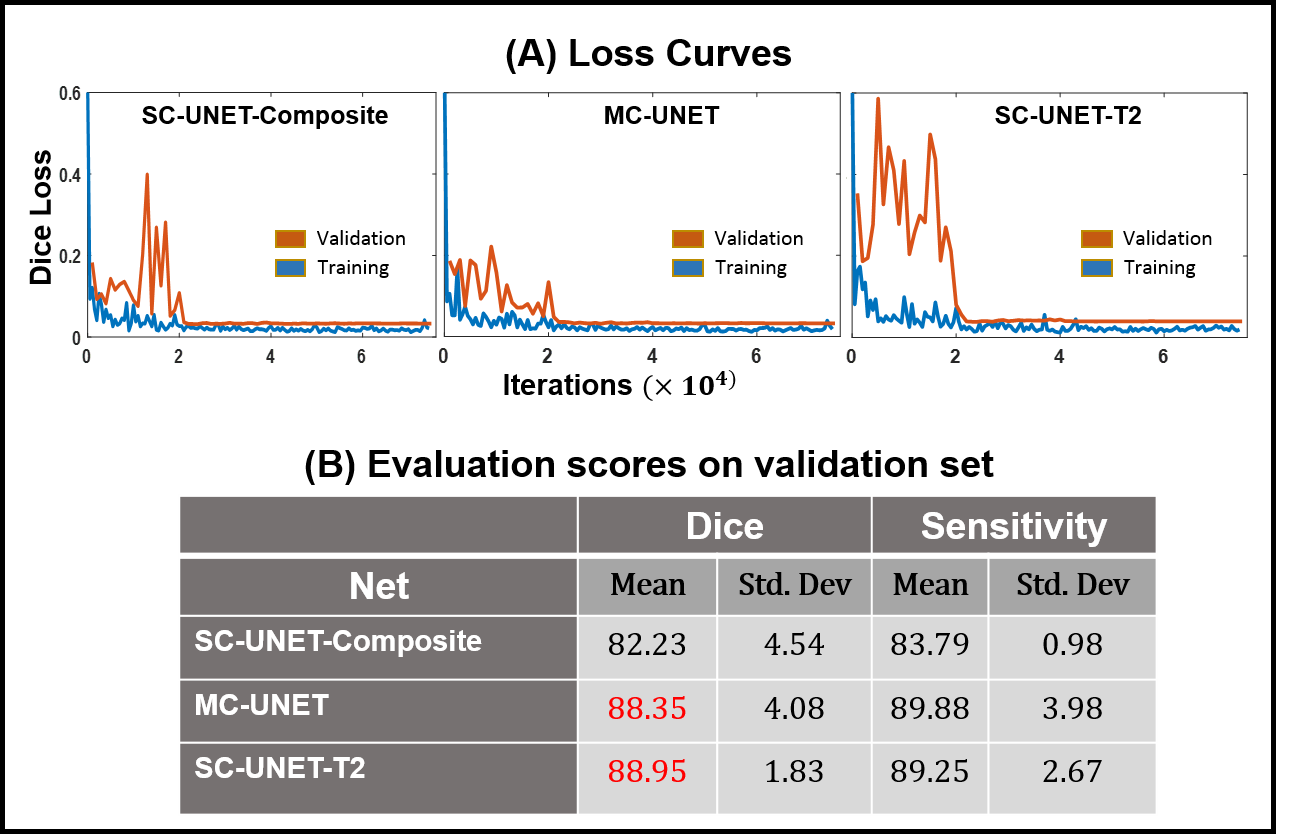
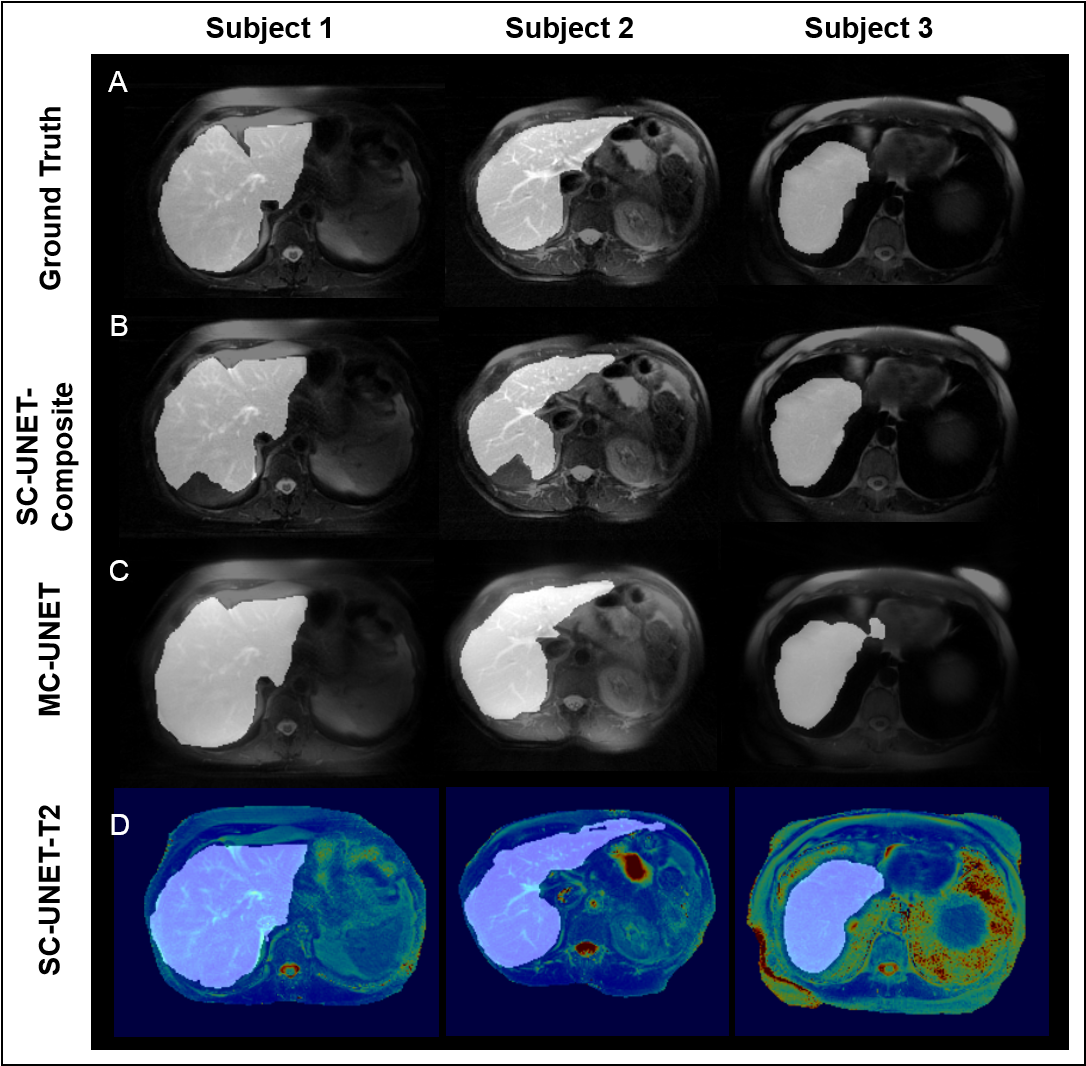
The training and validation loss curves for the three nets are shown in Figure 4A. The prediction time for a single image was approximately 80 ms. The mean and the standard deviation for dice and sensitivity scores for the three nets are tabulated in Figure 4B. Representative images from three subjects along with the predicted liver masks and ground truth overlaid on the input images are shown in Figure 5.
It can be observed that both MC-UNET and SC-UNET-T2 show improved dice and sensitivity scores compared to SC-UNET-Composite. However, SC-UNET-T2 has lower standard deviation in its performance showing consistency. The improved performances of SC-UNET-T2 and MC-UNET can be attributed to the fact that the input images to these networks contain information regarding T2 variations at each pixel.
In this study, only two channels were used in MC-UNET. Inclusion of additional TE images along the channels could yield improved predictions, however, GPU memory imposes constraints on the maximum number of channels. The network performance can also be generalized better by increasing training set size.
Conclusion
Three different convolutional nets were implemented to compare liver segmentation performance on images obtained from the RADTSE sequence. We observed that networks using multiple TE images (MC-UNET) or T2 maps (SC-UNET-T2) as input yielded better dice scores and sensitivity compared to the one using only composite images as input (SC-UNET-Composite).Acknowledgements
The authors would like to acknowledge support from the Arizona Biomedical Research Commission (Grant ADHS14-082996) and the Technology and Research Initiative Fund (TRIF) Improving Health Initiative.References
1. K Ito et al. Hepatic lesions: discrimination of nonsolid, benign lesions from solid, malignant lesions with heavily T2-weighted fast spin-echo MR imaging. Radiology. 1997; 204(3): 729-737.
2. M Altbach et al. A radial magnetic resonance imaging method for imaging abdominal neroplasms. Methods of Cancer Diagnosis, Therapy and Prognosis. Springer, Netherfields; 2009; vol 5: 21-32.
3. M. Altbach et al. Radial fast spin-echo method for T2-weighted imaging and T2 mapping of the liver. J Magn Reson Imaging. 2002;16(2):179-89.
4. M Altbach et al. Processing of radial fast spin-echo data for obtaining T2 estimates from a single k-space data set. Magn Reson Med. 2005; 54: 549-559.
5. Ronneberger et al. U-Net: Convolutional Networks for Biomedical Image Segmentation. MICCAI, Springer, LNCS. 2015; Vol.9351: 234-241.
6. Sudre et al. Generalized Dice Overlap as Deep Learning Loss Function for Highly Unbalanced Segmentations. DLMIA, ML-CDS. Lecture Notes in Computer Science. 2017; vol 10553.
7. Jia et al. Caffe: Convolutional architecture for fast feature embedding. Proc. 22nd ACM International Conference on Multimedia. 2014.
8. Tustison et al. N4ITK: Improved N3 Bias Correction. IEEE Trans on Med Imaging. 2010; 29(6):1310-1320
Figures