2726
Deep learning-based whole head segmentation for simultaneous PET/MR attenuation correction1Monash Biomedical Imaging, Monash University, Clayton, Australia, 2Department of Biophysics, Faculty of Mathematics and Natural Sciences, University of Rzeszow, Rzeszow, Poland, 3Monash Institute of Cognitive and Clinical Neurosciences and School of Psychological Sciences, Monash University, Clayton, Australia, 4Monash Imaging, Monash Health, Clayton, Australia, 5Australian Research Council Centre of Excellence for Integrative Brain Function, Monash University, Clayton, Australia, 6Department of Electrical and Computer Systems Engineering, Monash University, Clayton, Australia
Synopsis
Estimation of an accurate PET attenuation correction factor is crucial for quantitative PET imaging, and is an active area of research in simultaneous PET/MR. In this work, we propose a deep learning-based image segmentation method to improve the accuracy of PET attenuation correction for simultaneous PET/MR imaging of the human head. We compare segmentation methods for accurate tissue segmentation and attenuation map generation. We demonstrate improved PET image reconstruction accuracy using the proposed deep learning-based method.
Introduction
Deriving accurate attenuation correction maps (μ-maps) remains one of the major challenges for quantitative PET imaging using simultaneous PET/MR scanners. Limitations of the existing methods include inaccurate bone/air segmentation, and lack of subject specific bone information. Therefore, new and more sophisticated methods are required to generate accurate μ-maps. Rapidly increasing computational capabilities enable usage of more complex models such as deep learning for tissue segmentation1 and/or direct μ-map generation2. In this work, we present preliminary results of an application of a modified residual encoder and convolutional decoder network model3 for accurate tissue segmentation of MR head images. The method employs several MRI contrasts, and prior anatomical information, for tissue type estimation. To evaluate the deep learning-based μ-maps, reconstructed PET images were quantitatively compared with the reference image, and the results from two other methods.Materials and Methods
Materials: Six subjects were scanned using a 3T PET/MR scanner (Siemens 3T Biograph mMR, Erlangen, Germany). Dual ultra-short time echo (dUTE), T1w MPRAGE, and T2w sequences were acquired for μ-map generation. Five subjects underwent a PET scan with 100MBq 18F-FDG tracer.
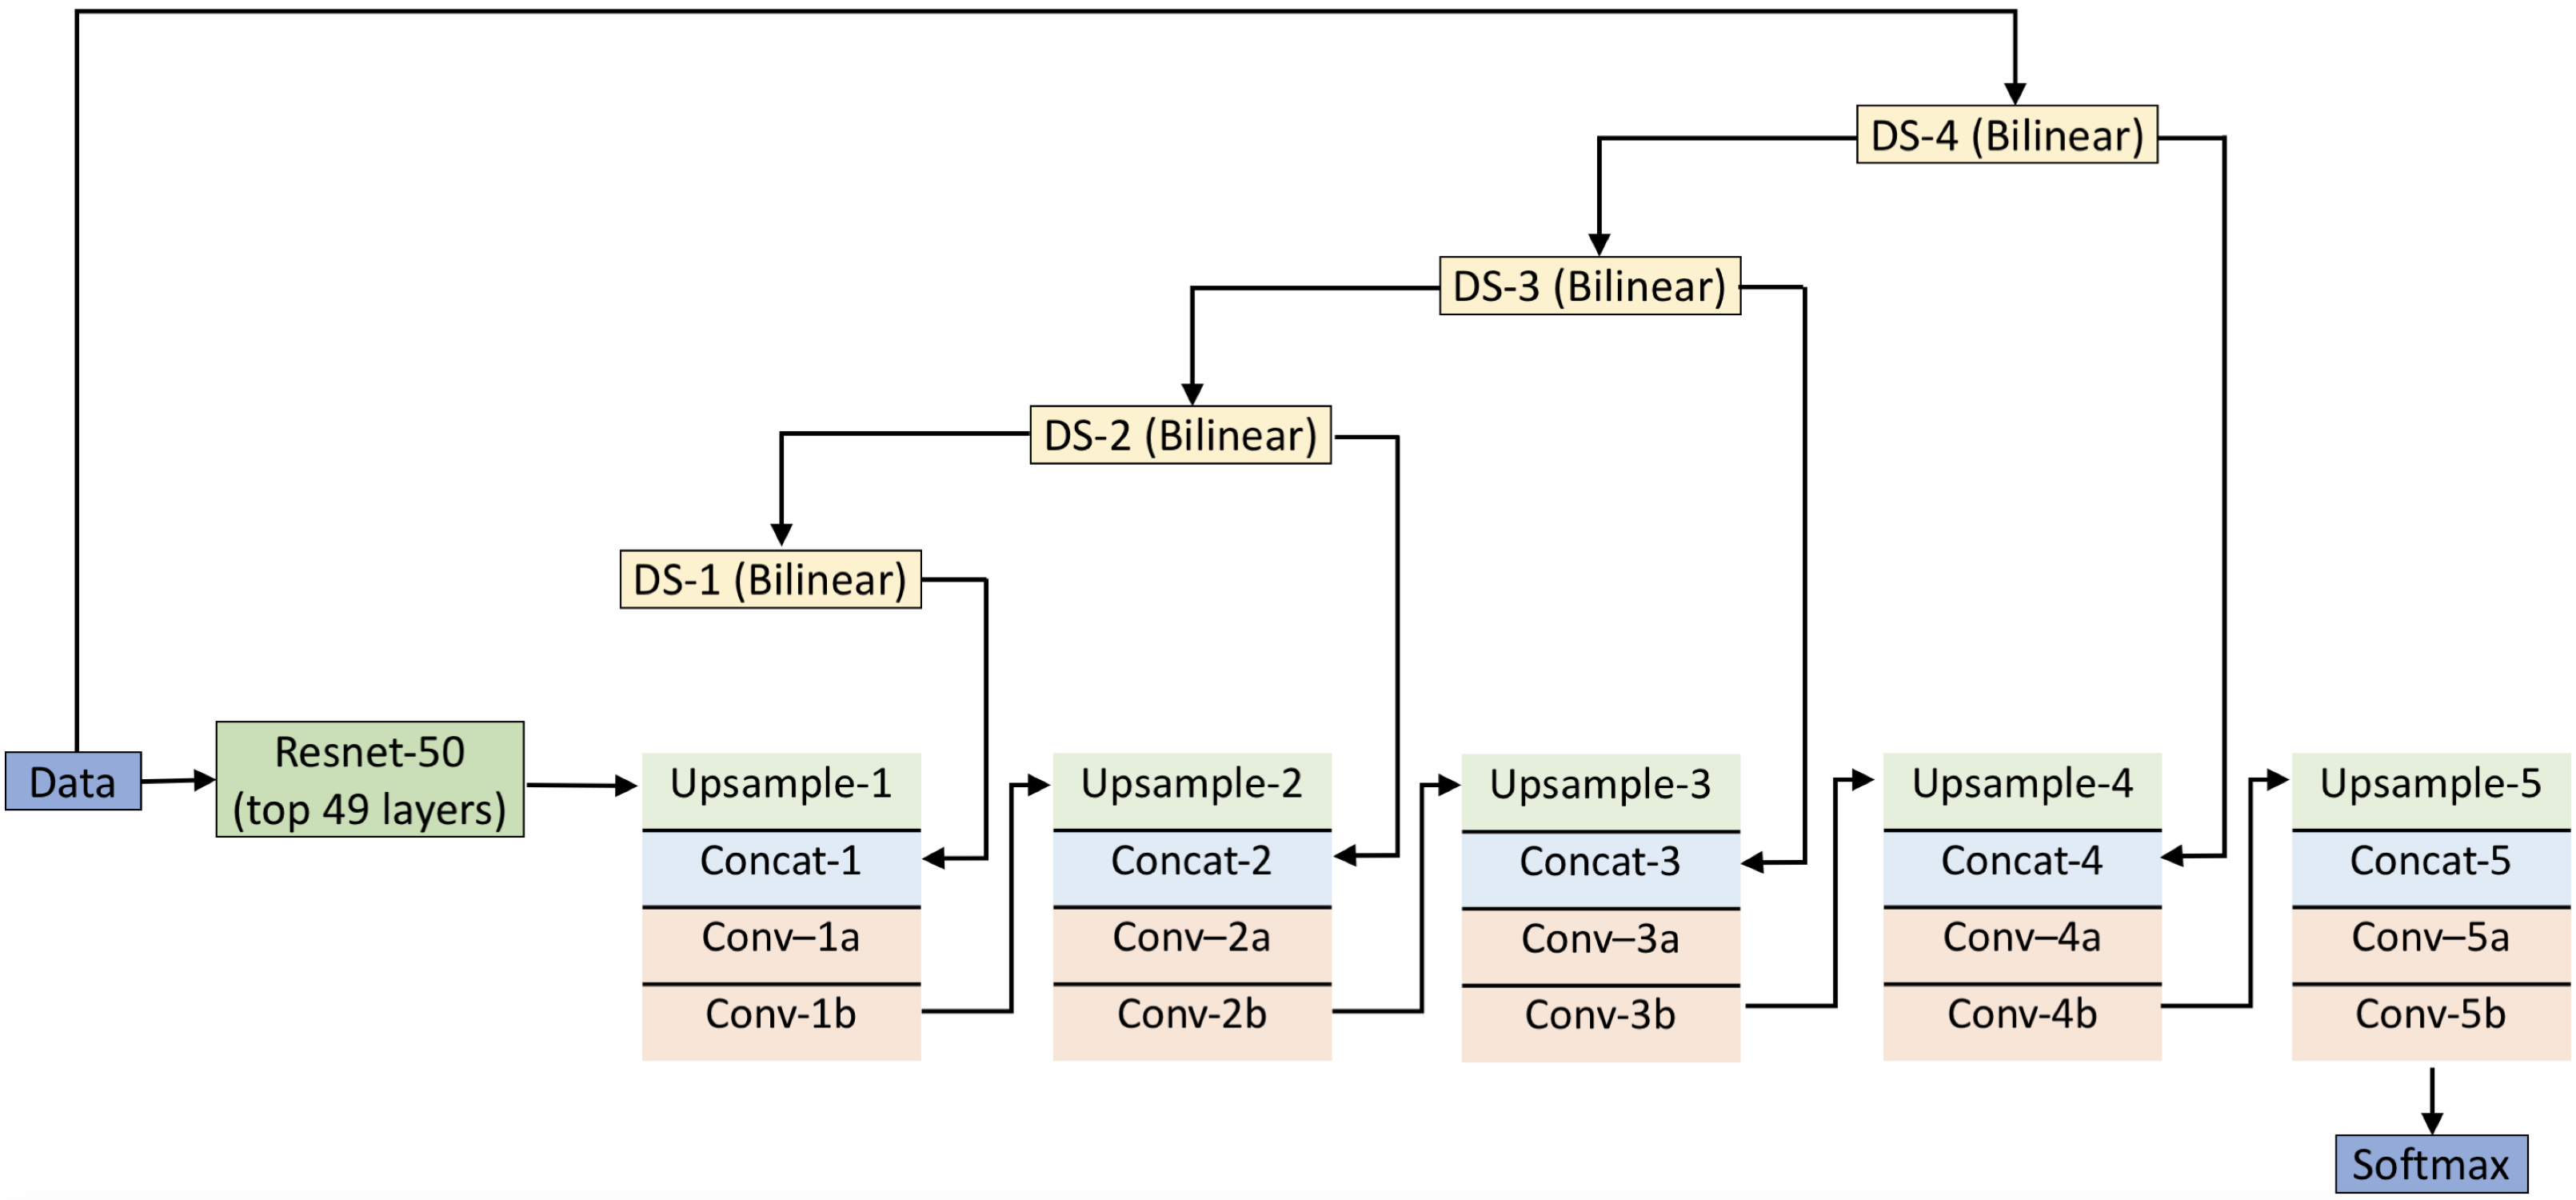
Neural network architecture and training: Figure 1 shows the deep learning network used for segmentation. It consists of a 49-layer deep residual encoder and a 10-layer deep convolutional decoder3. The input to the network is T1w, T2w, UTE1, UTE2 and probabilistic maps for bone, soft tissue and air. The output of the network is a classification of each pixel into either bone, soft tissue or air. Four subjects are used to train the network, and two for testing. The network is trained with stochastic gradient descent back propagation using caffe4.
μ-maps calculation: Bones, soft tissue and air μ values were set to 0.151 cm-1, 0.1 cm-1 and 0 cm-1, respectively. The μ-map was further smoothed with a 2mm Gaussian filter to obtain the final μ-map (μ-mapDL). The deep learning-based method was compared with the following μ-maps:
1. Reference (μ-mapref) – manually segmented UTE images for three tissue types: bone (μ=0.151 cm-1), soft tissue (0.1 cm-1) and air (0 cm-1) with segmentation performed under the supervision of a clinical radiologist;
2. UTE (μ-mapUTE) – vendor provided technique based on dUTE images; and
3. pseudo-CT (μ-mappCT) – atlas-based technique introduced by Burgos et. al.5
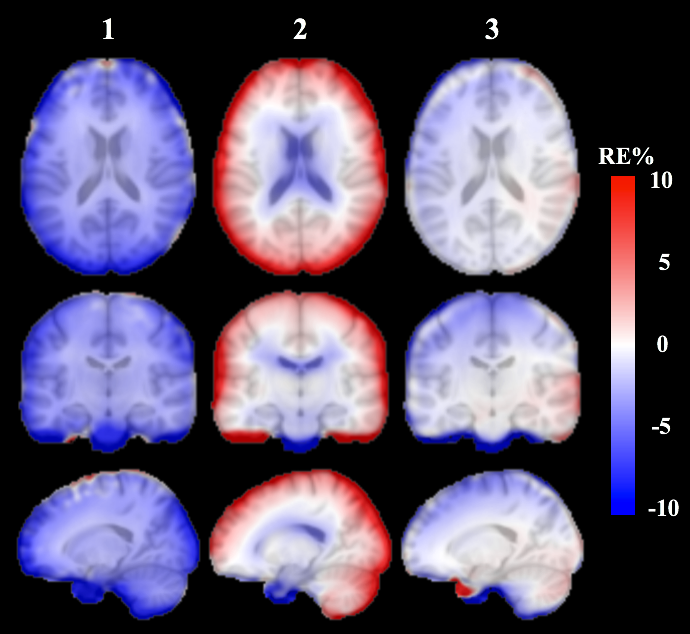
Reconstruction: Siemens e7tools software was used to reconstruct the PET data. Ordered-subsets expectation maximization algorithm (21 subsets, 3 iterations) and a point spread function modelling were used. The reconstructed images were smoothed using a 5mm Gaussian filter. The μ-mapref-based PET (PETref) image was taken as a reference, and normalized error maps were used for the comparison amongst methods, given as: RE=100%*(PETX - PETref)/ PETref, where PETX is the PET image obtained using one of the above μ-maps.
Results
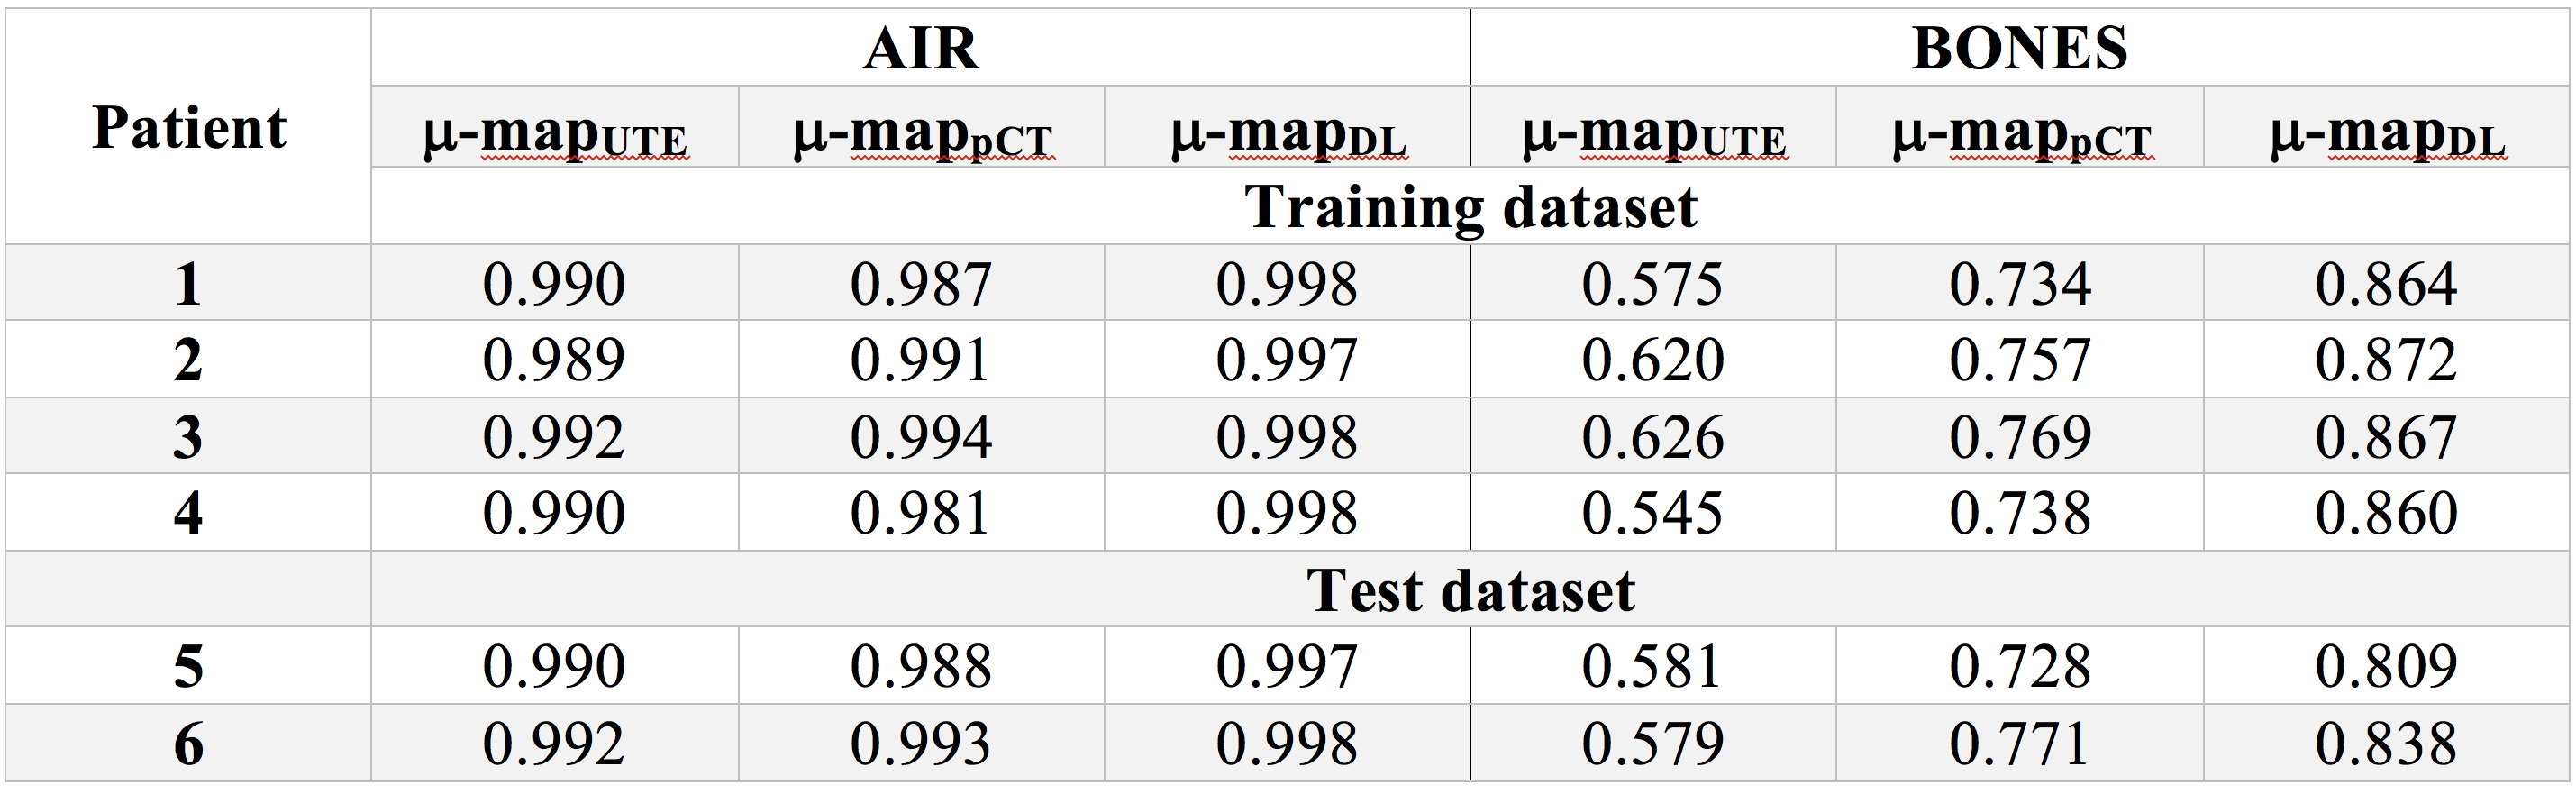
Segmentation: Dice coefficients for all methods are presented in Table 1. We found significant improvements in bone segmentation compared to UTE and state-of-the-art pseudo-CT technique. Air segmentation scores for all techniques are similar.
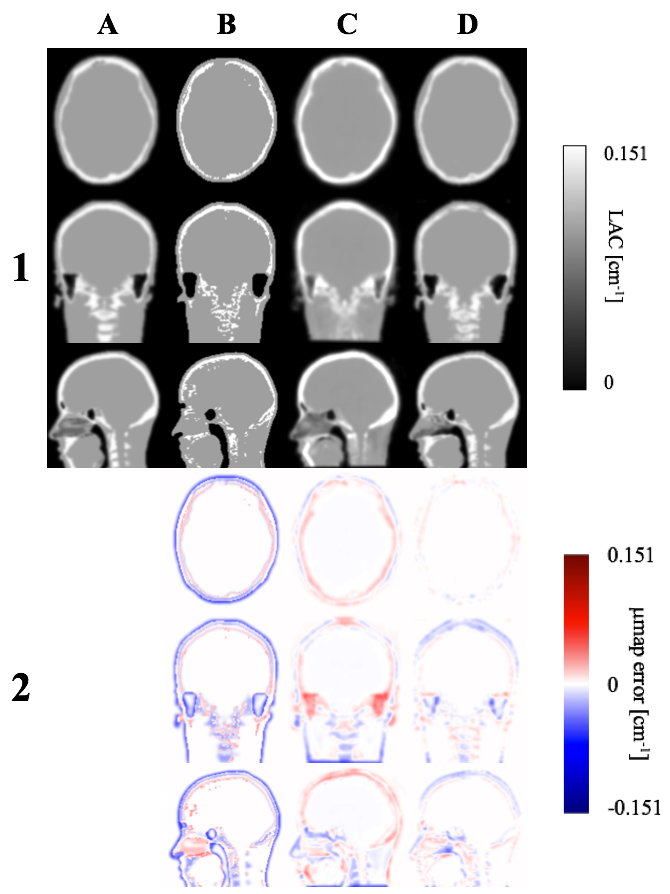
μ-maps: As shown in Figure 2, the proposed μ-mapDL method shows more accurate classification of bone across the whole head than both μ-mapUTE and μ-mappCT. The greatest improvement was observed in segmentation of cervical vertebrae. Excellent segmentation of cortical bone is noted with μ-mapDL, whereas the μ-mappCT shows significant overestimation of that region.
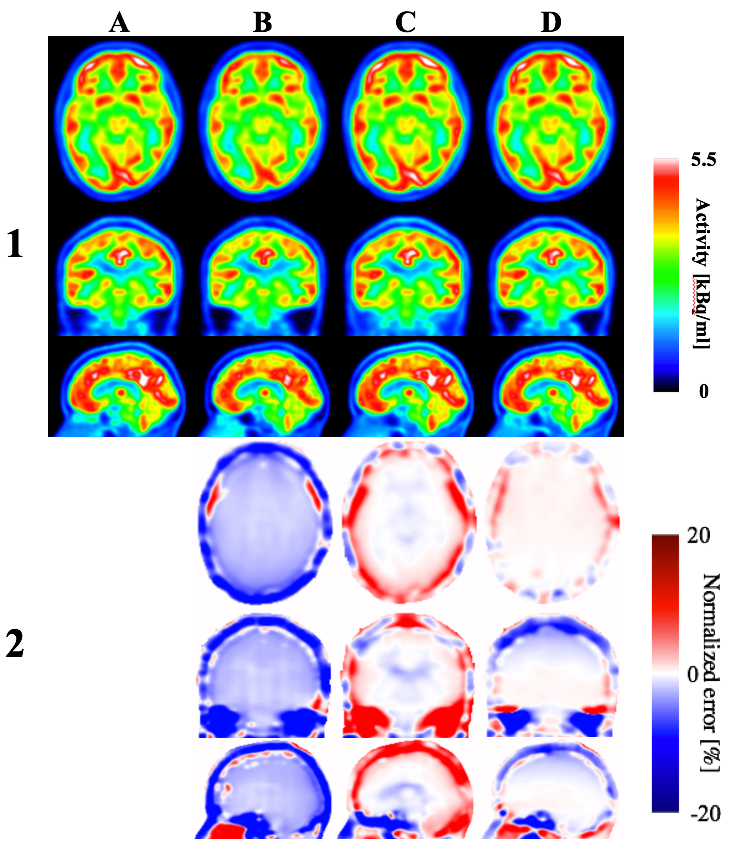
Reconstructed images: Figure 3 shows reconstructed PET images and normalized errors for a representative subject. Significant improvements are found in the whole brain and cortical bone using the proposed technique, compared to the other techniques. The subject level observations are reflected at group level, as shown in Figure 4. Calculated mean relative error for the whole brain is smaller for PETDL (-0.9%) compared to PETpCT and PETUTE (-3.6% and 1.7%, respectively).
Discussion and conclusions
We have investigated the implementation of a deep learning-based segmentation method for PET attenuation correction, and the impact on reconstructed PET images. The proposed method shows significant improvements in bone segmentation in nasal cavities, vertebrae, and other extracranial regions, that resulted in more accurate quantitative PET images throughout the whole head. The underestimation of the uptake in parietal lobe observed in the PETDL may be caused by underestimation of cortical bone adjacent to that region. However, significantly more training images are needed in order to improve the neural network performance. The results provide proof-of-principle verification that multi-contrast deep learning-based segmentation with prior anatomical knowledge is a promising method, which could potentially solve the attenuation correction issue for simultaneous PET/MR imaging. Our next steps are to validate the method with a larger cohort, and to further investigate the potential usage of the developed neural network for application to whole-body PET datasets.Acknowledgements
We acknowledge Siemens Healthineers for providing e7tools software. JB acknowledges the grant received from Monash University that allowed him to work at Monash Biomedical Imaging for 2.5 years. SJ is supported by an ARC Discovery Early Career Researcher Award (DE150100406); GE & SJ are supported by the ARC Centre of Excellence for Integrative Brain Function (CE140100007).References
1 Kaushik, S. et al. Deep Learning based pseudo-CT estimation using ZTE and Dixon MR images for PET attenuation correction. ISMRM 2017 (2017).
2 Palmera Leynes, A. et al. Direct Pseudo-CT Image Synthesis Using Deep Learning for Pelvis PET/MR Attenuation Correction. ISMRM 2017 (2017).
3 Pawar, K., Chen, Z., Shah, N. J. & Egan, G. Residual encoder and Convolutional Decoder Neural Network for Glioma Segmentation. Proceedings of the 6th MICCAI BraTS Challenge (2017).
4 Jia, Y. et al. in Proceedings of the 22nd ACM international conference on Multimedia. 675-678 (ACM).
5 Burgos, N. et al. Attenuation correction synthesis for hybrid PET-MR scanners: application to brain studies. IEEE Trans Med Imaging 33, 2332-2341, doi:10.1109/TMI.2014.2340135 (2014).
Figures