2724
Repeatability of Selected Multiparametric Prostate MRI Radiomics Features1Brigham and Women's Hospital, Boston, MA, United States, 2Harvard Medical School, Boston, MA, United States, 3Netherlands Cancer Institute / Maastricht University, Amsterdam, Netherlands, 4Massachusetts General Hospital, Charlestown, MA, United States, 5Isomics, Inc., Cambridge, MA, United States, 6Dana-Farber Cancer Institute, Boston, MA, United States
Synopsis
In this study we assess the repeatability of selected radiomics features for small prostate tumors in ADC and T2-weighted images. We used a prostate mpMRI test-retest dataset for our evaluation. Different configurations of preprocessing were compared. The intraclass correlation coefficient was employed as a measure of repeatability. Our results show that several of the selected features have good repeatability, however, only when specific preprocessing was applied. Based on our data, texture computation should be done in 2D. Normalization improves repeatability for ADC features, but not in T2-weighted images.
Introduction
Prognostic and discriminative power of radiomics features have been explored in the analysis of cancer imaging.1 To reliably derive conclusions based on radiomics features, their values must remain stable between two scans, if the condition remains stable. In this study we assess the repeatability of radiomics features in small tumors - specifically those features recommended in recent literature2,3,4 for quantitative analysis of multiparametric prostate MR images (mpMRI).
Various means of preprocessing the images prior to feature calculation were suggested in the above mentioned literature.2,3,4 Image normalization/rescaling is applied only for texture features,3 for all features,2 or not at all.4 3D computation of texture features is only mentioned in one study,3 while others2,4 do not specify whether their computations are in 2D or 3D. Overall, the description of the preprocessing often lacks details to allow for exact reproduction of the calculations. Hence, we also evaluate various factors influencing the reliability of feature calculation.
Methods
The study used a previously published prostate mpMRI test-retest dataset composed of fifteen treatment-naïve men with biopsy-confirmed (n=11) or suspected (n=4) prostate cancer (PCa). Patients underwent a second MR within two weeks after the first MR, without any interim treatment.5 A radiologist with 10+ years of experience in prostate mpMRI segmented the tumor regions of interest (ROIs) in the baseline and follow-up T2-weighted axial (T2w) images (TR 3350-5109, TE 84-107, FoV 140-200) and Apparent Diffusion Coefficient (ADC) maps derived from Diffusion-weighted MRI (b0-1400, TR 2500-8150, TE 76-80, FoV 160-280). All tumor ROIs used for calculating the features were smaller than 0.8 ml.
We evaluated the following radiomics features in T2w and ADC images, previously shown as informative for PCa classification2,3,4: First-order intensity features (Mean, Median, 10th Percentile, Skewness, Standard Deviation, Kurtosis) and Haralick texture features (Energy, Entropy, Correlation, Homogeneity, Contrast).
Features were extracted for all ROIs using pyradiomics v1.3.0.6 Computations were done for all combinations of normalized (mean=300, standard deviation=100) and original (no normalization applied) images, 2D/3D texture feature computation, as well as bin widths 5, 10, 15, 20 for texture features (bin widths were selected to match recommendations in literature7,8). No filtering or resampling was applied to the original images.
As measure of repeatability we report the intraclass correlation coefficient ICC(1,1),9 as recommended in literature.10 We use the Volume ICC as reference to allow comparison of the repeatability of the radiomics features with the quantitative measure that is already accepted in the community.
Results
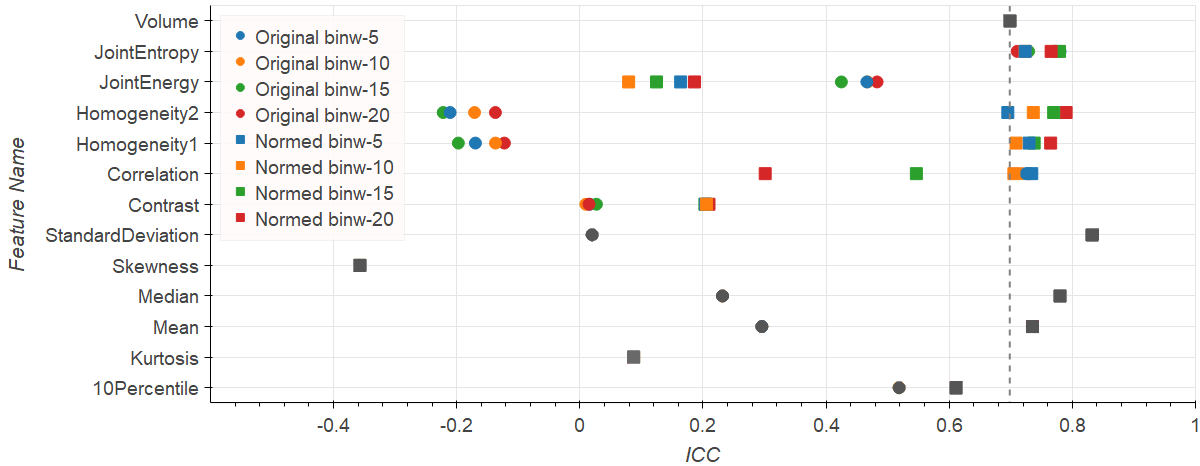
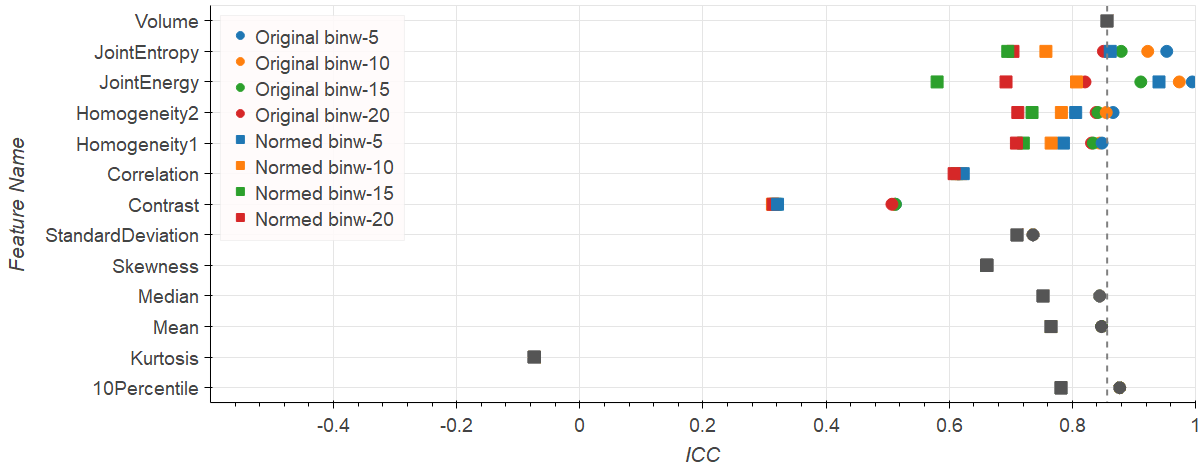
Entropy, Homogeneity, Correlation, Standard Deviation, Median, and Mean in normalized ADC reach ICCs around 0.7 or higher, performing equally or better than Volume (ADC Volume ICC=0.7). Normalization leads to improved ICC in ADC images in most cases (see Fig.1). Exceptions include Energy (ICC reduced from 0.5 to 0.2 after normalization), and Skewness and Kurtosis, which by definition are not influenced by normalization (ICC<0.1). On the contrary, normalization leads to lower ICC in T2w images (see Fig.2). In original T2w Entropy, Energy, Homogeneity, Median, Mean and 10th Percentile reach ICC>0.84 (reference T2w Volume ICC=0.86).
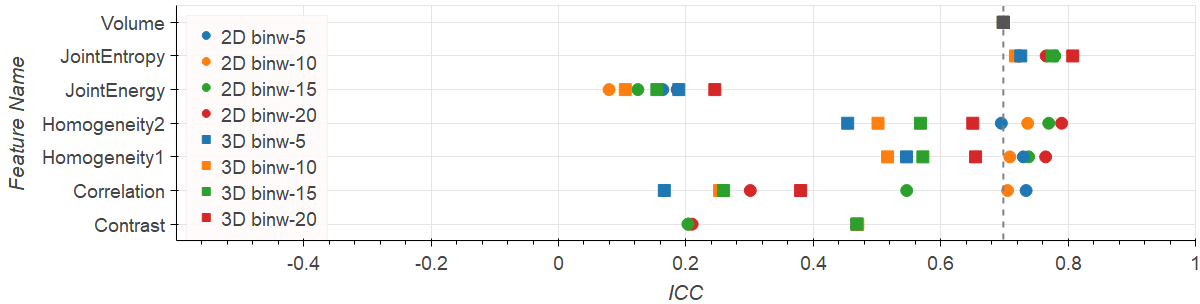
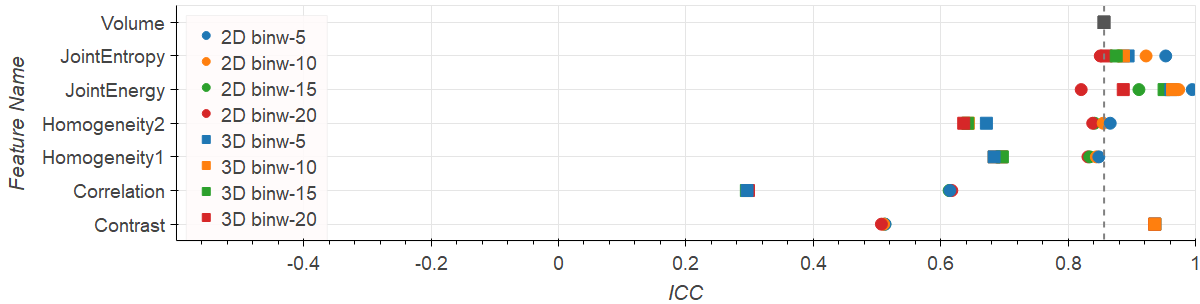
Comparing 2D versus 3D texture computations (Figs.3-4) show that for Homogeneity and Correlation the 2D ICCs are higher than for 3D. For Entropy and Energy the repeatability for 3D and 2D lie in a similar range. Only Contrast has improved ICC under 3D computations: 0.94 vs. 0.51 in T2w, and 0.47 vs. 0.21 in ADC.
The influence of different bin widths on texture features results in variations in the ICC of 0.1-0.2. Exceptions are Correlation on normalized ADC, and Energy on normalized T2w images, both with the ICC spreading over a range of 0.4 (see Figs.1-4).
Discussion and Conclusion
We observed good repeatability (ICC≥Volume ICC) for some of the literature recommended features for prostate cancer (Entropy, Homogeneity, Standard Deviation, Median, Mean), but not for all of them (notable examples include Kurtosis, Contrast, and ADC Energy). However, even features with good repeatability showed these only under specific preprocessing configurations. Based on our data, 2D computation is recommendable as well as normalization for ADC and no normalization for T2w.
Our study is limited to small tumors, but already shows that many factors are influencing the reliability of radiomics features on mpMRI. Since recommendations among recent studies are not consistent, we suggest caution when adopting reported features, and encourage further investigations. We especially advocate reporting all details regarding the preprocessing in radiomics studies, following the consensus definitions of features,11 and strongly recommend making the implementation available. Regarding the latter, our study utilized a publicly available open source radiomics library. We are in the process of making public the dataset used in this study and the calculated radiomics features.
Acknowledgements
Funding support: NIH U01 CA151261, U24 CA180918, P41 EB015898, R01 CA111288, R01 CA160902, U24 CA194354, and U01 CA190234.References
1. Aerts HJWL, Velazquez ER, Leijenaar RTH, et al. Decoding tumour phenotype by noninvasive imaging using a quantitative radiomics approach. Nat Commun. 2014;5:1-8. doi:10.1038/ncomms5006.
2. Fehr D, Veeraraghavan H, Wibmer A, et al. Automatic classification of prostate cancer Gleason scores from multiparametric magnetic resonance images. Proc Natl Acad Sci. 2015;112(46):E6265-E6273. doi:10.1073/pnas.1505935112.
3. Wibmer A, Hricak H, Gondo T, et al. Haralick texture analysis of prostate MRI: utility for differentiating non-cancerous prostate from prostate cancer and differentiating prostate cancers with different Gleason scores. Eur Radiol. 2015;25(10):2840-2850. doi:10.1007/s00330-015-3701-8.
4. Peng Y, Jiang Y, Yang C, et al. Quantitative analysis of multiparametric prostate MR images: differentiation between prostate cancer and normal tissue and correlation with Gleason score--a computer-aided diagnosis development study. Radiology. 2013;267(3):787-796. doi:10.1148/radiol.13121454.
5. Fedorov A, Vangel MG, Tempany CM, Fennessy FM. Multiparametric Magnetic Resonance Imaging of the Prostate: Repeatability of Volume and Apparent Diffusion Coefficient Quantification. Invest Radiol. 2017;52(9):538-546. doi:10.1097/RLI.0000000000000382.
6. van Griethuysen JJM, Fedorov A, Parmar CPG, et al. Computational Radiomics System to Decode the Radiographic Phenotype. Cancer Res. 2017;77(21):104-108. doi:10.1158/0008-5472.CAN-17-0339.
7. Tixier F, Hatt M, Le Rest CC, Le Pogam A, Corcos L, Visvikis D. Reproducibility of Tumor Uptake Heterogeneity Characterization Through Textural Feature Analysis in 18F-FDG PET. J Nucl Med. 2012;53(5):693-700. doi:10.2967/jnumed.111.099127.
8. Leijenaar RTH, Nalbantov G, Carvalho S, et al. The effect of SUV discretization in quantitative FDG-PET Radiomics: the need for standardized methodology in tumor texture analysis. Sci Rep. 2015;5(1):11075. doi:10.1038/srep11075.
9. Shrout PE, Fleiss JL. Intraclass correlations: Uses in assessing rater reliability. Psychol Bull. 1979;86(2):420-428. doi:10.1037/0033-2909.86.2.420.
10. Raunig DL, McShane LM, Pennello G, et al. Quantitative imaging biomarkers: A review of statistical methods for technical performance assessment. Stat Methods Med Res. 2015;24(1):27-67. doi:10.1177/0962280214537344.
11. Zwanenburg A, Leger S, Vallières M, Löck S, Initiative for the IBS. Image biomarker standardisation initiative. 2016;(July). http://arxiv.org/abs/1612.07003.
Figures