2722
Locating hypoxia-related tumour regions in NSCLC: utility and repeatability of data-driven segmentation of combined OE/DCE-MRI data1Division of Informatics, Imaging & Data Sciences, The University of Manchester, Manchester, United Kingdom, 2Division of Cancer Sciences, The University of Manchester, Manchester, United Kingdom, 3Department of Clinical Oncology, Christie NHS Foundation Trust, Manchester, United Kingdom, 4Department of Radiology, Christie NHS Foundation Trust, Mancester, United Kingdom, 5Bioxydyn Ltd., Manchester, United Kingdom
Synopsis
There is a need to develop tumour hypoxia biomarkers for patient stratification and for tracking tumour response to therapy. We apply our preclinically-optimised, data-driven segmentation of combined OE-MRI/DCE-MRI data to a cohort of non small-cell lung cancer (NSCLC) patients, aiming to map tumour hypoxia non-invasively. Tissue classes with different oxygenation and perfusion characteristics are located, and we discuss challenges specific to use in the clinical setting. Further optimisation of the technique is needed to improve its repeatability and its ability to enable the identification of definitively hypoxic regions in these types of data.
Introduction
Hypoxia is a negative prognostic marker in solid tumours1,2. Intratumoural measurement of hypoxia is necessary to stratify patients in hypoxia-targeted therapy trials and to monitor efficacy of hypoxia-targeted treatments3. Oxygen-enhanced (OE) MRI4,5 can assess tissue oxygenation in tumours6–9 and healthy tissues10–12, and in combination with DCE-MRI can locate hypoxia in preclinical tumours13,14. Here, we apply our optimised, data-driven (ODD) segmentation of OE/DCE-MRI data15 to a cohort of non small-cell lung cancer (NSCLC) patients, evaluating whether preclinically-optimised methods can identify hypoxia-related regions and provide benefit over a threshold-based method (TBM)13. We assess repeatability and identify specific challenges in translating ODD to clinical NSCLC data.Methods
Patients
15 NSCLC patients (stage I-IV) underwent one or two baseline imaging visits (within 7 +/- 5 days). Imaging visits consisted of thoracic, coronal OE-MRI and DCE-MRI, with matched matrix size of 96x96x41 voxels and a 45x45x20.5 cm FOV.
OE-MRI
Inversion recovery (IR) prepared spoiled gradient-recalled echo (SPGR) acquisitions were performed to calculate tissue R1 (R1 = 1/T1) (TR/TE = 2.1/0.496 ms, α = 6°, TI = 10, 50, 300, 1100, 2000, 5000 ms). This was followed by 90-96 dynamic IR SPGR acquisitions (TI = 1100 ms, readout time ~2 s, one image every 10 s, 15-16 minutes in total). During the dynamic series the gas supply to the patient was switched from air (the first 2-3 minutes), to pure oxygen (the following 8 minutes), and back to air (the final 5 minutes).
DCE-MRI
SPGR variable flip angle acquisitions were performed to calculate tissue R1 (TR/TE = 3.3/1.428 ms, α = 2, 4, 7, 10°). This was followed by 75 dynamic SPGR acquisitions (α = 10°, one image every 4.9 s, 6 minutes 8 s in total) where Gd-DOTA was injected into a forearm vein during acquisition 6.
Processing
Dynamic ∆R1 (change from baseline R1) values were calculated from OE and DCE signal data. Median filters were applied to dynamic ∆R1 volumes (OE: 4D spatiotemporal, DCE: 3D spatial). Bulk, respiratory, and cardiac motion was removed via non-linear registration (Bioxydyn Limited, Manchester, UK), and dynamic OE volumes were registered to corresponding DCE volumes (rigid-body, local to tumour region), enabling voxel-wise analyses (Figure 1).
Analysis
ODD segmentation15 was applied, which entailed concatenating OE and DCE curves for each voxel, calculating features using principal component analysis (PCA) applied over all tumours, and clustering features using Gaussian mixture modelling (GMM), creating a data-driven spatial segmentation of tumours. The optimum number of clusters was selected by assessing cluster stability, GMM model goodness-of-fit, and regional contiguity in tumour maps. A three-category threshold-based method (TBM) of segmenting tumours13, previously validated in preclinical models, was also applied to these data, and differences in tissue category volumes between repeat baseline segmentations were calculated to compare the repeatability of ODD with TBM.
Results
PCA extracts three dominant and four subtler components from combined OE/DCE data (Figure 2). ODD segmentation finds six robustly identifiable clusters in the data with differing OE and DCE characteristics (Figure 3). All clusters demonstrate mean ∆R1 curves with detectable OE enhancement that scales with corresponding mean DCE enhancement. Regions of ODD-defined low DCE and low OE enhancement correspond to TBM-defined “perfused oxy-R” and “non-perfused” tissue classes13. Maps contain spatially contiguous regions and repeat baseline visits show spatial repeatability (Figure 4). Coefficients of repeatability (CR) show variations of segmented tissue volumes of 39.8% (ODD) and 35.6% (TBM) (Figure 5).Discussion
Substantial methodological additions relative to the preclinical setting are motion correction, co-registration of OE-MRI with DCE-MRI data, and noise reduction. These steps allow PCA to extract physiologically relevant information from ∆R1 curves with relatively few components, and allow TBM to be reliably applied. ODD and TBM are both feasible techniques in the clinical setting in NSCLC patients, and there is a large degree of consistency between the regions identified using the two methods. Interestingly, within low-enhancing regions we observed low but non-zero mean OE-enhancement. In ODD, this could be due to the technique being optimised for preclinical hypoxic tissue identification and failing to capture all relevant signal features when translated directly into the clinical setting. Other confounding factors could be limited spatial (~5 mm) and temporal (10 s) resolution, residual motion artefacts, point spread function, or a lack of ground truth.Conclusions
ODD and TBM were successfully applied in patient NSCLC data, locating distinct categories of tumour tissue. Challenges specific to use in the clinical setting were discovered and addressed. Further optimisation of ODD is needed to improve the repeatability of the technique and to enable the identification of definitively hypoxic regions in these types of data.Acknowledgements
This work was funded by the CRUK & EPSRC Cancer Imaging Centre in Cambridge and Manchester (C8742/A18097).References
1. Vaupel, P. & Mayer, A. Hypoxia in cancer: Significance and impact on clinical outcome. Cancer Metastasis Rev. 26, 225–239 (2007).
2. Wilson, W. R. & Hay, M. P. Targeting hypoxia in cancer therapy. Nat. Rev. Cancer 11, 393–410 (2011).
3. Hunter, F. W., Wouters, B. G. & Wilson, W. R. Hypoxia-activated prodrugs: paths forward in the era of personalised medicine. Br. J. Cancer 114, 1071–1077 (2016).
4. Ogawa, S., Lee, T. M., Nayak, A. S. & Glynn, P. Oxygenation-sensitive contrast in magnetic resonance image of rodent brain at high magnetic fields. Magn. Reson. Med. 14, 68–78 (1990).
5. Ohno, Y. & Hatabu, H. Basics concepts and clinical applications of oxygen-enhanced MR imaging. Eur. J. Radiol. 64, 320–328 (2007).
6. Burrell, J. S. et al. Exploring Δr2* and Δr1 as imaging biomarkers of tumor oxygenation. J. Magn. Reson. Imaging 38, 429–434 (2013).
7. Linnik, I. V. et al. Noninvasive tumor hypoxia measurement using magnetic resonance imaging in murine U87 glioma xenografts and in patients with glioblastoma. Magn. Reson. Med. 71, 1854–1862 (2014).
8. Hallac, R. R. et al. Correlations of noninvasive BOLD and TOLD MRI with pO2 and relevance to tumor radiation response. Magn. Reson. Med. 71, 1863–1873 (2014).
9. Matsumoto, K.-I. et al. MR assessment of changes of tumor in response to hyperbaric oxygen treatment. Magn. Reson. Med. 56, 240–246 (2006).
10. O’Connor, J. P. B. et al. Comparison of normal tissue R1 and R*2 modulation by oxygen and carbogen. Magn. Reson. Med. 61, 75–83 (2009).
11. Remmele, S. et al. Dynamic and simultaneous MR measurement of R1 and R 2* changes during respiratory challenges for the assessment of blood and tissue oxygenation. Magn. Reson. Med. 70, 136–146 (2013).
12. Ganesh, T., Estrada, M., Duffin, J. & Cheng, H.-L. M. T2* and T1 Assessment of Abdominal Tissue Response to Graded Hypoxia and Hypercapnia Using a Controlled Gas Mixing Circuit for Small Animals. J. Magn. Reson. Imaging 44, 305–316 (2016).
13. O’Connor, J. P. B. et al. Oxygen-Enhanced MRI Accurately Identifies, Quantifies, and Maps Tumor Hypoxia in Preclinical Cancer Models. Cancer Res. 76, 787–795 (2016).
14. Dewhirst, M. W. & Birer, S. R. Oxygen-Enhanced MRI Is a Major Advance in Tumor Hypoxia Imaging. Cancer Res. 76, 769–772 (2016).
15. Featherstone, A. K. et al. Data-Driven Mapping of Hypoxia-Related Tumor Heterogeneity Using DCE-MRI and OE-MRI. In press, (2017).
Figures
Figure 1:
DCE-MRI series for a central slice of patient 1, showing signal data pre- and post- motion-correction. Arrows indicate the location of the primary tumour. The difference between left and right panels show how bulk, respiratory, and cardiac motion have been removed with a non-linear registration, but motion-related artefacts (e.g. signal flickering) remain. The same form of motion-correction was applied to OE-MRI volumes. OE-MRI and DCE-MRI volumes were then aligned using a rigid-body registration (local to the tumour region), enabling voxel-wise analyses.
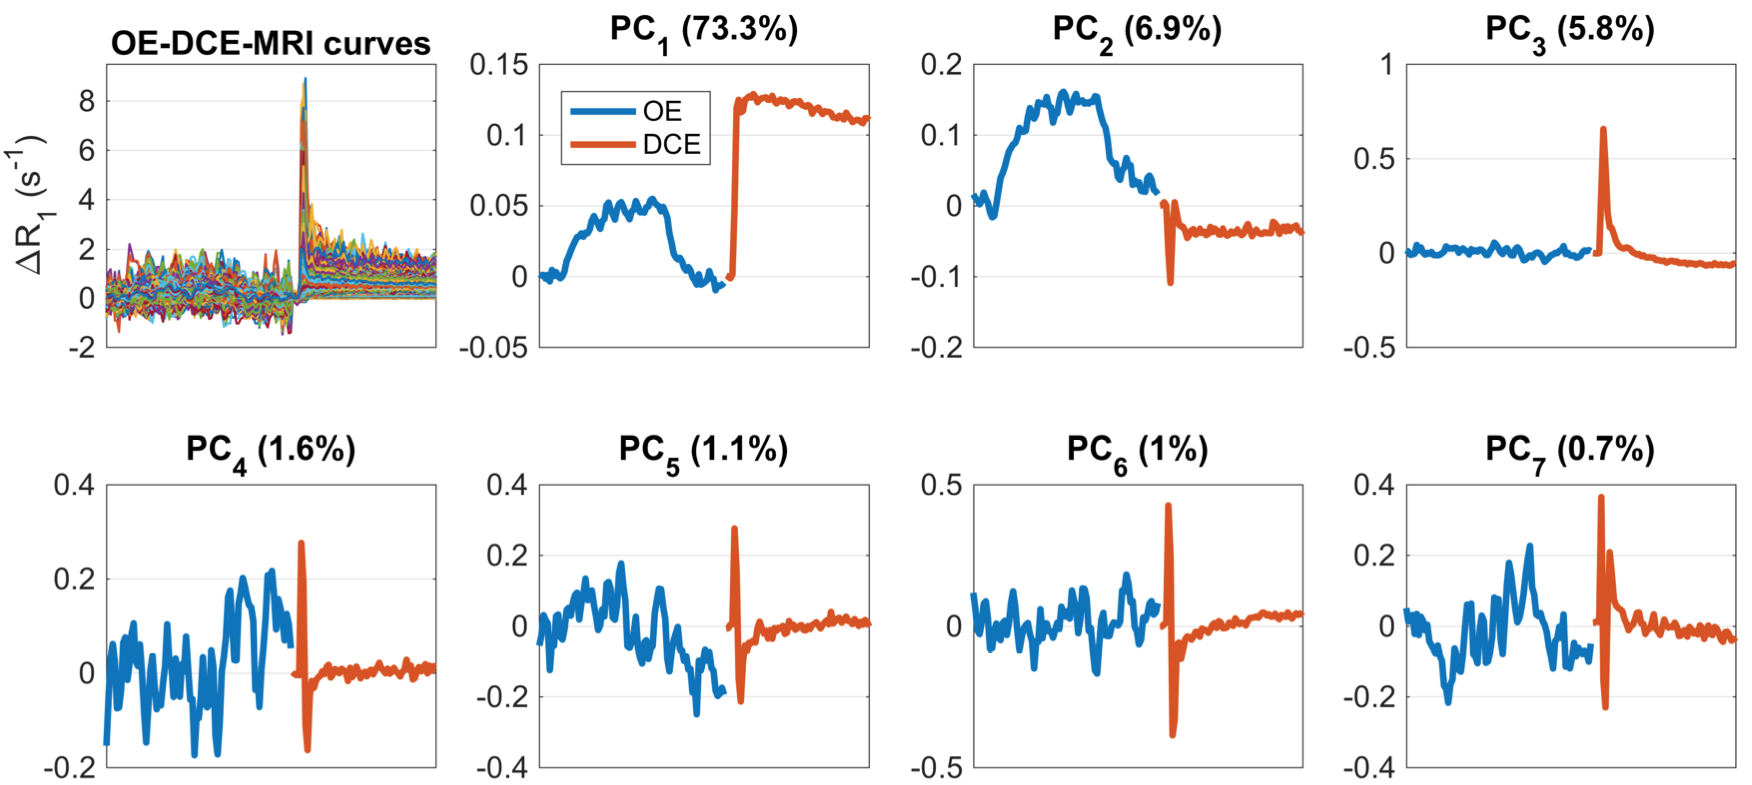
Figure 2:
Results from principal component analysis (PCA) of combined OE/DCE data across the whole cohort. The top left panel shows composite OE-DCE-MRI ∆R1 curves, where OE-MRI curves were scaled prior to concatenating with DCE curves (scaling factor: ratio of mean standard deviation across DCE curves to OE curves = 13.8). Remaining panels show the first 7 principal components (PCs) and the percentage of data variance explained by each component.
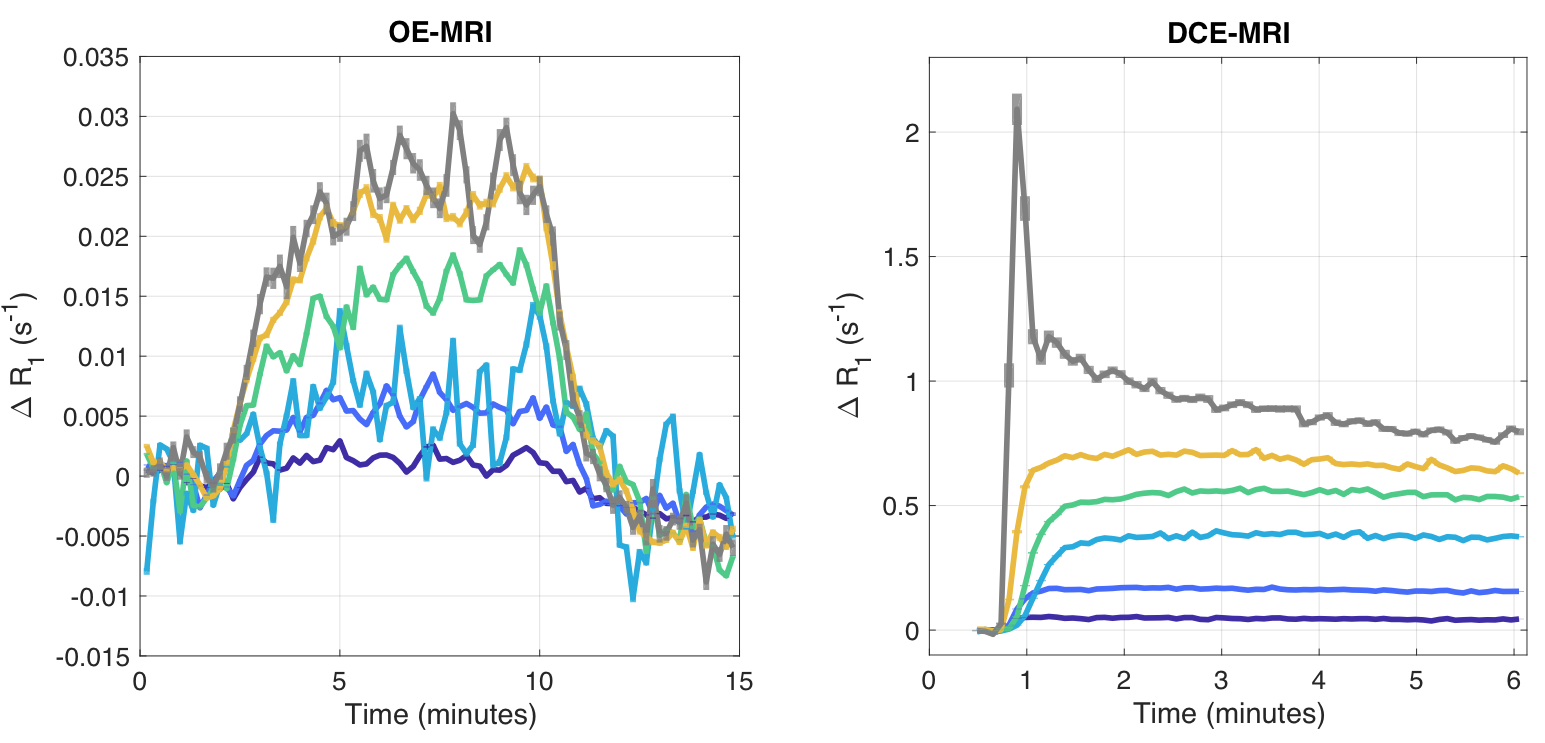
Figure 3:
Results from ODD segmentation of NSCLC data, where colours correspond to ODD tissue categories in Figures 4 and 5. Mean ∆R1 enhancement curves are shown for OE-MRI (left) and DCE-MRI (right) for the 6 clusters located using ODD. Curves show varying levels of OE-MRI and DCE-MRI enhancement, corresponding to varying levels of tissue oxygenation and perfusion, respectively. There is a a proportional relationship in curve magnitudes, though DCE-MRI curves show additional kinetics consistent with changes in Ktrans.
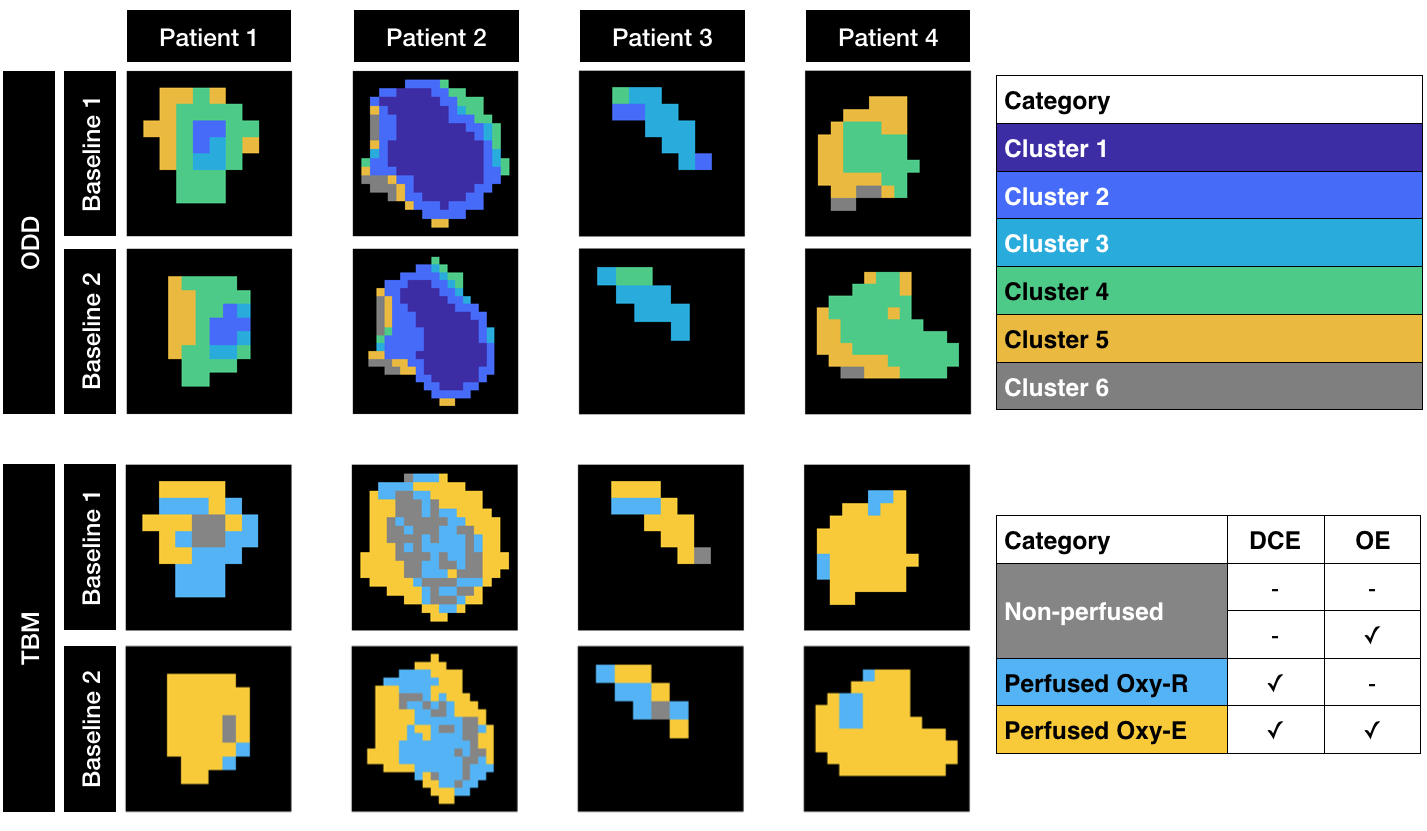
Figure 4:
Results from ODD and TBM segmentation of NSCLC data, where colours match Figures 3 and 5. Region maps are shown for 4 (of 8) patients that had repeat baseline scans, with ODD locating 6 clusters (as supported by the data) and TBM locating 3 categories based on statistical thresholds. Repeat baseline maps appear spatially concordant between baselines, though this is more apparent in ODD than TBM. In ODD, principal component analysis creates a low noise feature space, perhaps explaining the higher contiguity of sub-regions and higher spatial repeatability compared with TBM.
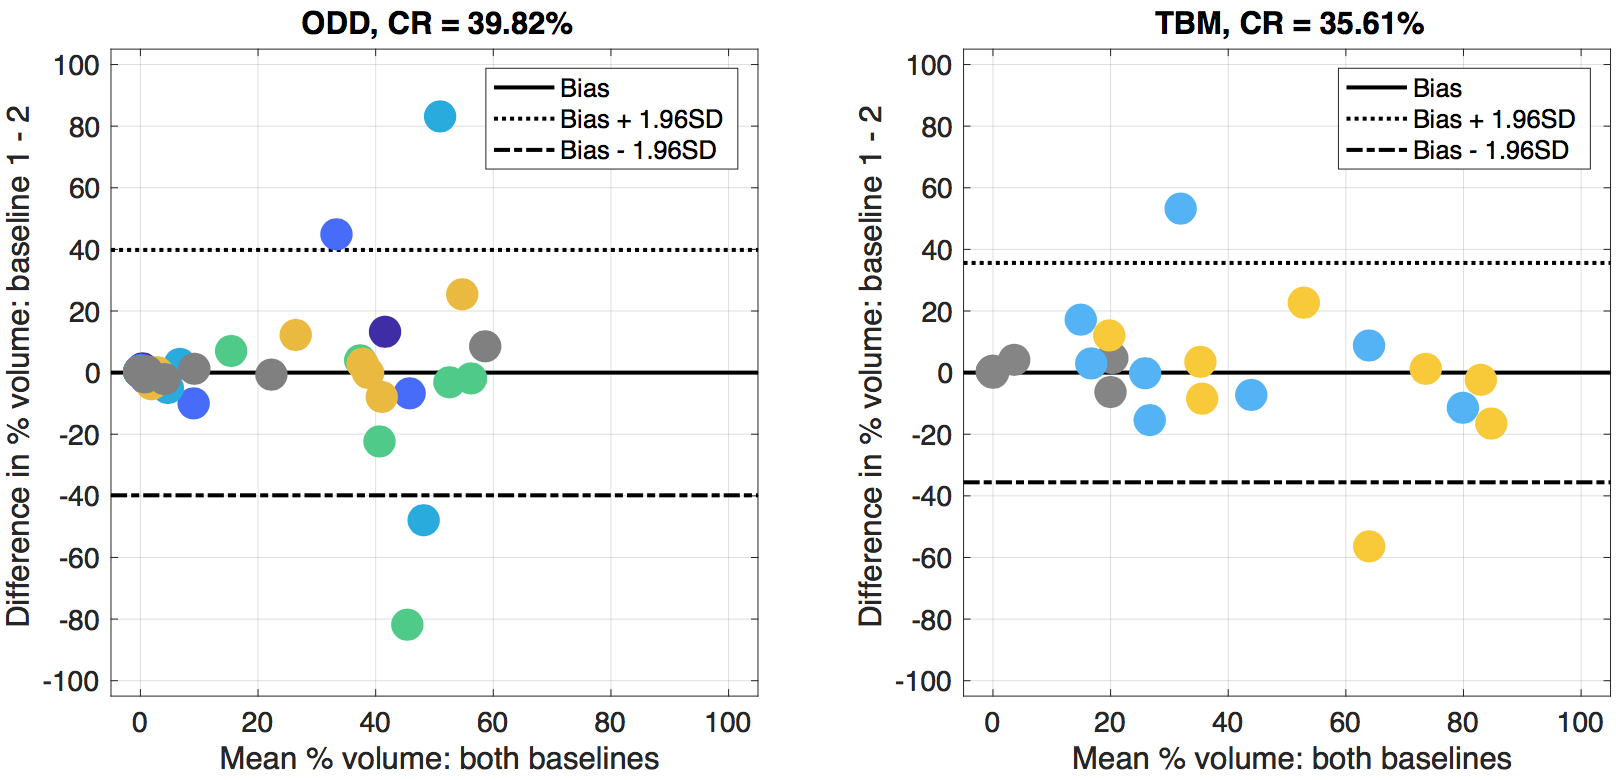
Figure 5:
Bland-Altman plots comparing the volume fractions of each tissue category across both baseline visits. Plots contain values for the 8 patients that had repeat baseline scans, with results shown for ODD segmentation (left) and TBM segmentation (right). Colours are matched to corresponding categories in Figure 4. ODD and TBM categorise tissues with a similar level of repeatability across repeated baseline scans (coefficients of repeatability, CR, = 39.82% and 35.61%, respectively).