2715
Motion Detection and Quality Assessment of MR images with Deep Convolutional DenseNetsSandro Braun1, Xiao Chen1, Benjamin Odry1, Boris Mailhe1, and Mariappan Nadar1
1Medical Imaging Technologies, Siemens Healthineers, Princeton, NJ, United States
Synopsis
We use simulated motion-corrupted images to compute associated image quality metrics and quantify the corresponding severity of motion. We train models with four different inputs (full image, Foreground only, Background only or both Foreground and Background in two channels) to regress to those metrics. To obtain a ground-truth as acceptable or not acceptable image quality, we choose acceptance thresholds within a reasonable range, depending on the level of tolerable motion. The network shows high accuracy within this range. For both metrics used (MSSIM and NRMSE), BG-models perform better than FGBG-models.
Introduction
Existing approaches to assess motion artifact severity in MR images rely on navigators1,2, optical tracking cameras3, analyzing the air background4 or sequences with special motion-sensitive sampling patterns5. With the rise of machine learning based solutions, it becomes appealing to simply learn a function that matches radiologists’ quality opinions by training end-to-end. Nevertheless, motion-corrupted data is barely available and even more rarely annotated. We therefore simulated motion-corrupted images to compute associated metrics and quantify the corresponding severity of motion. We finally train a neural network to regress to those metrics and ultimately detect whether the image is of acceptable quality or not.Methods
Motion corrupted images are generated from subsets of the publicly available dataset HCP6. The motion model assumes 2D in-plane translational motion for each slice, where the static object is shifted in the image space and then transformed into k-space to mimic data acquisition with motion. The k-space readout is assumed fast enough to freeze any patient motion and only inter-readout motion are simulated. To mimic real MR acquisitions where k-space data may not be collected sequentially, random numbers of motion-affected readout lines are used and these lines are selected randomly for each 2D k-space. The direction and the magnitude of the displacement are also randomly assigned to each affected lines. After replacing all motion-affected readout lines, the k-space data is transformed back into image space. For each slice, we compute the normalized L2-distance between the simulated and the original image (NRMSE) and the MSSIM7 that we use as quality metrics. Each metric is then used as target of a regression task. A fully convolutional Dense-Net8 architecture depicted in figure 1 was trained without fully connected layers. As motion artifacts in MR images propagate into the background, an object mask computed via histogram analysis was used to separate the foreground (FG) to the background (BG). We trained four models that would take either the full image (IMG-model), FG only (FG-model), BG only (BG-model) or both FG and BG in two channels as input (FGBG-model). The training set included 230,104 2D slices from 90 T2 weighted volumes including all three orientations. Data augmentation included random transformations, such as identity, horizontal and vertical mirroring, and 90, 180 and 270 degrees rotations. The data split is 90% for training and 10% for validation. Inputs are normalized to zero mean and unit standard deviation. We train end-to-end with a batch size of 20 and the Adam optimizer9 with a learning rate of 10-4 to minimize the L1-distance. In a real world scenario, an image is either of an acceptable quality or not. We establish an acceptable / not acceptable ground truth by setting a threshold on the previously mentioned metrics from figure 2. Any threshold within a reasonable range could be a valid choice, depending on the level of tolerable motion. Therefore, we calculate the accuracy for a range of thresholds across the range of scores that we obtained for each metric by thresholding targets and predictions.Results
We define a range of potential thresholds for cases with very little motion, close to the optimal metric value (figure 3). For both metrics used, BG-models perform better than FGBG-models. Models that have background input seem to converge to the same performance when moving the threshold away from the optimum. We test the sensitivity of the models for a fixed ground truth threshold and plot the ROC-curve in figure 4. The threshold is chosen to be 0.01 for the NRMSE and 0.99 for the MSSIM. Models including background information share AUC-ROC values above 0.99 for both metrics. FG-only models perform slightly worse (0.9826 for NRMSE and 0.989 for MSSIM). We visualize the network activation in a guided backpropagation map10 in figure 5.Conclusions
We present a regression approach for image quality assessment of simulated motion-corrupted MR-images. With simulated images, we use a reference metric to establish a motion related image quality metric and compare the importance of foreground and background information for two different image metrics, the NRMSE and the MSSIM. We present a network that is capable of regressing to both metrics with high accuracy and can be trained on arbitrary input dimensions without the need of padding. Since metric functions for clinical image quality is still an active field of research, this framework can be adapted for any metric that is to be found in future research11.Acknowledgements
No acknowledgement found.References
[1] Forbes, Kirsten PN, James G Pipe, C Roger Bird, and Joseph E Heiserman. “PROPELLER MRI: Clinical Testing of a Novel Technique for Quantification and Compensation of Head Motion.” Journal of Magnetic Resonance Imaging 14, no. 3 (2001): 215–22. [2] Kober, Tobias, José P Marques, Rolf Gruetter, and Gunnar Krueger. “Head Motion Detection Using FID Navigators.” Magnetic Resonance in Medicine 66, no. 1 (2011): 135–43. [3] Zaitsev, Maxim, Christian Dold, Georgios Sakas, Jürgen Hennig, and Oliver Speck. “Magnetic Resonance Imaging of Freely Moving Objects: Prospective Real-Time Motion Correction Using an External Optical Motion Tracking System.” Neuroimage 31, no. 3 (2006): 1038–50. [4] Mortamet et al. “Automatic Quality Assessment in Structural Brain Magnetic Resonance Imaging.” Magnetic Resonance in Medicine 62, no. 2 (August 2009): 365–72. https://doi.org/10.1002/mrm.21992. [5] Bones, Philip J, Julian R Maclaren, Rick P Millane, and Richard Watts. “Quantifying and Correcting Motion Artifacts in MRI.” In Image Reconstruction from Incomplete Data IV, 6316:631608. International Society for Optics and Photonics, 2006. [6] David C. Van Essen, Stephen M. Smith, Deanna M. Barch, Timothy E.J. Behrens, Essa Yacoub, Kamil Ugurbil, for the WU-Minn HCP Consortium. (2013). The WU-Minn Human Connectome Project: An overview. NeuroImage 80(2013):62-79. [7] Wang, Z., A.C. Bovik, H.R. Sheikh, and E.P. Simoncelli. “Image Quality Assessment: From Error Visibility to Structural Similarity.” IEEE Transactions on Image Processing 13, no. 4 (April 2004): 600–612. https://doi.org/10.1109/TIP.2003.819861. [8] Huang, Gao, Zhuang Liu, and Kilian Q. Weinberger. “Densely Connected Convolutional Networks.” CoRR abs/1608.06993 (2016). http://arxiv.org/abs/1608.06993. [9] Kingma, Diederik P., and Jimmy Ba. “Adam: A Method for Stochastic Optimization.” arXiv:1412.6980 [Cs], December 22, 2014. http://arxiv.org/abs/1412.6980. [10] Springenberg, Jost Tobias, Alexey Dosovitskiy, Thomas Brox, and Martin Riedmiller. “Striving for Simplicity: The All Convolutional Net.” arXiv:1412.6806 [Cs], December 21, 2014. http://arxiv.org/abs/1412.6806. [11] Renieblas, Gabriel Prieto, Agustín Turrero Nogués, Alberto Muñoz González, Nieves Gómez León, and Eduardo Guibelalde del Castillo. “Structural Similarity Index Family for Image Quality Assessment in Radiological Images.” Journal of Medical Imaging 4, no. 3 (July 2017): 035501. https://doi.org/10.1117/1.JMI.4.3.035501.Figures
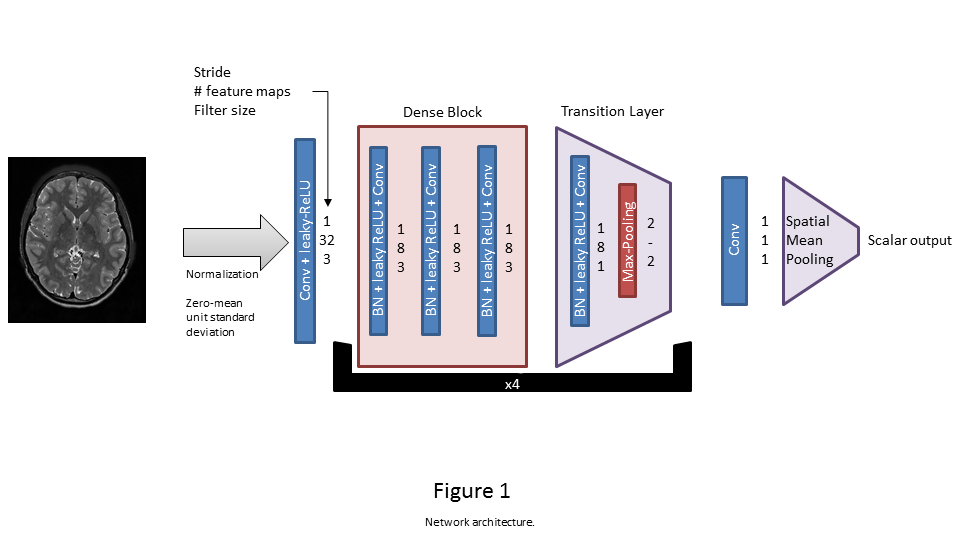
Deep regressor architecture for Motion Scoring
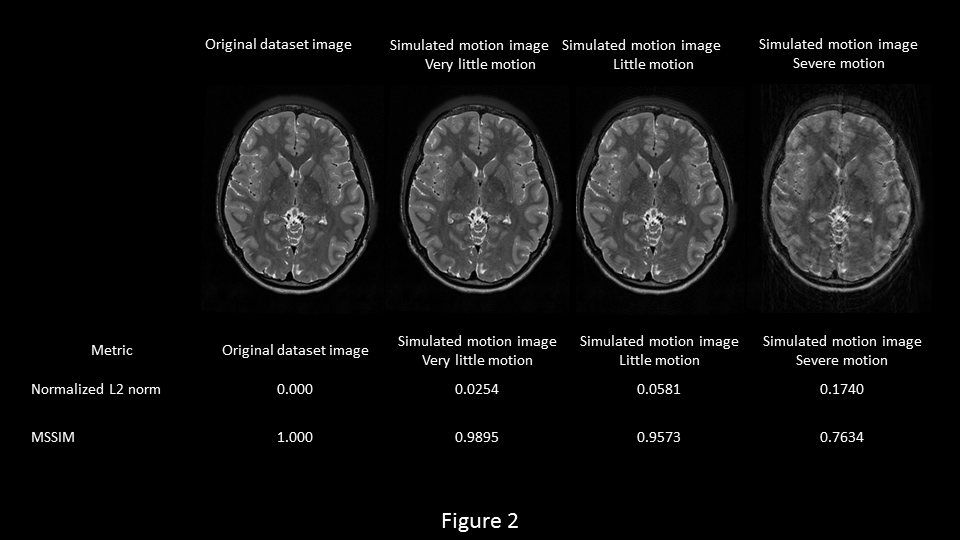
Examples of severity and extent of simulated motion from Human Connectome Project datasets
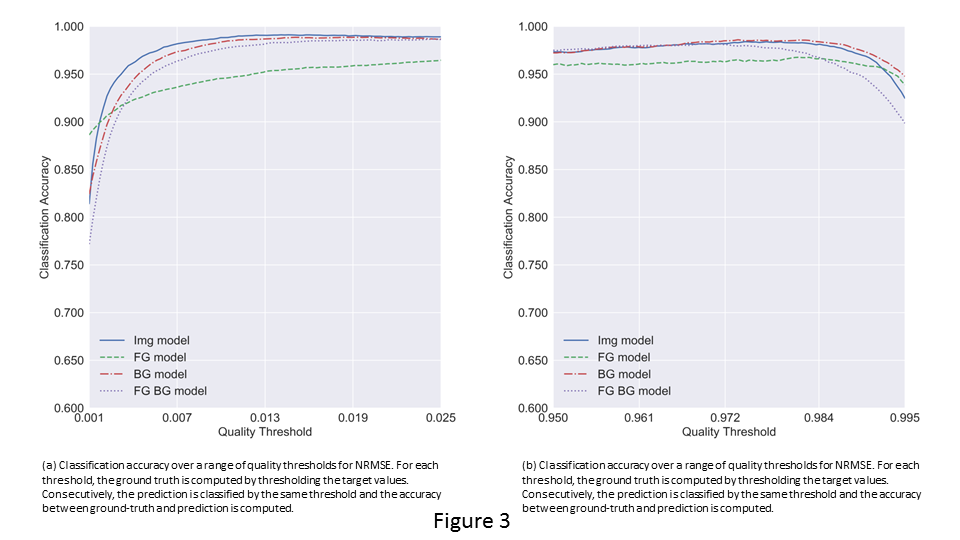
Accuracy of classification as acceptable or not acceptable image quality for a range of motion score that could be set as differentiation threshold for both MSSIM and NRMSE metrics.
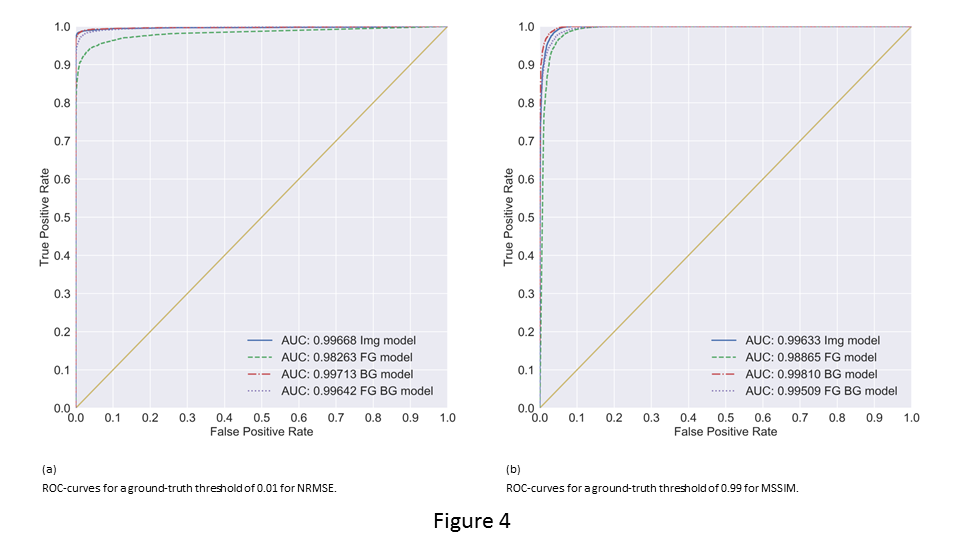
ROC curves for acceptable / not accetable decision with threshold set at 0.01 for NRMSE and 0.99 for MSSIM. All models are shown (Full image, Foreground only, Background only, ForeGround + Background as 2 independent inputs)
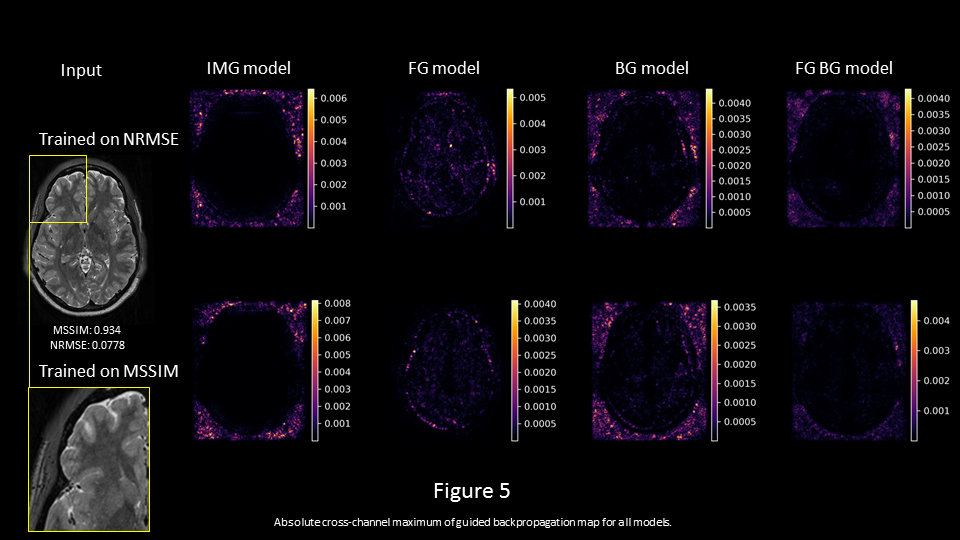
Assessment of motion driving voxels using guided backpropagation / saliency maps. The background drives the detection for small motion.