2712
Computer-aided diagnosis of hepatocellular carcinoma and hepatic cavernous hemangioma using non-enhanced MRI with a random forest classifier1Department of Radiology, The First Affiliated Hospital of Dalian Medical University, Dalian, China, 2Huiying Medical Technology Co., Ltd., Beijing, China, 3GE Healthcare, MR Research, Beijing, China
Synopsis
The current study aims to develop a computer-aided diagnosis (CAD) system and assess its ability in identification of hepatocellular carcinoma (HCC) and hepatic cavernous hemangioma (HCH) using non-enhanced MRI with a random forest classifier. Good performance was observed in this CAD system based on out-phase images.
Introduction
Hepatocellular carcinoma (HCC) and hepatic cavernous hemangioma (HCH) are the two most common types of malignant and benign hepatic tumors respectively1,2. In MRI, contrast enhanced images are often used for differential diagnosis of HCC and HCH. However, for patients that may not take contrast injection, MR diagnosis may be problematic as non-contrast images feature inferior diagnosis accuracy. With the recent development of computer-aided diagnosis (CAD) in radiology, novel quantitative imaging biomarkers become feasible3. In this study, we aim to develop a CAD system and evaluate its feasibility in identification of HCC and HCH using non-enhanced MRI with a random forest classifier.Material and Methods
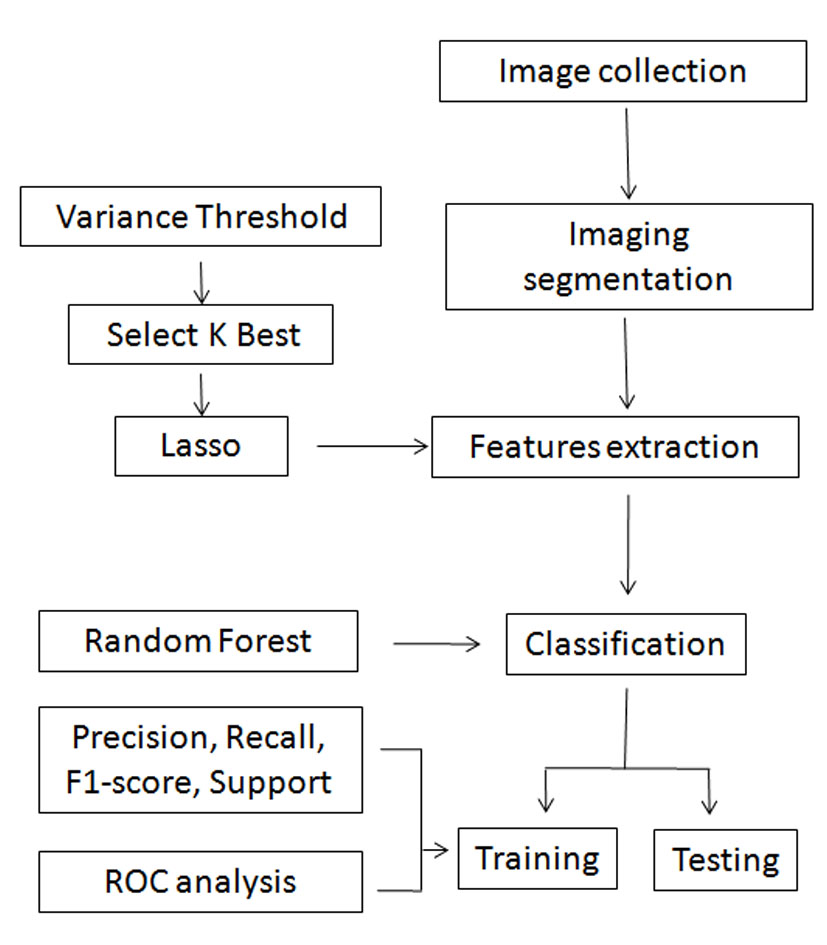
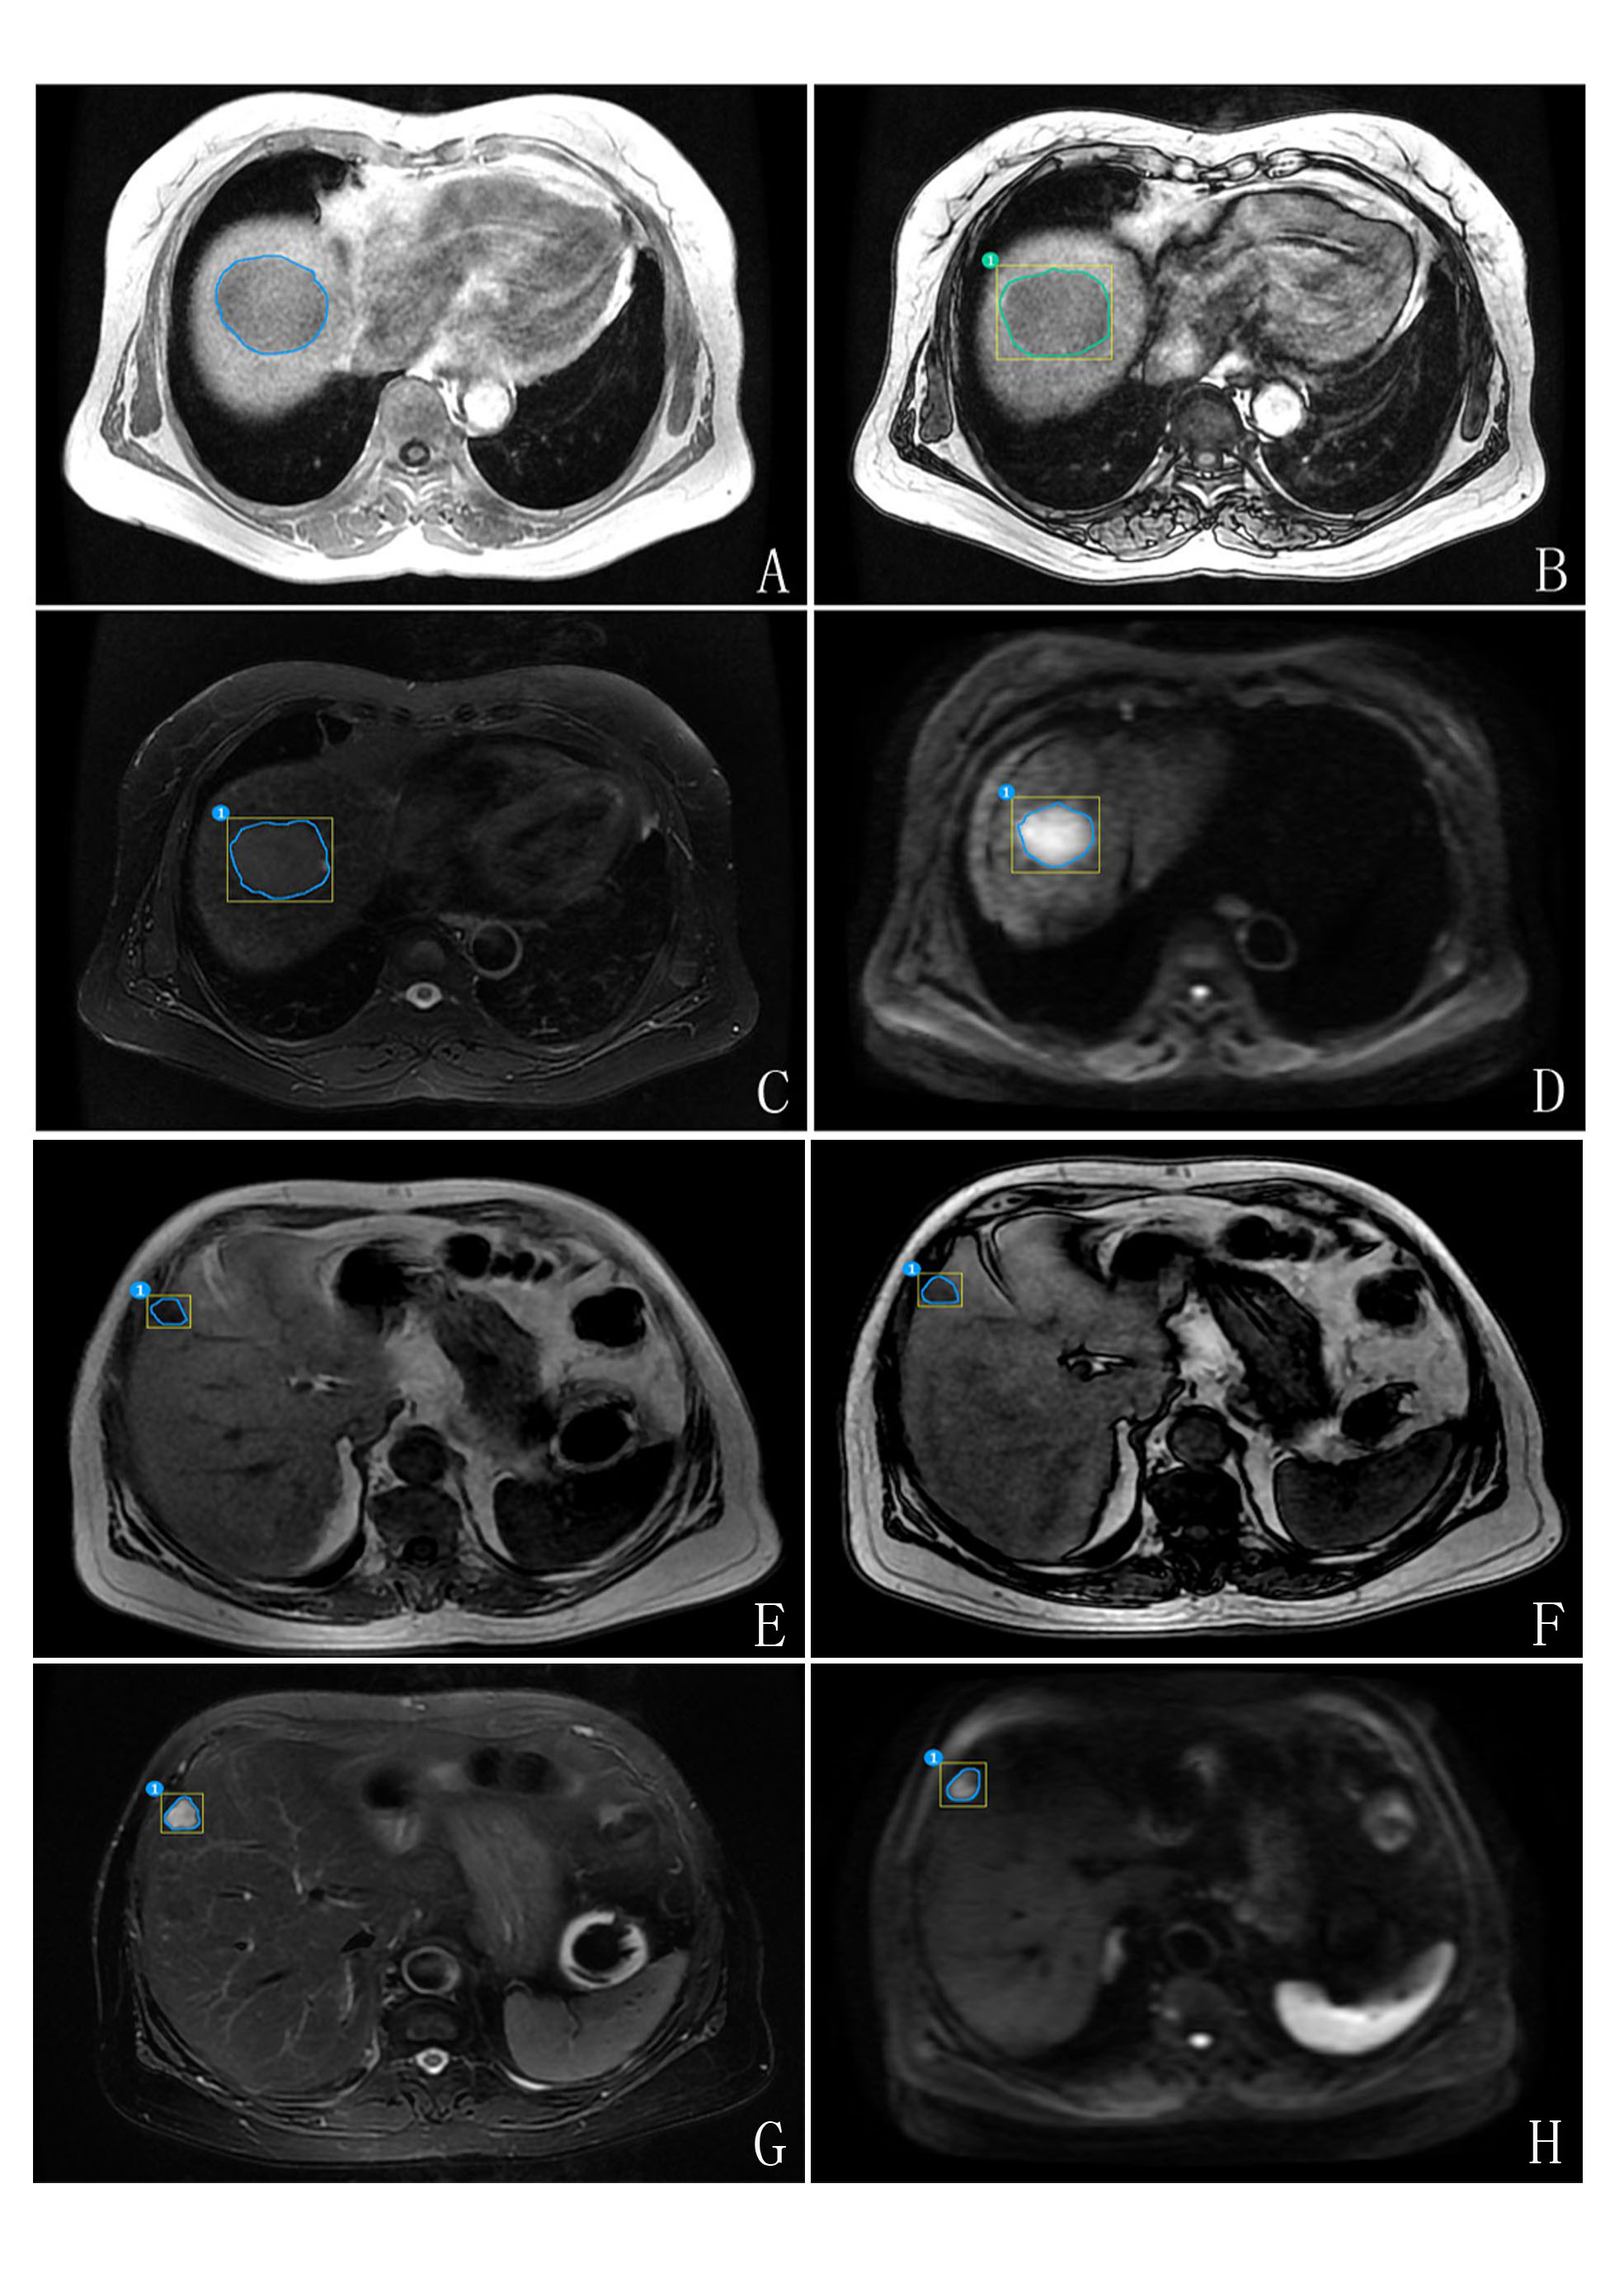
A total of 446 lesions in 369 pathologically confirmed patients (HCC: n=222/446; HCH: n=224/446) were enrolled in this retrospective study. On dual-echo T1WI (in-phase, out-phase), T2WI and DWI images, two radiologists with 3 years-clinical experience were blinded to all patients’ information and manually outlined the lesions. A representative set of patient images of HCC and HCH with outlined lesion regions that were used in feature derivations were shown in Fig.2. 1029 features were calculated and were classified as first order statistic ,shape, gray level co-occurence matrix (GLCM), gray level run length matrix (GLRLM) and gray level size zone matrix (GLSZM), which were also transformed by exponential, square, square root, logarithm and wavelet (wavelet-LHL、wavelet-LHH、wavelet-HLL、wavelet-LLH、wavelet-HLH、wavelet-HHH、wavelet-HHL、wavelet-LLL). In addition, variance threshold, select K best and lasso algorithms were used in the derivation of the features, and random forest classifier was used to identify HCC and HCH based on extracted features. 80% of the samples were randomly selected as training data set, whereas the rest data set was used as the test cohort. Four indicators (recall, precision, f1-score, support) and the area under receiver-operating characteristic curve (AUC) were used to assess the performance of training model. The overall flow chart of the proposed CAD system is illustrated in Fig.1.Results
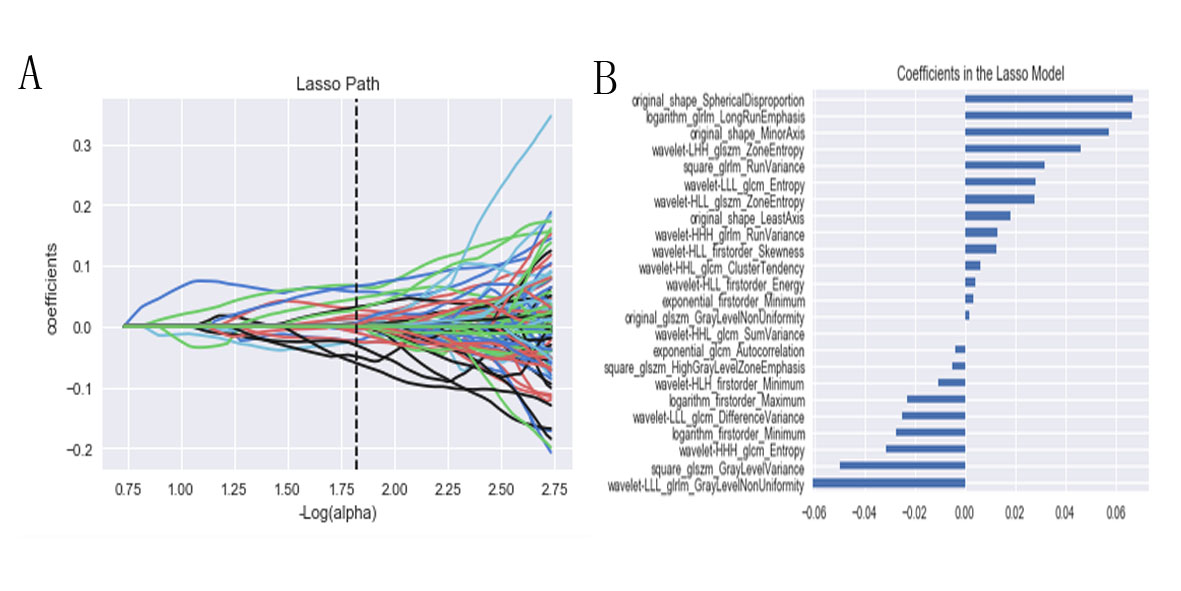
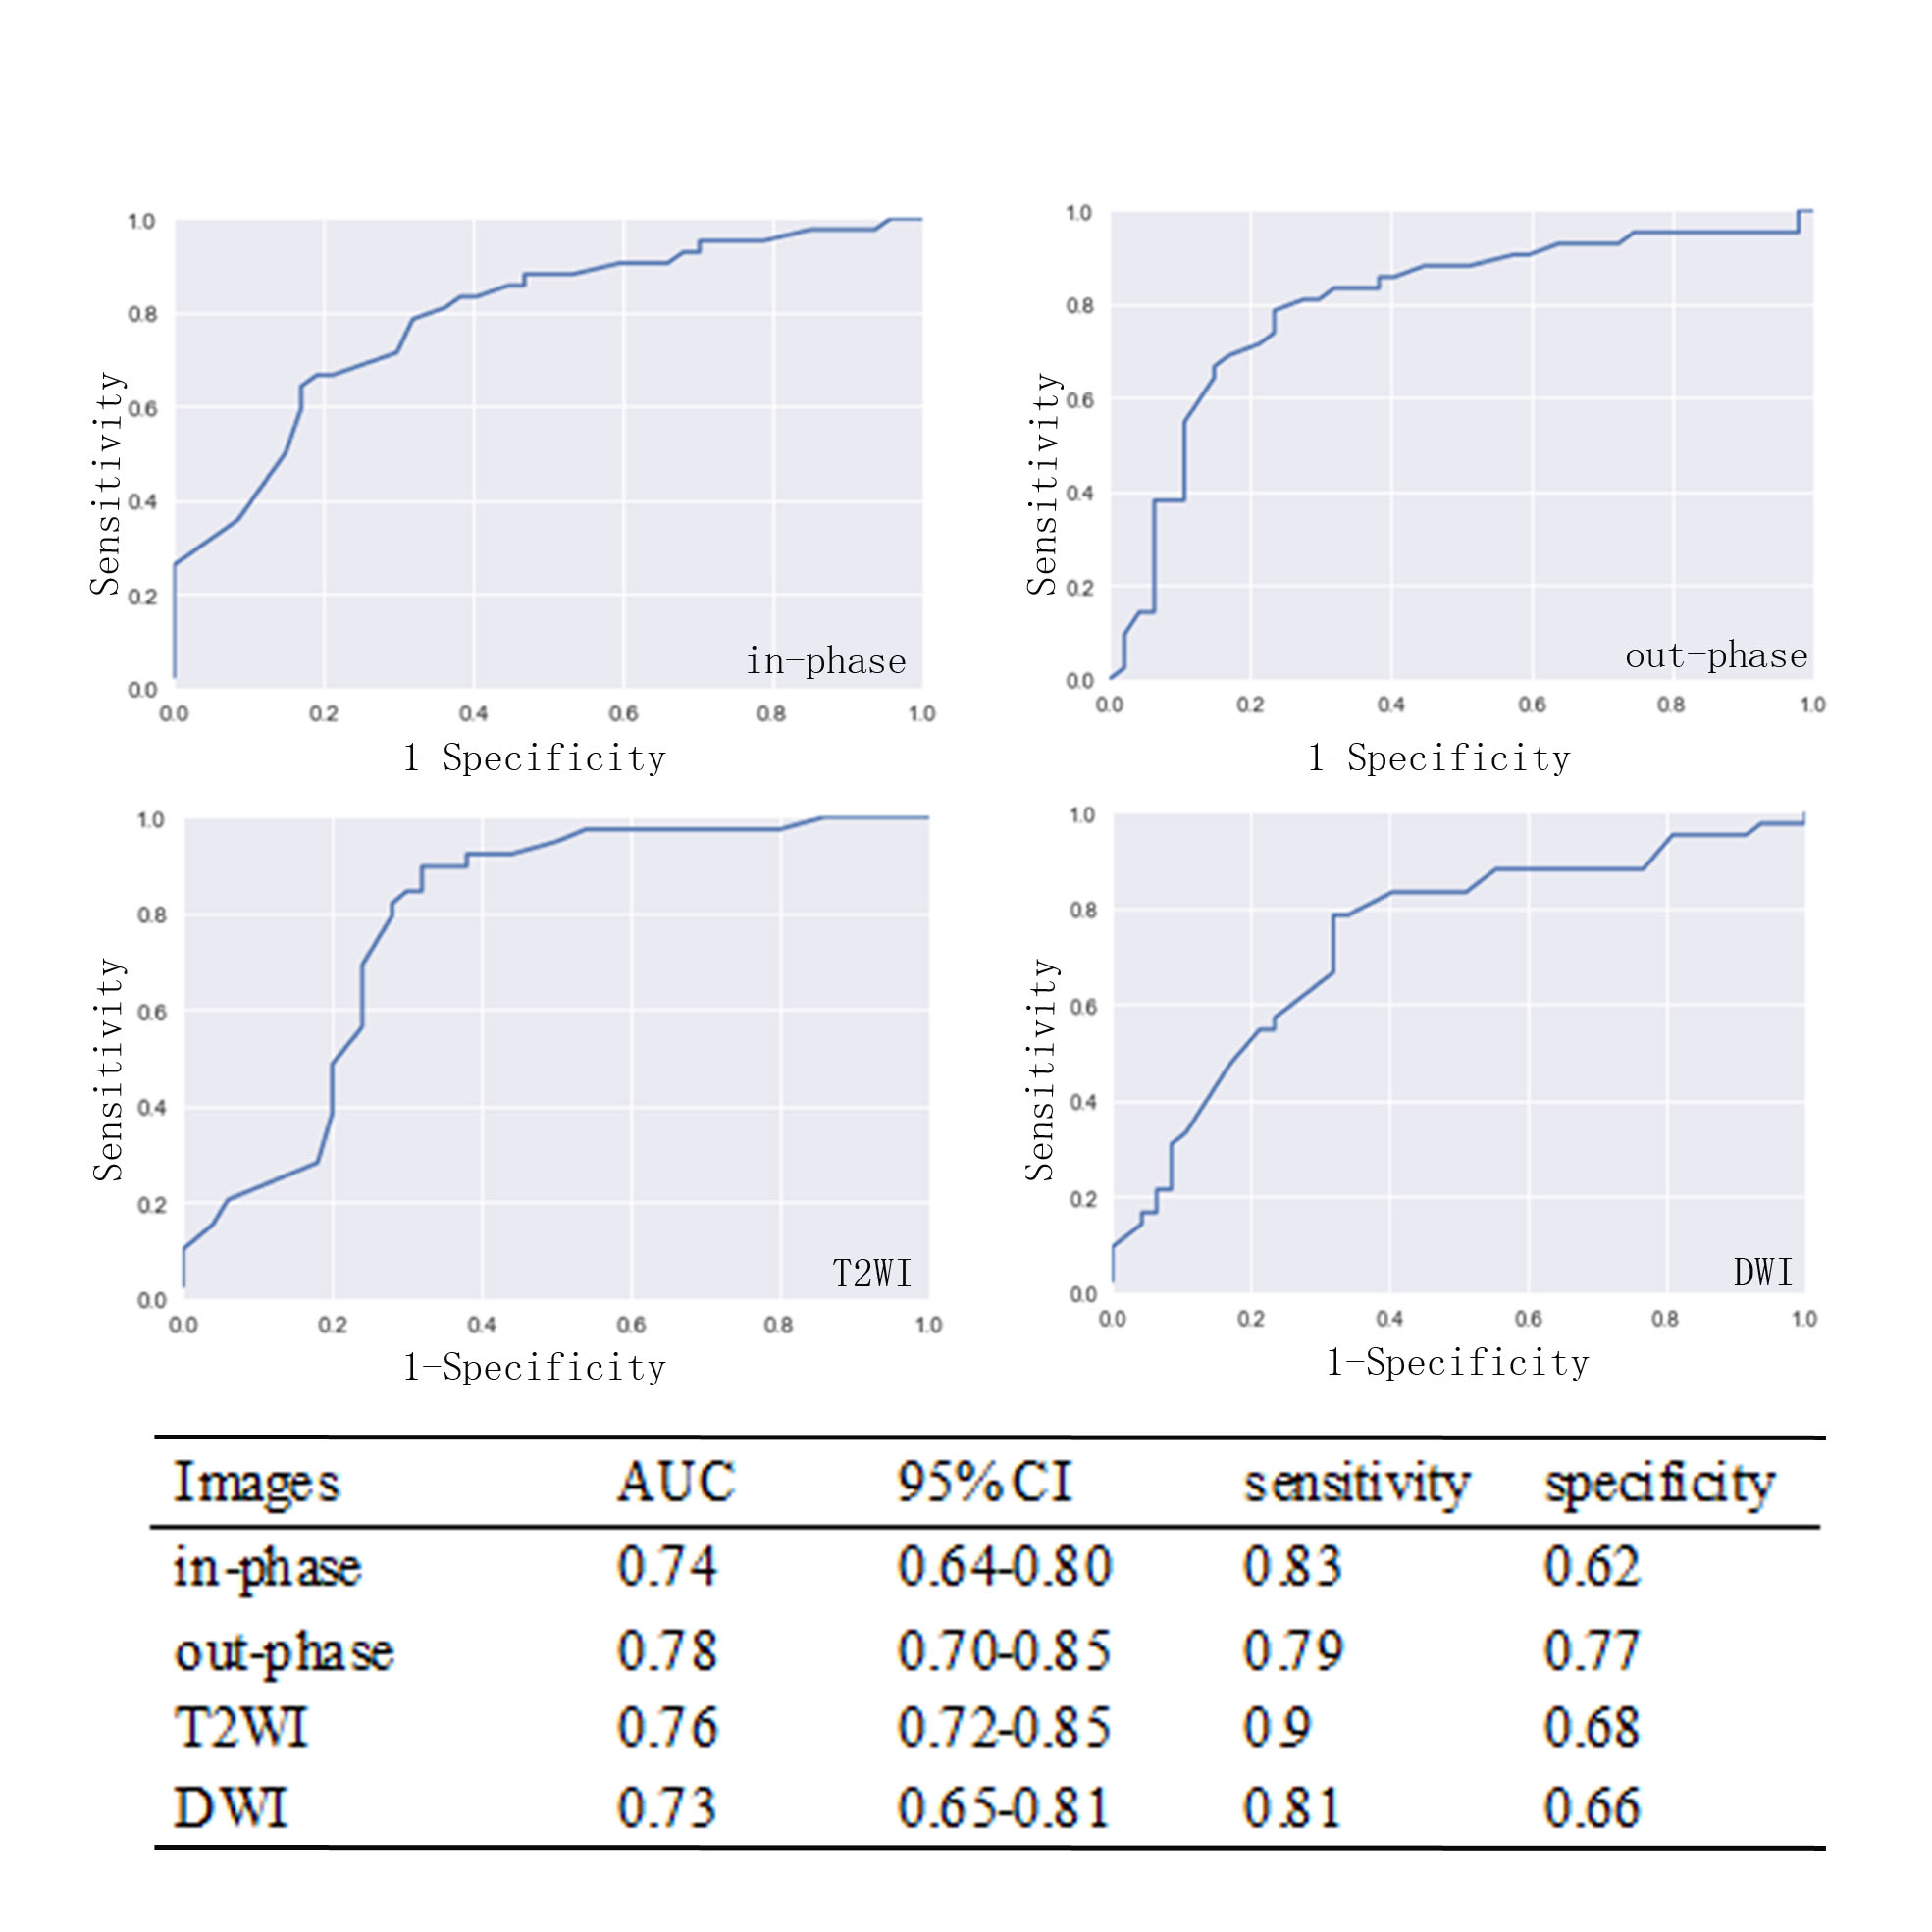
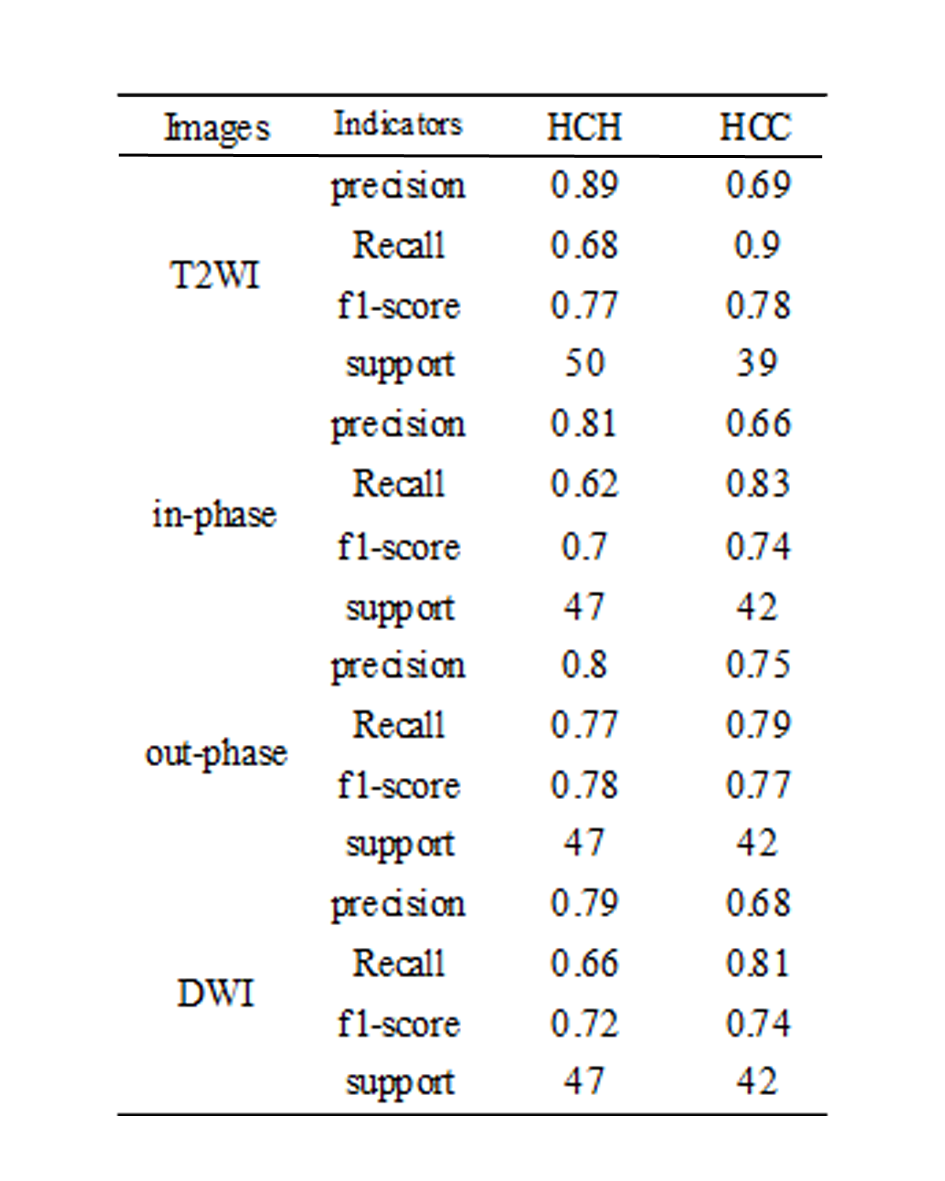
Based on out-phase images, random forest classifier showed the best performance in identifying HCC and HCH. On out-phase images, the optimal value of the lasso tuning parameter (alpha) and 24 features which were correspond to the optimal alpha were extracted following coefficients in lasso model (Fig.3). Then, random forest classifier was used to identify HCC and HCH. For HCH, the value of precision, recall, f1-score, support were 0.8, 0.77, 0.78, 47, and for HCC, the corresponding values were 0.75, 0.79, 0.77, 42, respectively (Table 1). And there was a maximum AUC of 0.78 (95% CI: 0.70-0.85) with sensitivity of 0.79 and specificity of 0.77 obtained based on out-phase images (Fig.4).Discussion and Conclusion
In this work, a CAD system for the identification of HCC and HCH using non-enhanced MRI was proposed. Through the calculation of random forest classifier on dual-echo T1WI (in-phase, out-phase), T2WI and DWI images respectively, it was seen that out-phase images showed the best performance.Acknowledgements
No acknowledgment found.References
1. Omata M, Cheng AL, Kokudo N, et al. Asia-Pacific clinical practice guidelines on the management ofhepatocellular carcinoma: a 2017 update. Hepatology International. 2017;11(4):317.
2. Ghouri YA, Mian I, Rowe JH. Review of hepatocellular carcinoma: Epidemiology, etiology, and carcinogenesis. Journal of Carcinogenesis. 2017;16(1):1.
3. Gillies RJ, Kinahan PE, Hricak H. Radiomics: Images Are More than Pictures, They Are Data. Radiology. 2016;278(2):563.
Figures