2709
Analysis of diffusion effects in SSFP sequences with extended phase graphs1Shenzhen Institutes of Advanced Technology, Chinese Academy of Sciences, Shenzhen, China, 2University of Chinese academy of Sciences, Beijing, China
Synopsis
EPG simulation was applied to analysis the diffusion effect of two SSFP-FID signals, FISP and ES. The influence of T1, T2, and unbalanced gradient on signal intensity with consideration of diffusion effect was studied. The EPG simulation have a good consistency with the experimental data, indicating it can efficiently and precisely calculate the diffusion effect of SSFP signals. Both the simulation and phantom study reveals that for some specific tissues and imaging parameters, positive diffusion contrast can be obtained in FISP and ES sequence. For quantitative method based on SSFP signals, such as TESS relaxometry, the diffusion effect should be considered while large unbalanced gradients and small flip angle were employed for high resolution imaging in high field system.
Introduction
Through delicately designed gradients, steady-state free precession (SSFP) sequence allows for acquisition of various types of signal in very short TR. The SSFP signal dependency on tissue relaxation times, flip angle has been well studied, and some rapid relaxometry method have been proposed based on triple echo SSFP sequences1. However, the diffusion effect is neglected. In the case of high resolution imaging, where the unbalanced gradients are large, the neglect of diffusion may result in large quantification error2. The extended phase graph (EPG) providing an elegant description of magnetization response in MR sequences, enables a greatly simplified calculation and analysis of diffusion effect3. Considering the exact k-value evolution, the signal change due to diffusion effect can be expressed by a state evolution operator. The purpose of this work is to analyze the diffusion effect on two lowest order SSFP-FID signals, FISP and ES, through EPG. The accuracy was verified through phantom experiments.Materials and Methods
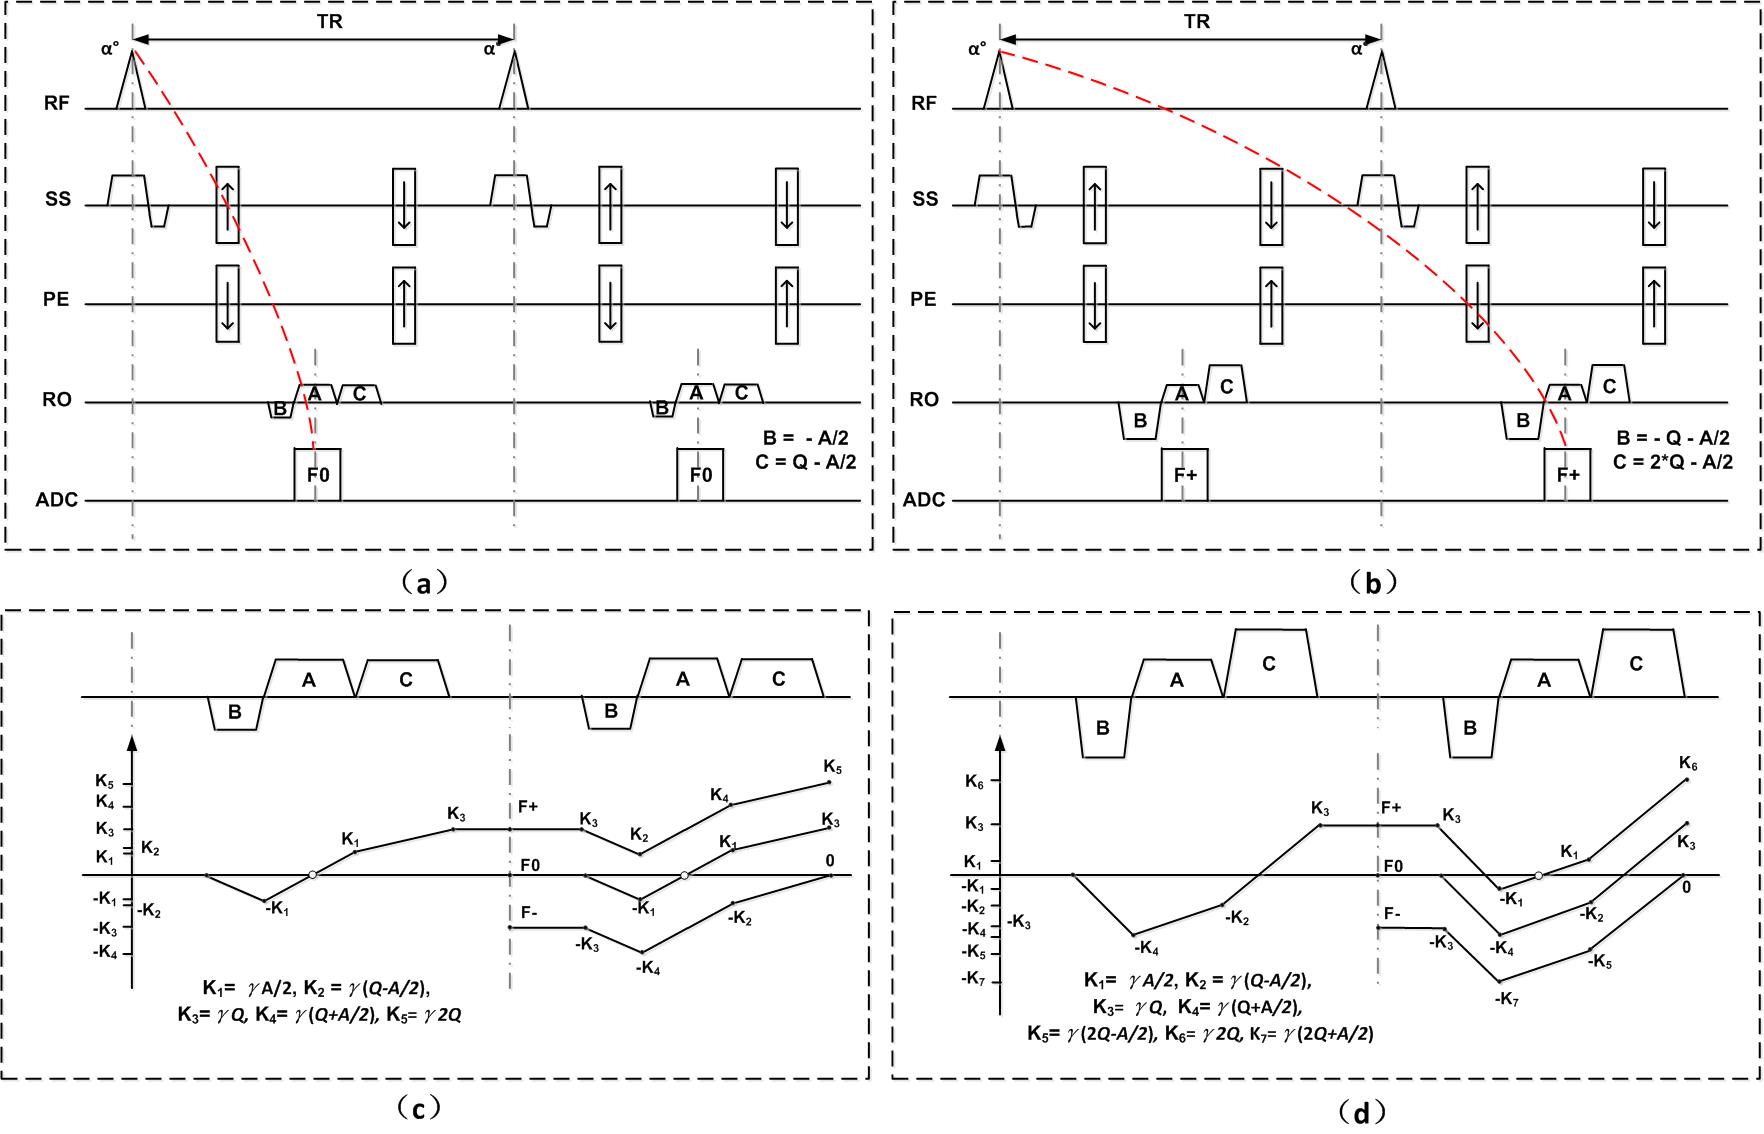
EPG simulation3: Figure 1 illustrate the signal formation of FISP and ES sequence.
In EPG, magnetization is interpreted as “configuration states”. The whole configuration states evolution process can be interpreted by successive matrix product. Without consideration of diffusion, it is enough to include only the net effect of unbalanced gradients. But with consideration of diffusion, the exact diffusion effect caused by all the gradients should be included, especially for ES which incorporates large rephrasing and dephasing gradients. The b-factor for longitudinal ( $$$b_τ^L$$$ ) and transversal ( $$$b_τ^T$$$ ) magnetization can be calculated by:$$k(t)=∫_0^tγG(t)dt$$ $$b_τ^L=(k^\left(1\right))^2 τ$$ $$b_τ^T=(k^\left(1\right)+k^\left(2\right))^2 τ/4+(k^\left(1\right)-k^\left(2\right))^2 τ/12$$,
Where $$$k^\left(1\right)$$$ and $$$k^\left(2\right)$$$ means the exact k value before and after each gradient, $$$\tau$$$ is the gradient duration. The exact $$$k^\left(1\right)$$$ and $$$k^\left(2\right)$$$ values of each gradient for three representative configuration states were shown in the Fig 1(c-d) for FISP and ES sequence.
In our simulation, only isotropic diffusion was considered. The effect of slice selection and phase encoding gradient were neglected.
Simulation:To illustrate the diffusion effect on FISP and ES, a simulation was performed with varying T1(200-2000ms) and T2(10-200ms), FA=10º, TR/TE=12/6ms, Q=46.97mT/m*ms, A=23.49mT/m*ms. Considering diffusion effect, D=1.9*10-9m2/s. The F0 and F+ signals with diffusion effect were calculated using EPG algorithm described above.
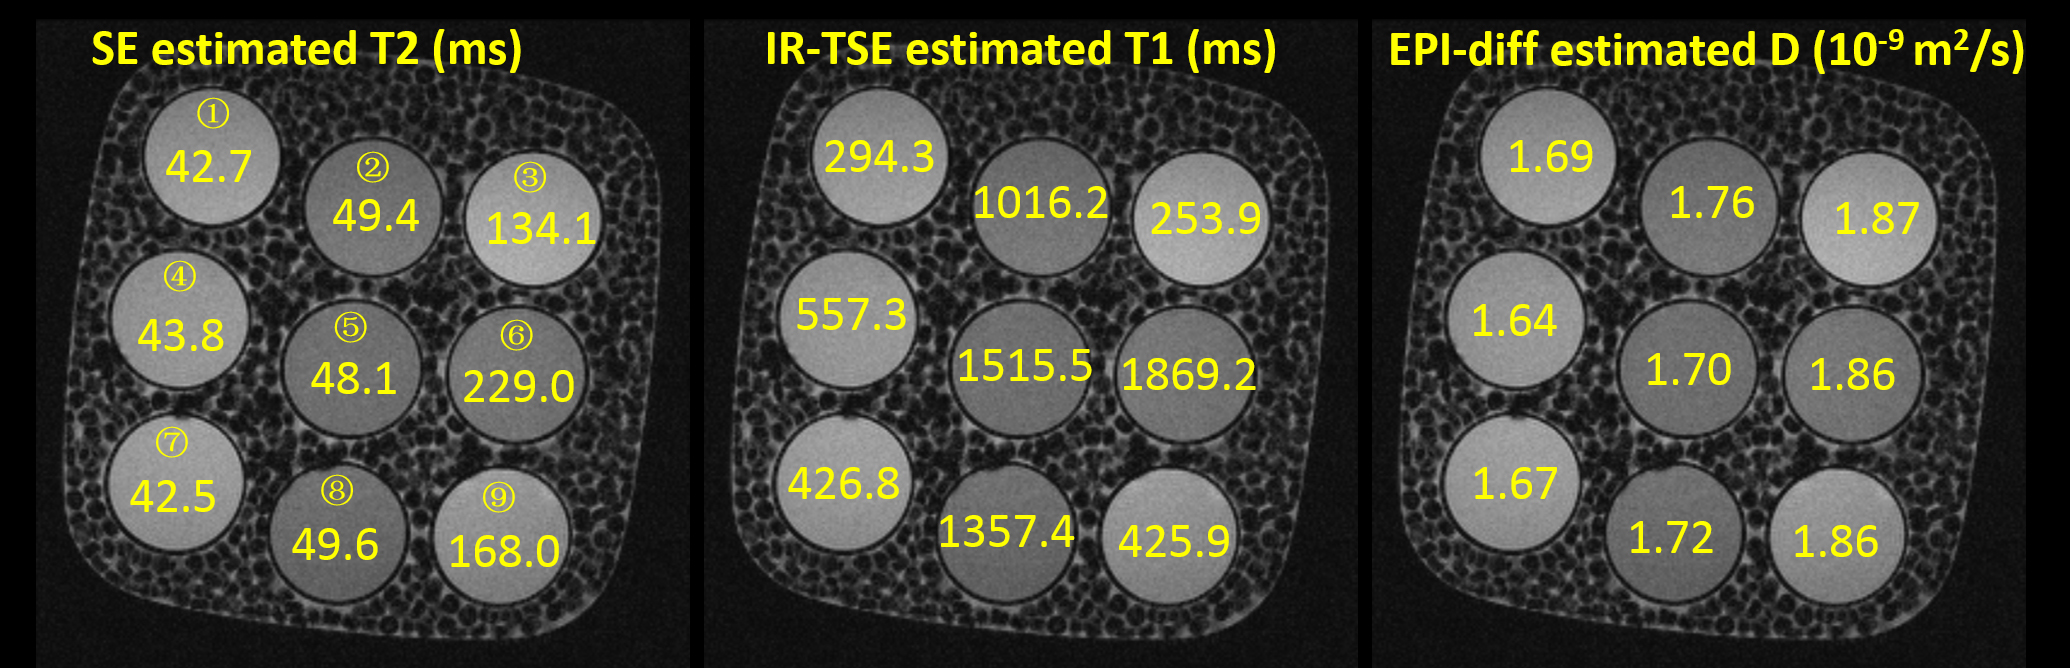
Phantom experiment: All the experiments were conducted on a 3T MRI scanner (TIM TRIO, Erlangen, Germany). A 9 tube phantom(Resonance Health Analysis Services Pty Ltd, Australia) with different combination of T1/T2/D (Figure 2) was scanned with Q varied in the range of 23.49 to 51.67mT/m*ms. FA=10º, TR/TE=13/6.5ms, A=23.49 mT/m*ms.
Results
Signal change of FISP and ES signals with and without consideration of diffusion effect for various combination of relaxation times was simulated(figure 3). It is a little surprising that both FISP and ES may show increased signal with consideration of diffusion. For FISP, when T1< 800ms, signal intensity increased with considering diffusion effect. For ES, smaller T2 (less than about 50ms) or smaller T1 (less than about 300ms) corresponded to signal increase induced by diffusion effect.
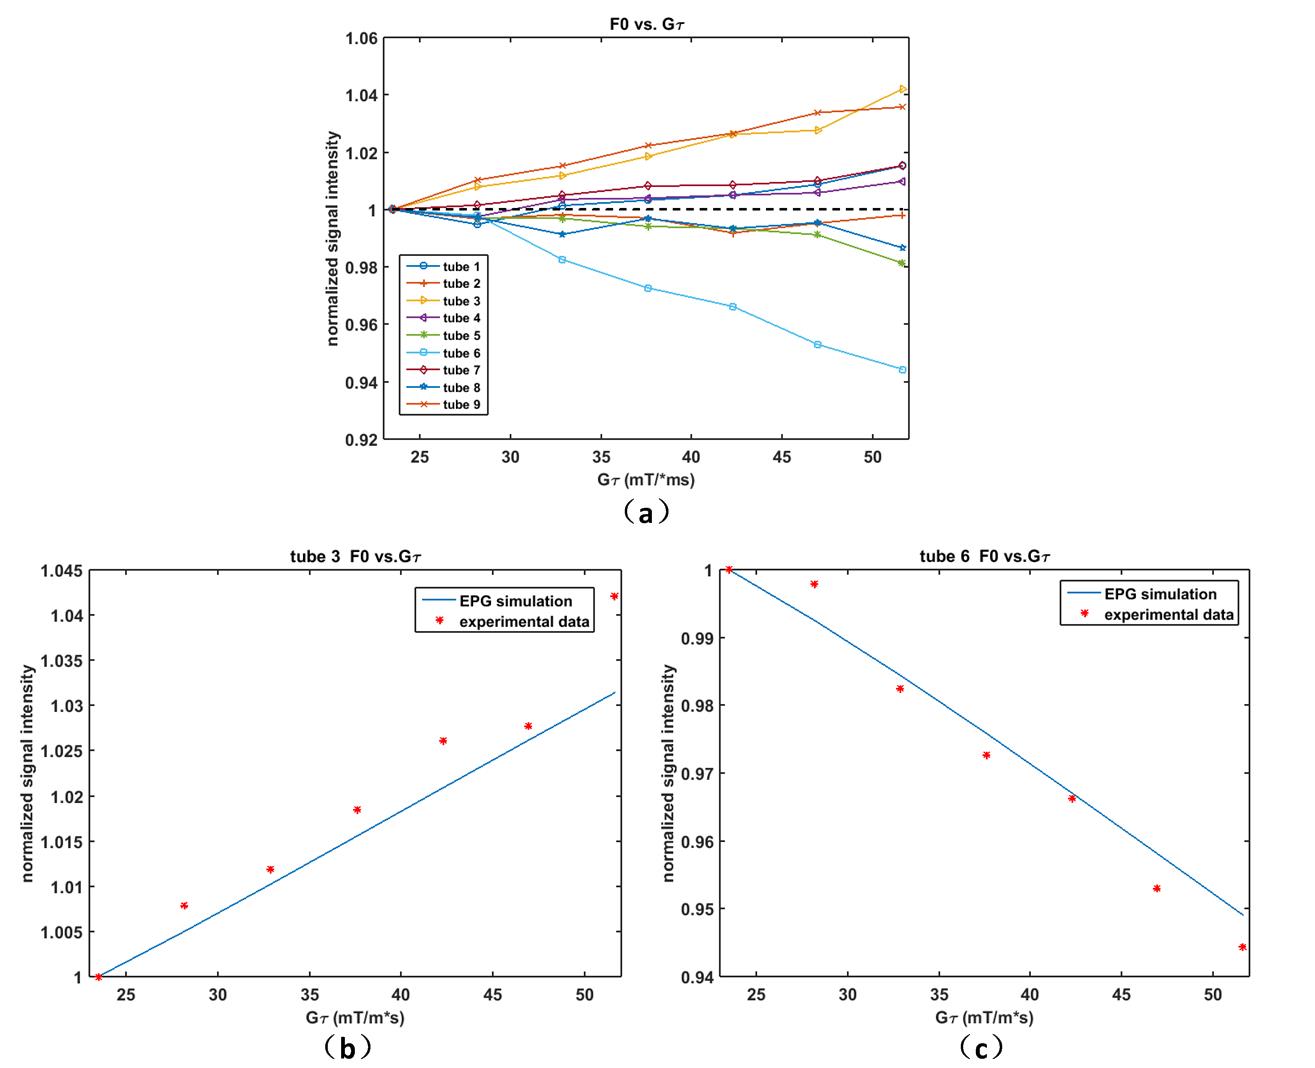
Figure 4(a) illustrated the experimental measurements of FISP signals as a function of Q. In accordance with simulation results, the FISP signals showed two types of trend, which is determined by their T1 value. FISP signal of tube 6 was attenuated by about 6% with largest Q=51.67mT/m*ms, while signal of tube 3 and 9 increased by about 4%. Figure 4(b-c) compared the EPG simulation and experiment data of tube 3 and tube 6 as example.
Figure 5(a) illustrated the experimental measurements of ES signals as a function of Q. Tube 6 has the largest T1 and T2. Its signal decreased almost 10% with increasing Q. All the other signals increased with Q, which agrees with the simulation results. Signal of Tube 5 (small T2 and large T1), increased the most, for around 5%. Figure 5(b-c) gave the EPG simulation of tube 5 and 6.
Discussion and Conclusion
In this work, EPG simulation was used to study the diffusion effect on two lowest order SSFP-FID signals, FISP and ES. The influence of T1, T2, and unbalanced gradient on signal intensities were studied. The accuracy of simulation has been verified by phantom study. The experimental data have a good consistency with simulation results, indicating the EPG simulation can efficiently calculate and analyze the diffusion effect on SSFP signals. Both the simulation and phantom studies reveal that positive diffusion contrast can be possibly obtained in FISP and ES sequences, which means the signal intensity may increase with larger apparent diffusion coefficient. The reason may due to the destructive interference between the wanted component and a series of stimulated echoes4. For quantitative method based on SSFP signals, such as TESS relaxometry, the diffusion effect should be considered while large unbalanced gradients and small flip angle were employed.Acknowledgements
This research was supported by the National Natural Science Foundation of China No. 81327801, 61302040,11504401, 81527901, 81301242, U1301258, National Key R&D Program No. 2016YFC0100100, Shenzhen Scienceand Technology Research Program No. JCYJ20150630114942317 and JCYJ20150521094519487References
1. Heule R, Ganter C, Bieri O. Triple echo steady-state (TESS) relaxometry. Magnet Reson Med. 2014;71:230-7.
2. Qiao Y, Zou C, Liu X, et al. Diffusion effects on T2 relaxometry with triple echo steady-state free precession seuqnce. The ISMRM 25th Annual Meeting & Exhibition. 2017; Honolulu, USA.
3. Weigel M, Schwenk S, Kiselev VG, et al. Extended phase graphs with anisotropic diffusion. J Magn Reson. 2010;205:276-85.
4. Denolin V, Metens T. On the calculation and interpretation of signal intensity in echo-shifted sequences. Magnet Reson Med. 2004;51:123-34.
Figures