2706
GPU-optimized fast 3D MRI simulator for arbitrary trajectory sampling1MRTechnology, Inc., Tsukuba, Japan, 2University of Tsukuba, Tsukuba, Japan
Synopsis
We developed a GPU-optimized fast 3D MRI simulator for arbitrary trajectory sampling. The performance of the simulator was evaluated using stack of 2D spiral and 3D Cones sequences. The result demonstrated that our simulator is a powerful tool for studies of non-Cartesian sampling as well as Cartesian sampling imaging sequences.
Introduction
Up to now, a variety of MRI simulators that reproduce MRI process using computers have been reported [1-5]. However, as far as we know, their applications were limited to Cartesian sampling sequences. This limitation is probably due to the difficulty in developing a high-speed program for pulse sequences with arbitrary readout gradients. In this study, we developed a fast 3D MRI simulator for arbitrary trajectory sampling using a Graphic Processor Unit (GPU) and evaluated its performance using several non-Cartesian sampling sequences.Materials and Methods
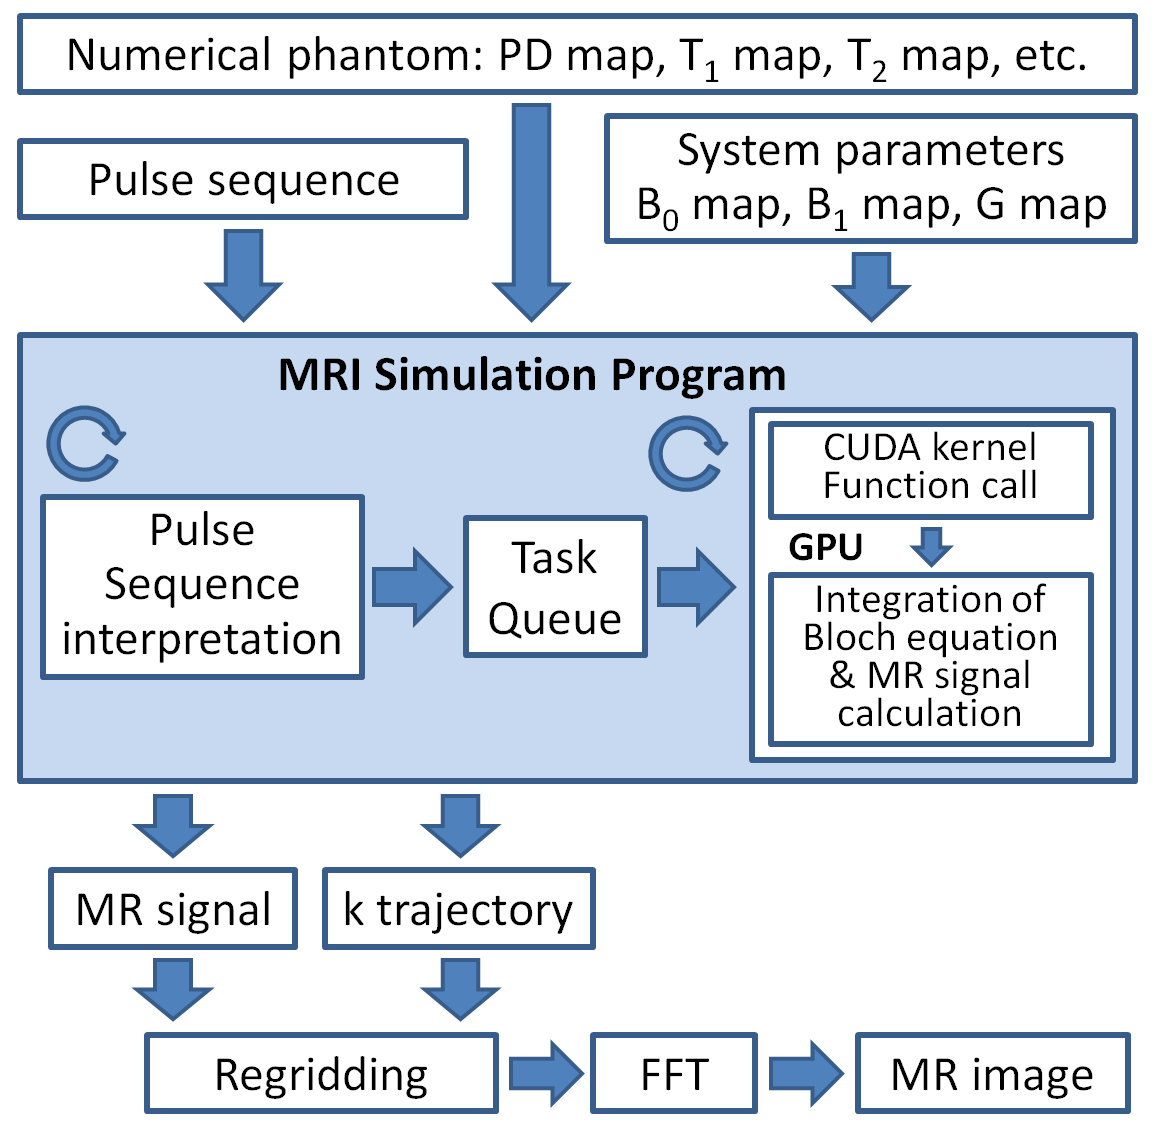
Figure 1 shows a block diagram of the MRI simulator developed in this study. First, the pulse sequence file, numerical phantom files, and system parameter files are input to the MRI simulator. Then, one thread of the simulator program repeatedly interprets the pulse sequence line by line and outputs the MRI events to the task queue. Another thread picks up the MRI events from the task queue and calls CUDA kernel functions to execute integration of the Bloch equation and calculation of the MRI signal using a GPU (NVIDIA GTX 1070). The MRI signal and the k-trajectory are output from the simulator, which are used for image reconstruction using 2D or 3D FFT after gridded into a Cartesian coordinate in the k-space. The simulator was developed on Ubuntu 16.04 using C++, Python 3, PyQt5, and CUDA 8.
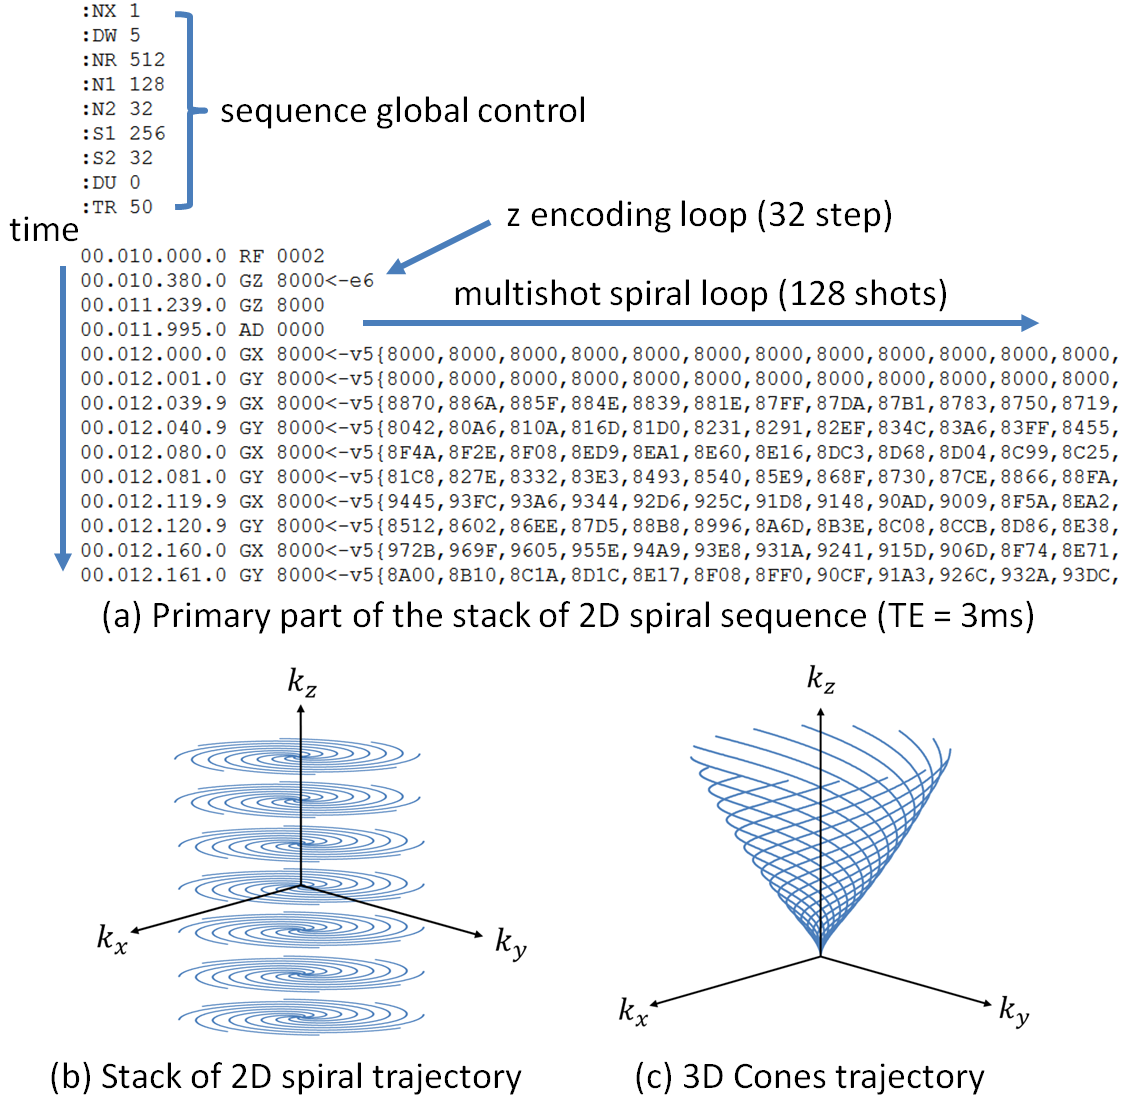
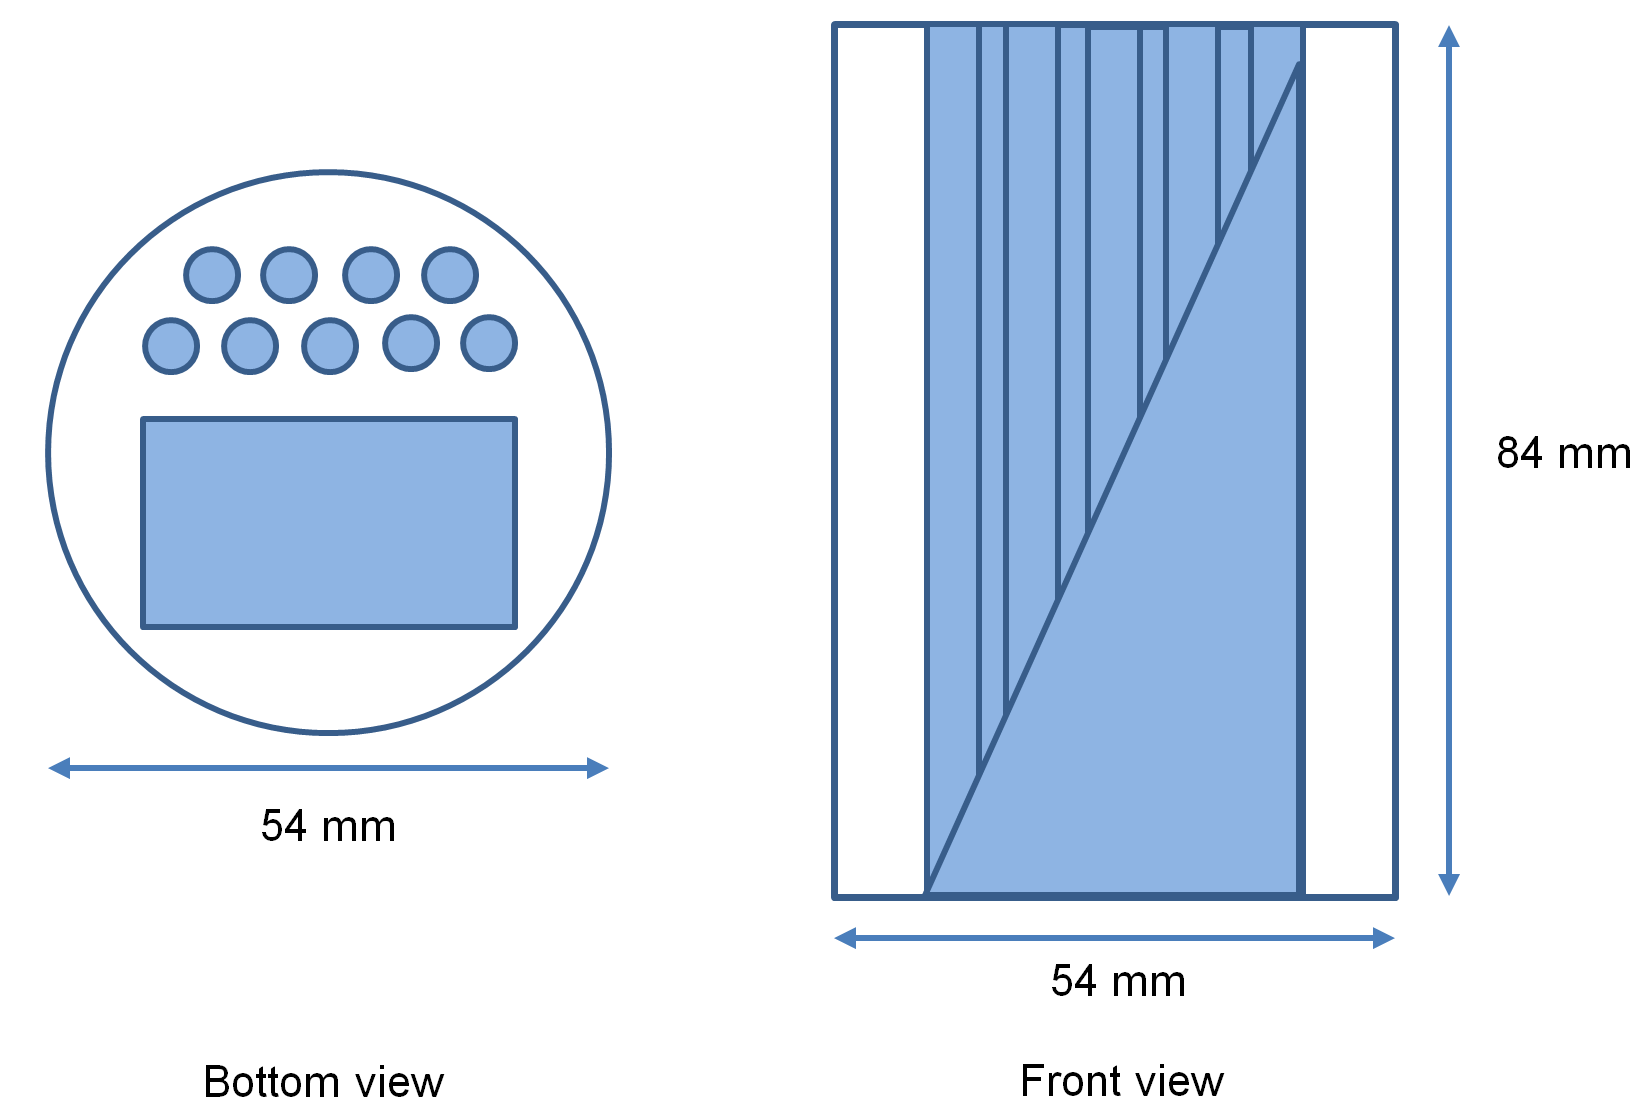
Figure 2(a) shows a primary part of the pulse sequence of the stack of 2D spirals (256×256×32 voxels) as shown in Fig.2(b). The pulse sequence consists of two parts, the sequence global control and the sequence event timings. The pulse sequence file has two loops: the inner loop represented by –v5 corresponding to the 128 shot spirals and the outer loop represented by –e6 corresponding to 32 linear phase encoding. Figure 2(c) shows a part of the k-trajectory of the 3D Cones sequence. The stack of 2D spirals and 3D Cones trajectories were designed after Glover [6] using the following parameters: FOV = 64 ´ 64 ´ 128 mm and efficiencies of Gx, Gy and Gz = 0.448, 0.473, and 0.495 G/cm/A, respectively. Figure 3 shows a numerical phantom used for the MRI simulation.
Results and Discussion
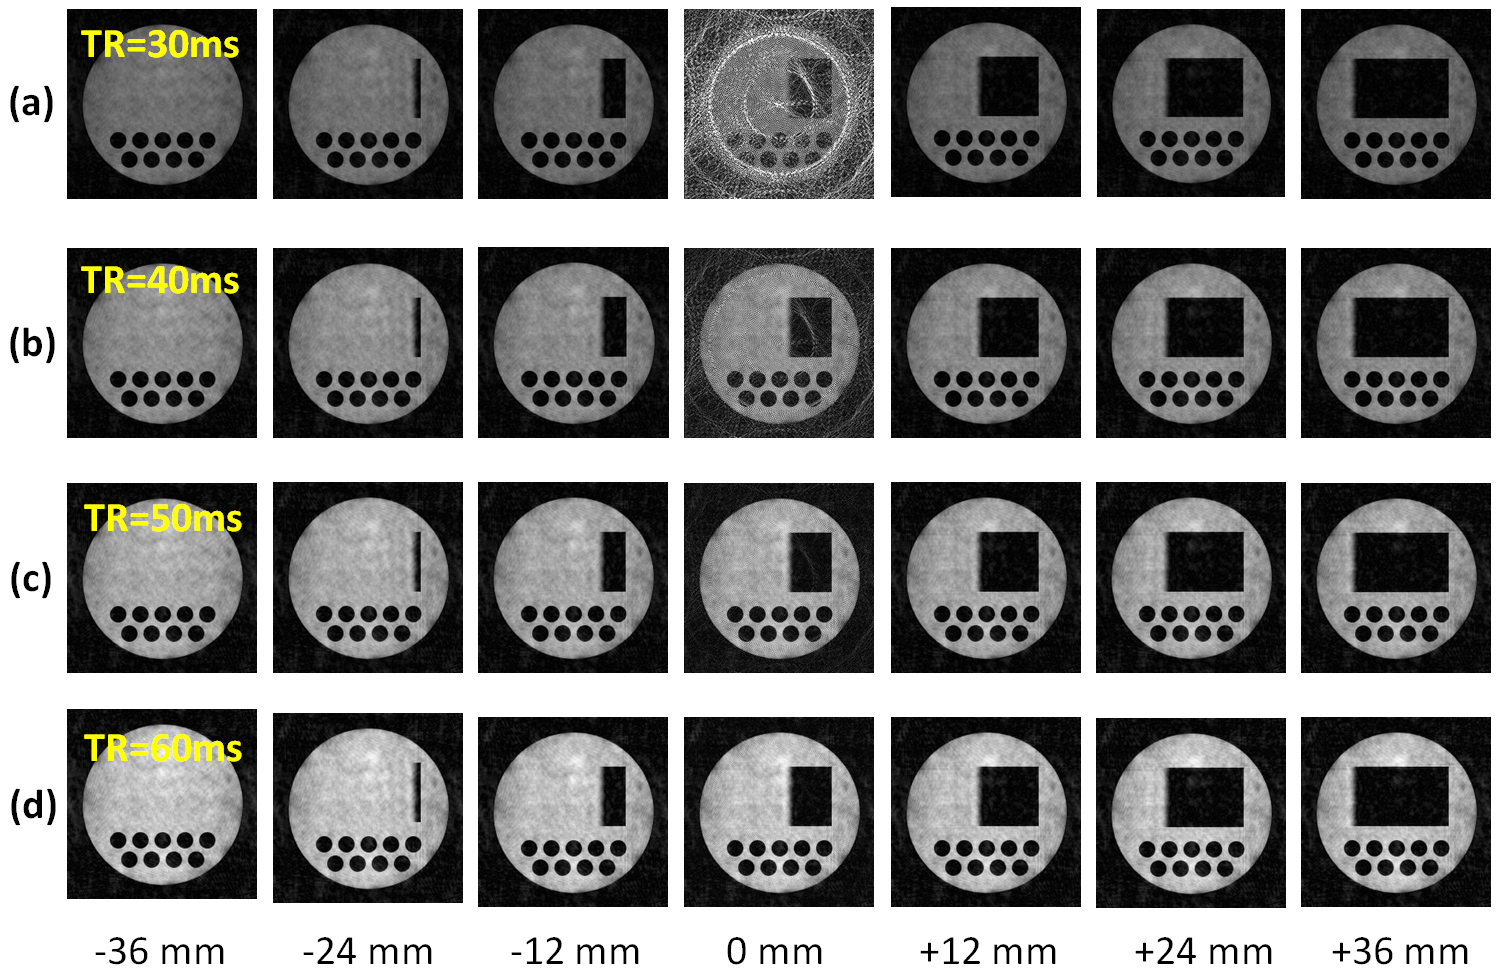
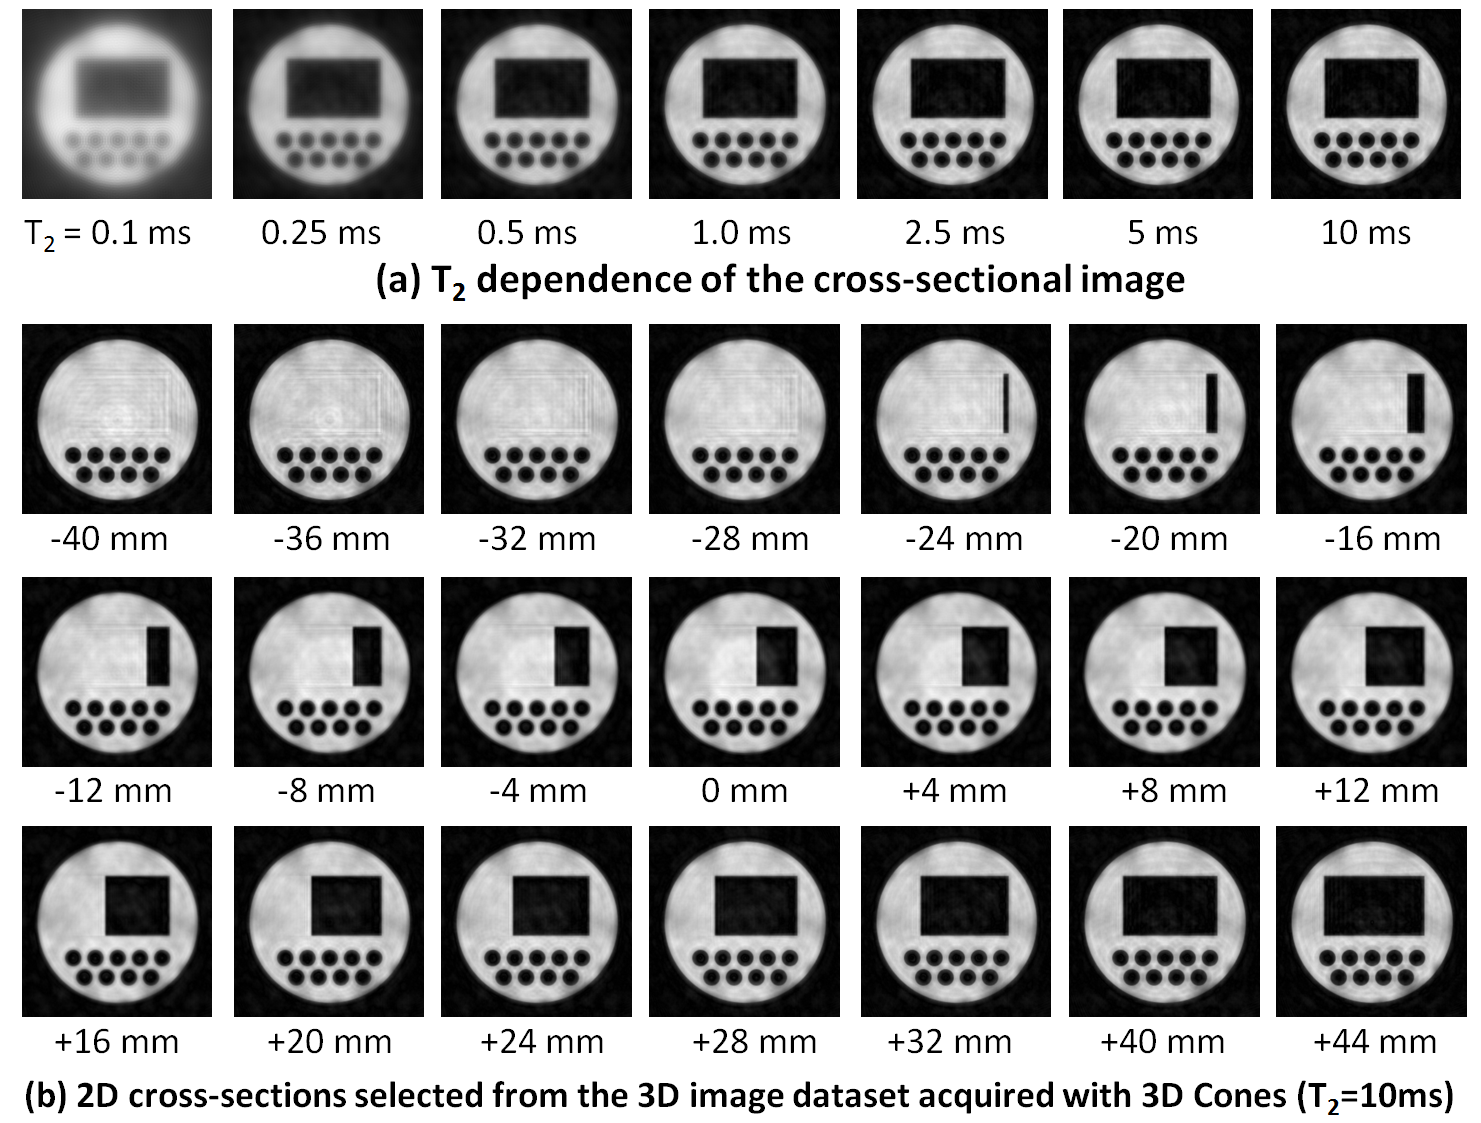
Figures 4(a)-(d) show cross-sectional images selected from 3D image datasets of the numerical phantom acquired with the stack of 2D spiral sequence when TR = 30, 40, 50, and 60 ms. The other simulation conditions are as follows: image matrix = 256 × 256 × 32, FOV = 64 × 64 × 128 mm, number of shot = 128, flip angle of the RF pulse = 90°, T1 = 100 ms, TE = 20 ms, and number of subvoxels = 1 × 1 × 1. The computation time was 130.0 s. Severe artifacts were observed in the central slice (z = 0) when TR was shorter than 50 ms. We think that the artifacts were caused by residual transverse nuclear magnetization exited by the previous RF pulses. Figure 5(a) shows a variation of a cross-section selected from 3D image datasets of the 3D numerical phantom acquired with the 3D Cones sequence when T2 of the phantom was changed from 0.1 to 10 ms. The other simulation conditions are as follows: image matrix = 256 × 256 × 512, FOV = 64 × 64 × 128 mm, number of cones = 256, number of shots = 128, data acquisition window = 2.24 ms, T1 of the phantom = 100 ms, TR = 100 ms, TE = 1 ms, and number of subvoxels = 1 × 1 × 1. The computation time for one 3D Cones image was 1054.5 s. Image blurring caused by T2 shortening in the 3D Cones sequences was clearly confirmed. Figure 5(b) shows 2D cross-sections selected from the 3D image dataset of the numerical phantom acquired with the 3D Cones sequence (T2 = 10 ms). Several kinds of artifacts were observed and image blurring seemed to be inhomogeneous over the image. We think these image artifacts and blurring are caused by gridding error and/or imperfection of the k-trajectory. In conclusion, we have successfully developed a GPU-optimized MRI simulator for arbitrary trajectory sampling and demonstrated that our simulator had a sufficient performance for large matrix non-Cartesian sampling sequences. Our simulator will be especially useful for studies of non-Cartesian sampling applications.Acknowledgements
This work was supported by Japan Science and Technology Agency.References
[1] H. Benoit-Cattina, G. Collewet, B. Belaroussi, H. Saint-Jalmes, C. Odet, J. Magn. Reson. 173 (2005) 97–115. [2] T. Stöcker, K. Vahedipour, D. Pflugfelder, N. J. Shah, Magn. Reson. Med. 64 (2010) 186–193. [3] C. G. Xanthis, I. E. Venetis, A. V. Chalkias, A. H. Aletras, IEEE Trans. Med. Imaging 33 (2014) 607–616. [4] Liu F, Velikina JV, Block WF, Kijowski R, Samsonov AA, IEEE Trans Med Imaging. 36 (2017) 527-537. [5] Kose R, Kose K, J. Magn. Reson. 281 (2017) 51–65. [6] Glover G, Magn. Reson. Med. 42 (1999) 412–415.Figures