2698
Multi-compartment relaxation-compensated IVIM imaging of the human brain1Department of Medical Radiation Physics, Lund University, Lund, Sweden, 2Departments of Psychiatry and Radiology, Harvard Medical School, Boston, MA, United States, 3Department of Diagnostic Radiology, Lund University, Lund, Sweden, 4Lund University Bioimaging Center, Lund University, Lund, Sweden, 5The Russell H. Morgan Department of Radiology and Radiological Science, The Johns Hopkins University School of Medicine, Baltimore, MD, United States
Synopsis
In conventional intravoxel incoherent motion (IVIM) imaging, the blood fraction is estimated using a two-compartment model (blood and tissue). However, blood fraction estimation is hampered by cerebrospinal fluid (CSF) contamination and tissue-dependent relaxation times. We propose a three-compartment model (blood, tissue, CSF), which accounts for compartment-specific diffusion and relaxation properties. Estimation of gray and white matter blood fractions using this model is demonstrated with in-vivo human data of variable diffusion weightings, echo times and inversion times. In comparison with two-compartment models (with and without relaxation), the proposed three-compartment model yielded lower estimates of the blood fraction, suggesting a better separation from CSF.
Introduction
Intravoxel incoherent motion (IVIM) imaging is a method to separately extract both diffusion and perfusion properties of tissue1,2. IVIM studies in brain are complicated due to the low fraction of blood, and because the fast signal decay of blood can be biased by cerebrospinal fluid (CSF)3. The volume fraction estimates are also biased when not accounting for the fact that relaxation times differ between compartments and may vary across the brain. In this study, a three-compartment model, accounting for CSF and compartment-specific relaxation times, is proposed and compared with a two-compartment model (with and without relaxation compensation). Datasets with multiple b-values, echo times (TE) and inversion times (TI) were collected, allowing simultaneous estimation of diffusion, perfusion and relaxation times.Methods
A 3T whole-body MRI scanner (MAGNETOM Prisma, Siemens Healthcare, Erlangen, Germany) was used for multiple b-value, TI and TE data acquisition in five healthy subjects. The multiple b-data collection included 45 b-values between 15 and 800s/mm2. Imaging was accomplished with full brain coverage, TR=4000ms, TE=57ms, FOV 240×240mm2, matrix size 160×160, slice thickness 4mm, and 32 slices. Multi-TE data consisted of six different TEs (60, 70, 80, 90, 100, 120ms) and a TR of 6000ms. Multi-TI data were collected with an inversion magnetization preparation of θ=180° with 8 different TIs (50, 500, 1000, 1500, 2000, 2500, 3000, 4000ms), a TE of 67ms and a minimized TR (ranging between 4800 and 21880ms). The multi-TE and multi-TI data were acquired with two b-value shells of 100 and 300s/mm2. All data were collected using the same prototype spin-echo diffusion EPI sequence. A high-resolution T1-weighted image was acquired for ROI extraction using FreeSurfer. Our proposed relaxation-compensated three-compartment model (3-comp(relax)) was defined as:
$$S(b,\text {TI},\text {TE},\text {TR})= S_{000}\sum_{i=\left \{ t,c,b \right \}}f_{i}\cdot\rho _{i}\cdot \left [ 1-\left ( 1-cos\theta \right )e^{-\text {TI/T1}_{\it i}}+\left ( 1-2e^{\text {TE/2T1}_{\it i}} \right )cos\theta e^{-\text {TR/T1}_{\it i}} \right ]e^{-\text { TE/T2}_{\it i}}e^{-bD_{i}}$$
where S000 is the non-weighted signal (b=0,TE=0,TR=∞), $$$f_i$$$ are the fractional volumes, with i denoting the respective compartment, i.e., i=[tissue(t),CSF(c),blood(b)], ρi are the water contents, Di are the apparent diffusion coefficients (the pseudo diffusion D* for the blood compartment). We compared the 3-comp(relax) model with two versions of two-compartment models: The first was a relaxation-compensated two-compartment model (2-comp(relax)), defined using Eq.1 with the CSF fraction set to zero ($$$f_c$$$=0). The second model was the conventional two-compartment IVIM model2 (2-comp):
$$S(b)=\it S_{0}\sum_{i=\left \{ t,b \right \}}f_{i}\cdot\rho _{i}\cdot e^{-bD_{i}}$$
The relaxation-compensated models were jointly fitted using Bayesian inference with Gaussian priors4. The model in Eq.2 was only fitted to the multi-b data.
Results
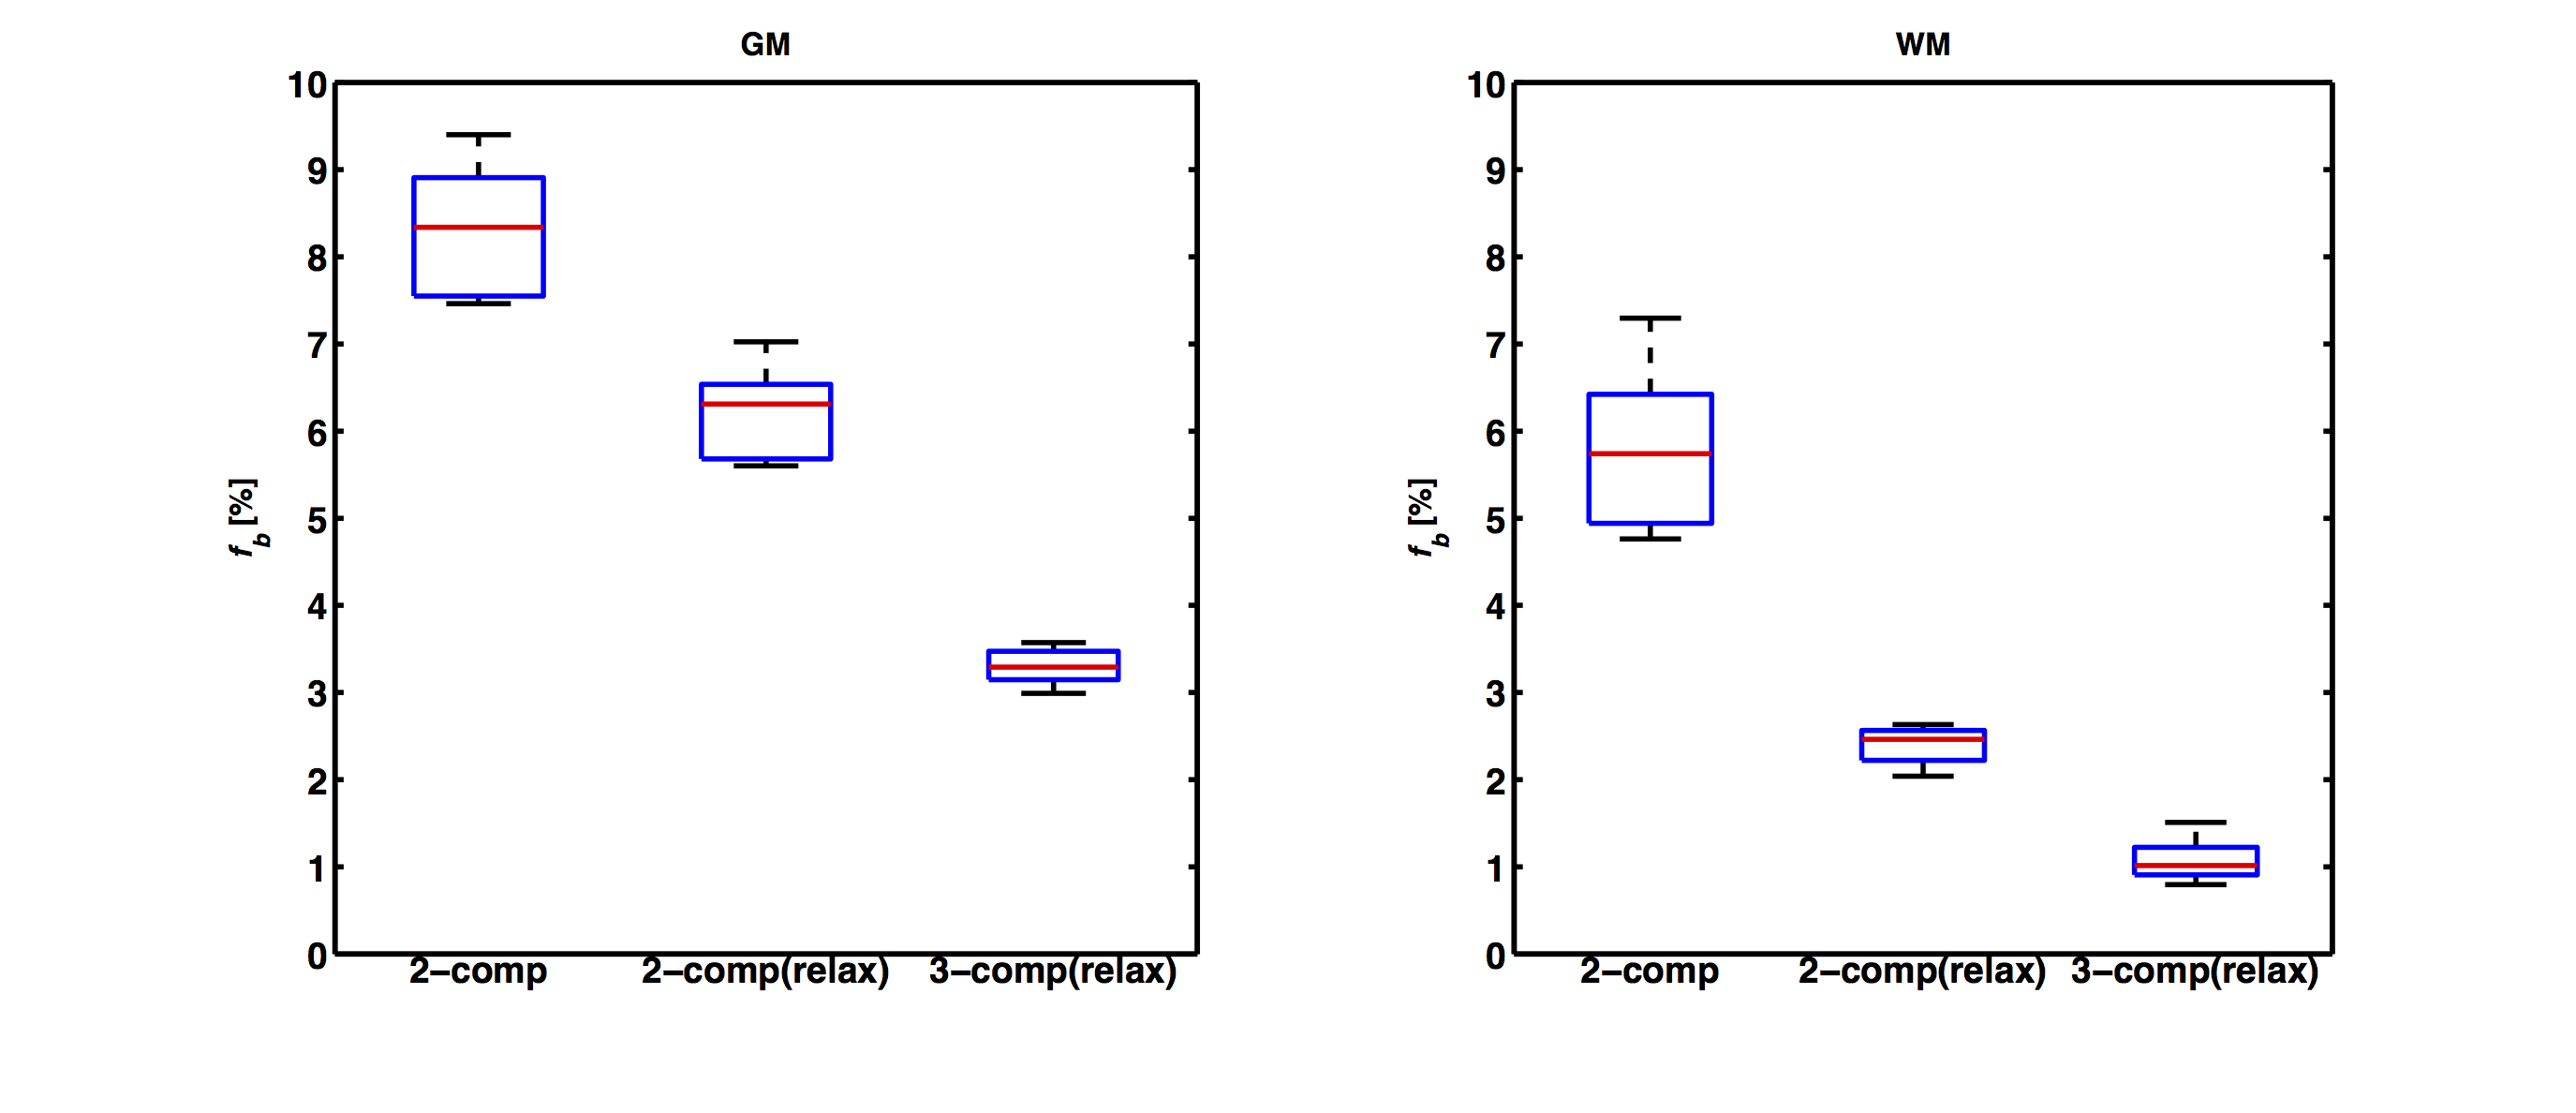
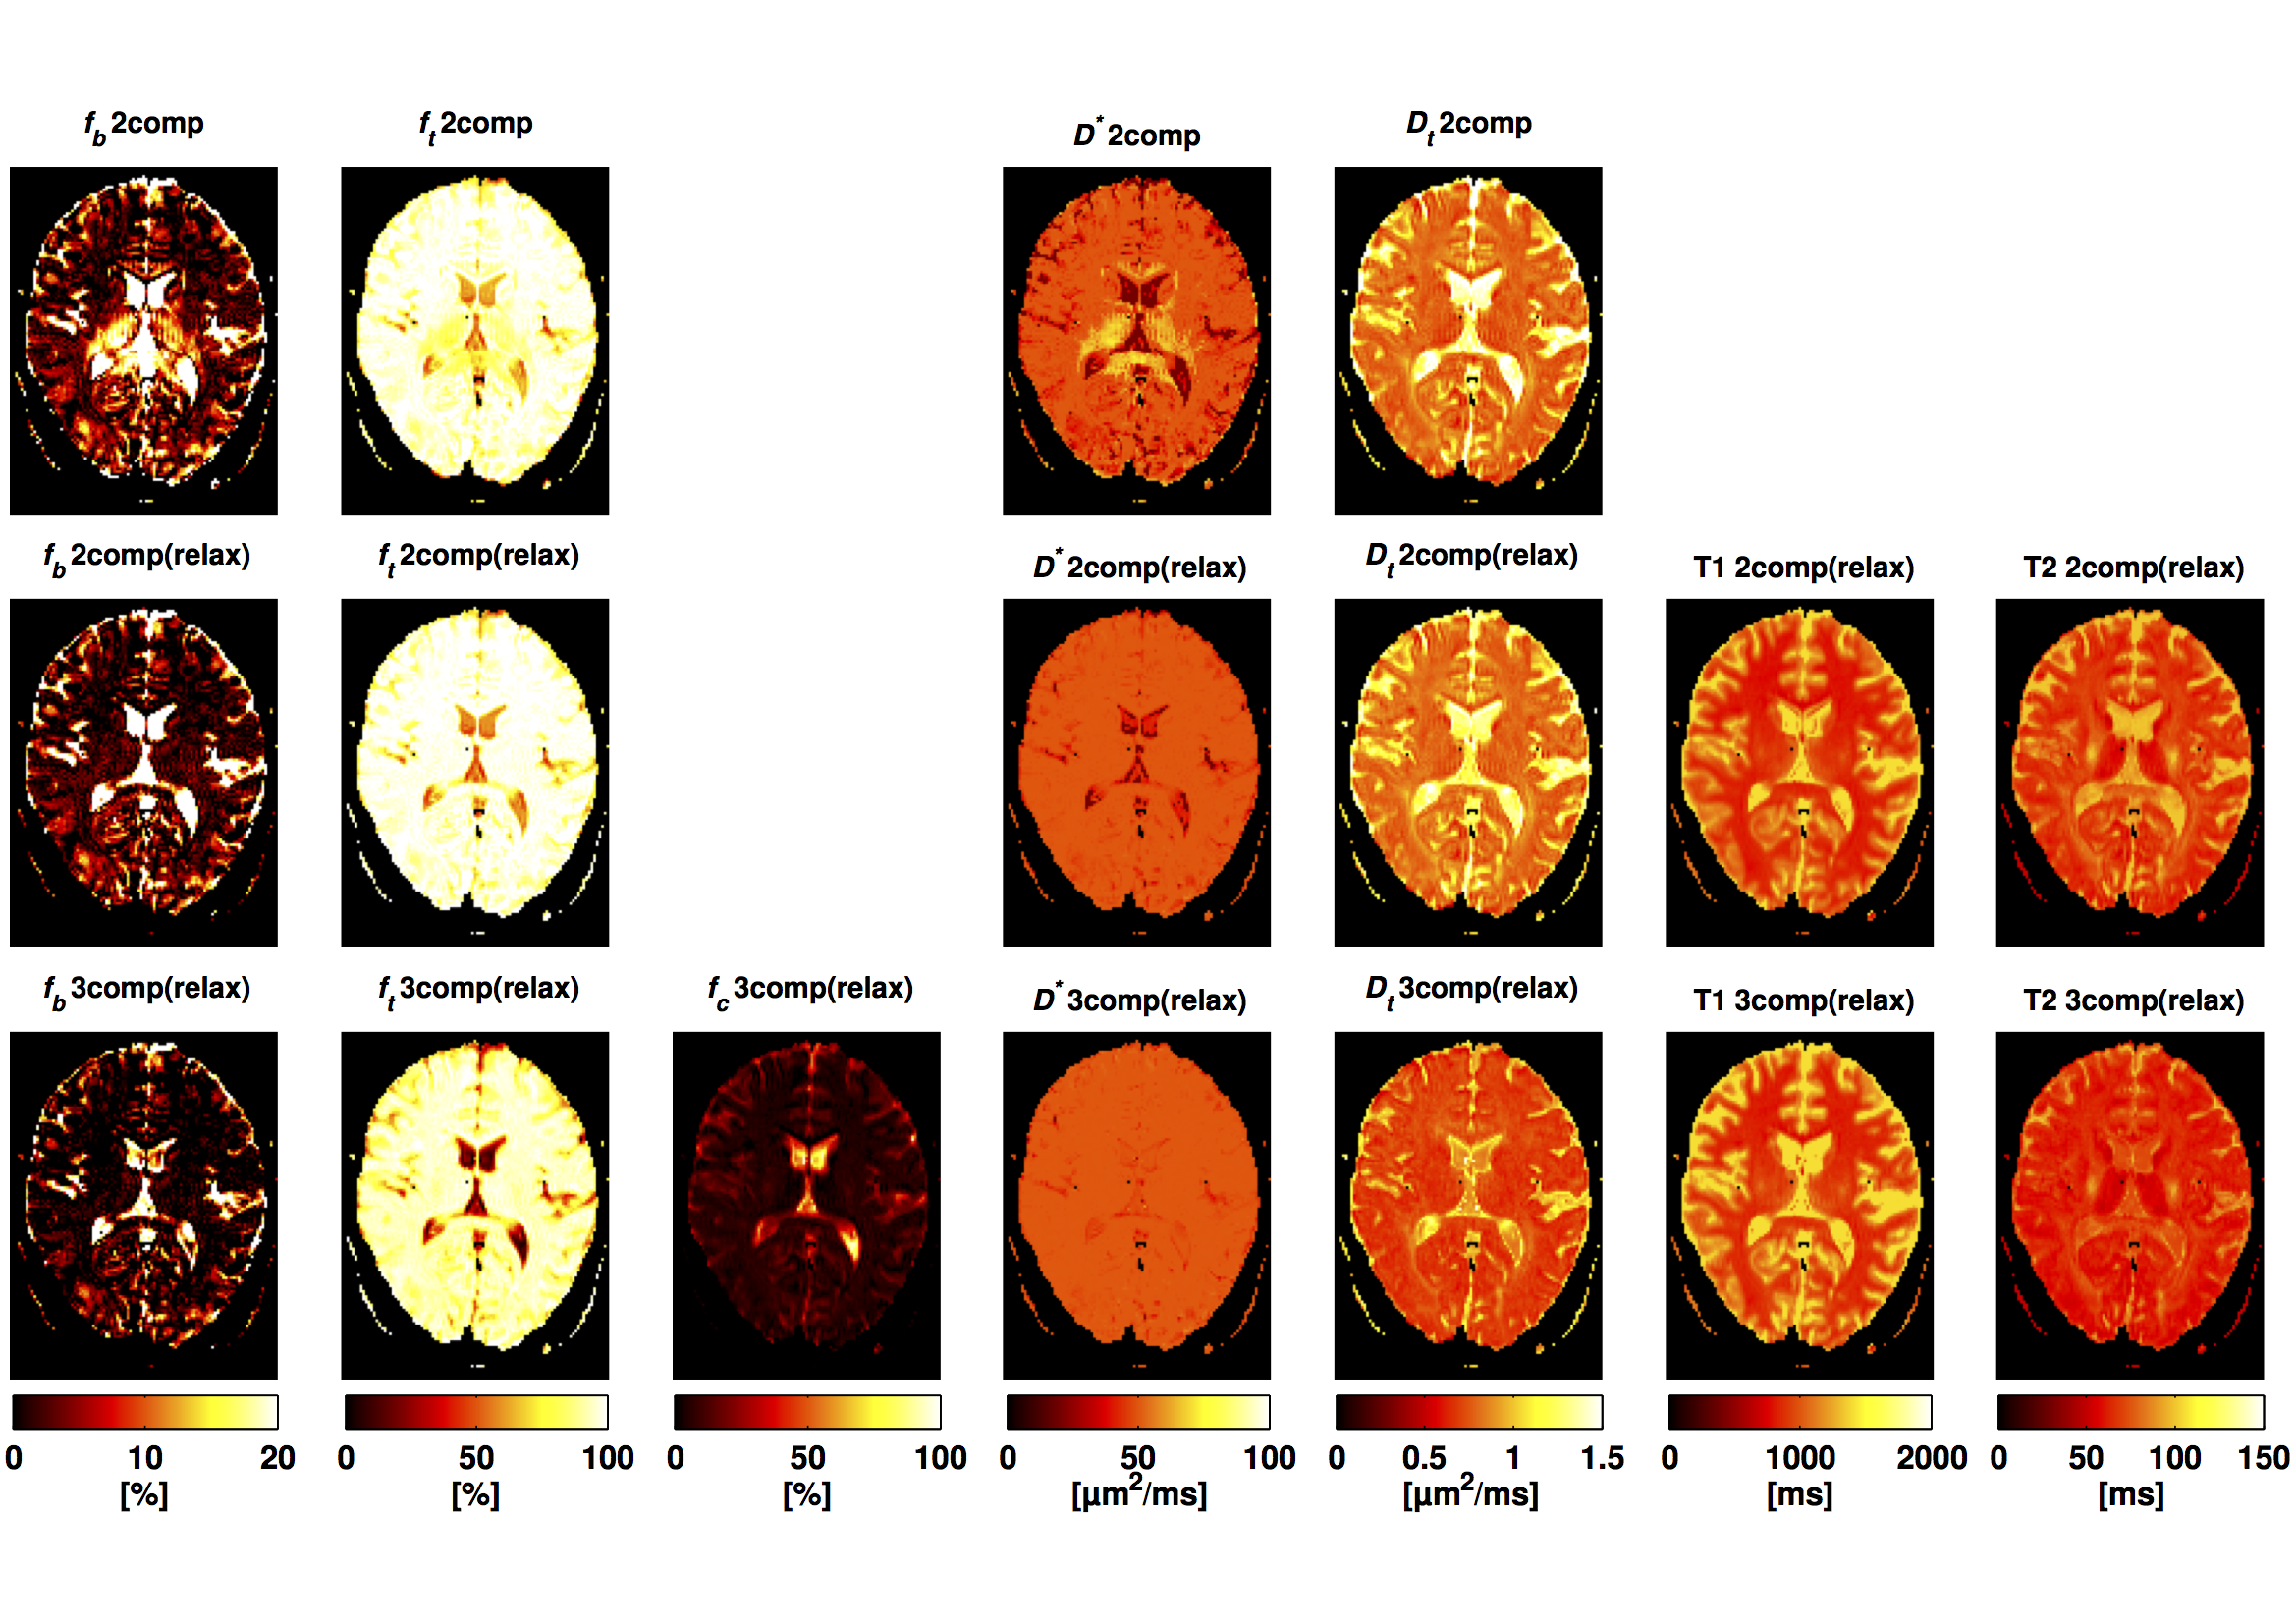
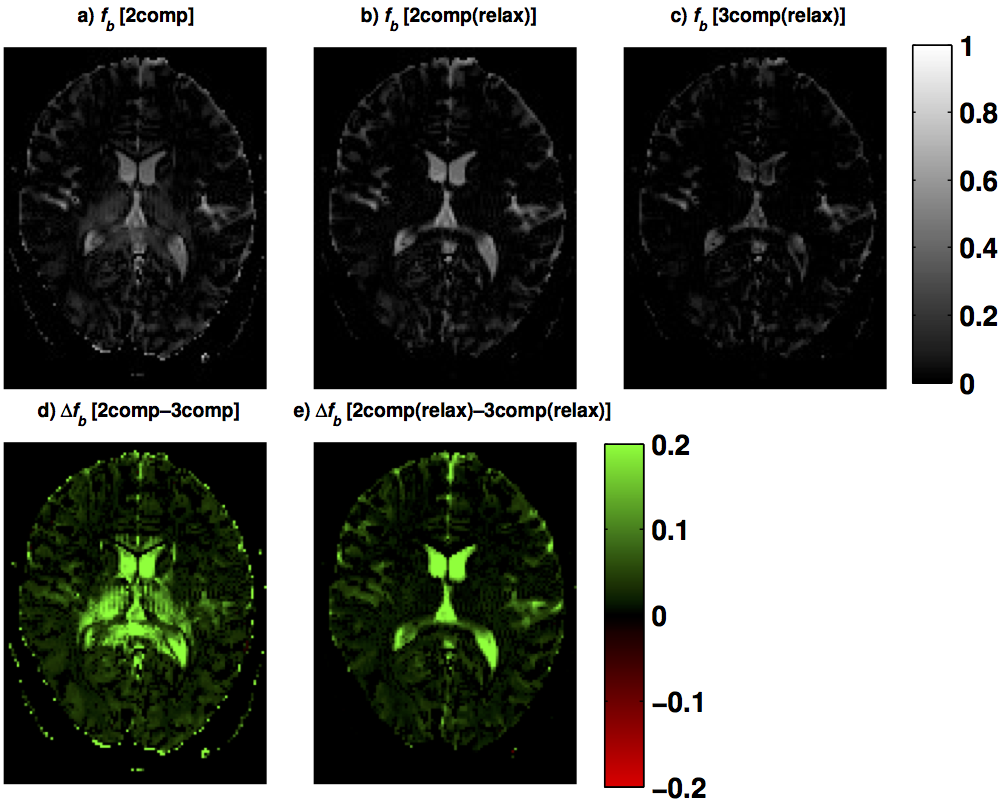
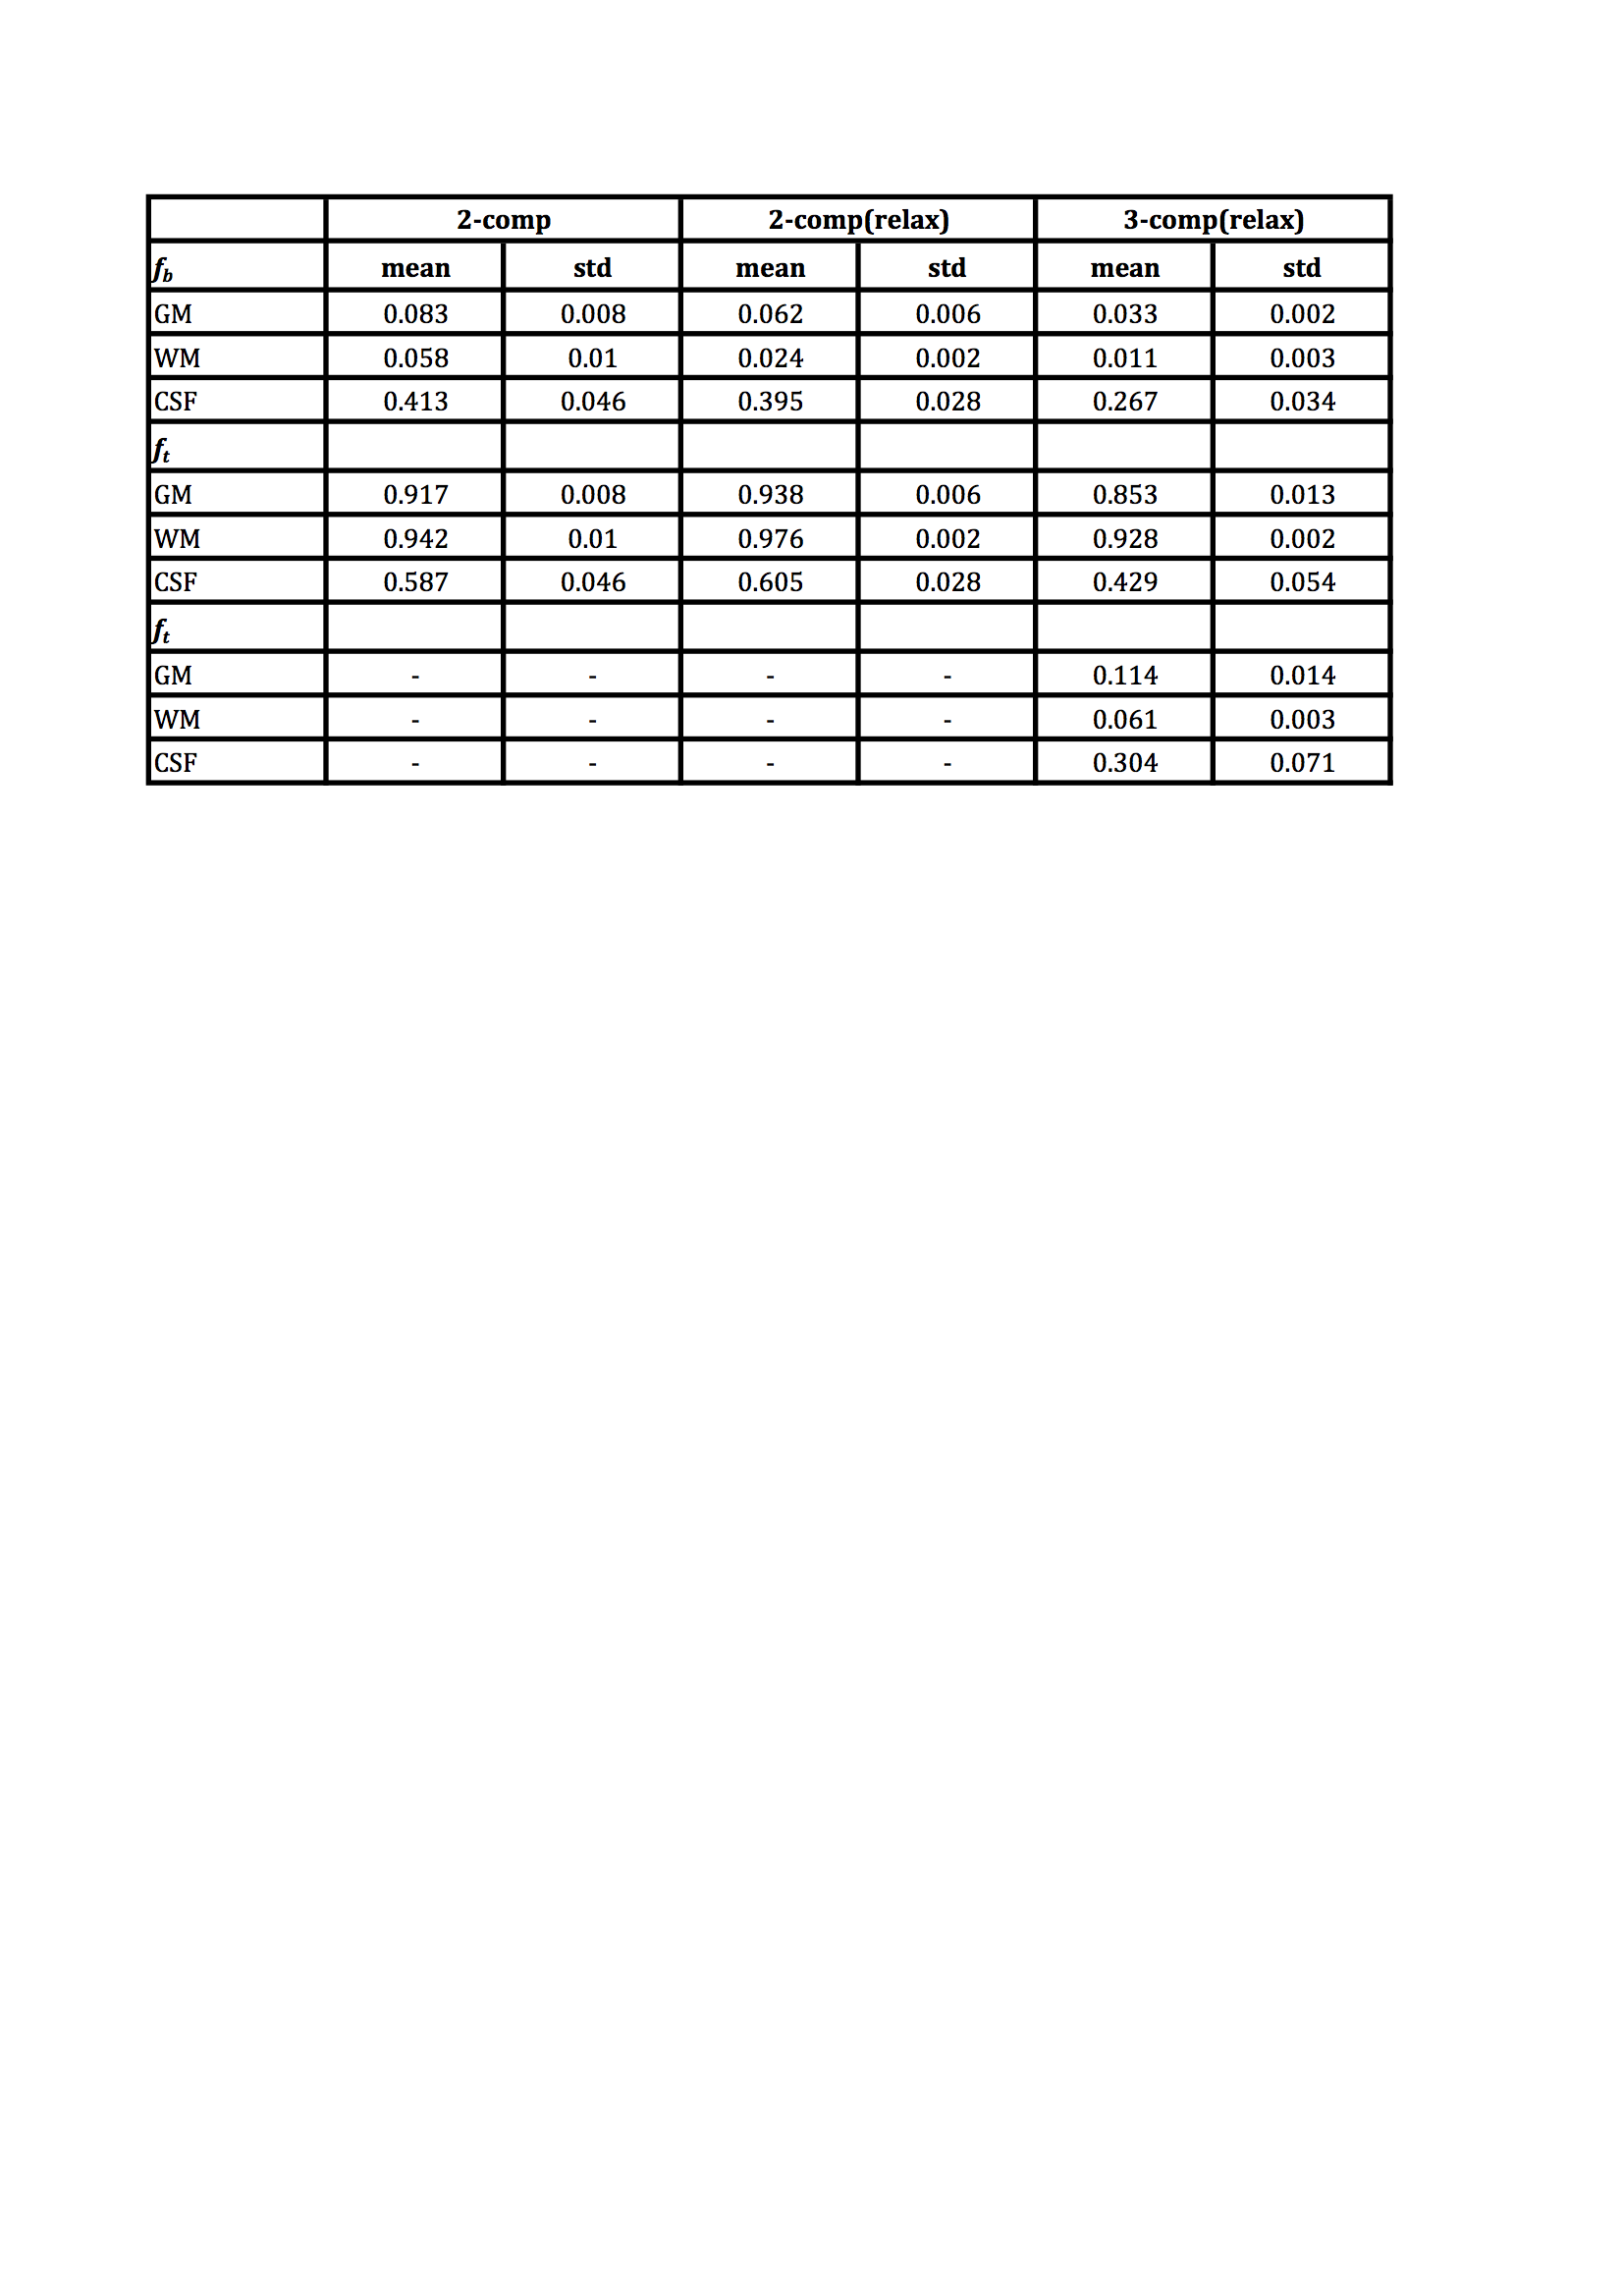
The fractional volume estimates in gray matter (GM), white matter (WM) and CSF are reported in Tab.1. The mean $$$f_b$$$ estimates in GM and WM were reduced when including relaxation compensation (2-comp compared with 2-comp(relax) in Fig.1), and further reduced when including CSF elimination (2-comp(relax) compared with 3-comp(relax) in Fig.1). Fig.2 shows examples of the parameter maps obtained with the different models, in one subject's slice. The different models produced parameter maps that were clearly dissimilar by visual inspection. The $$$f_b$$$ maps, obtained with the three models, are displayed in Fig.3, together with the corresponding difference maps. The difference maps highlight the varying degrees of CSF partial volume effects (PVEs) on the $$$f_b$$$ values estimated with the different models.Discussion and Conclusion
The $$$f_b$$$ and $$$f_t$$$ estimates were substantially influenced by both the inclusion of the CSF compartment and by the inclusion of relaxation compensation. The inclusion of a CSF compartment had the largest effect in GM, likely due to the higher abundance of CSF PVEs, compared to WM. The difference between the two-compartment models, i.e., with and without relaxation compensation, appeared to be driven by inhomogeneous T2 across brain areas (Fig.3). Including relaxation in the model implies that data are acquired in three dimensions (b,TE,TI) instead of in one (b) as in conventional IVIM. This increases the model complexity, but also improves the estimated parameters because tissue, blood and CSF have different diffusion and relaxation properties. The inclusion of relaxation data also contributes to stabilizing the results of the three-compartment analysis. The T1-values were similar for the relaxation-compensated models, but the T2-values differed notably. Again, this is likely to be related to CSF PVEs, since the T2 in CSF differs significantly from that in tissue (T2CSF≈500ms, T2tissue≈70ms)5. It could also be attributed to inhomogeneous T2 across the brain. This could explain the higher tissue T2-values obtained with the two-compartment model, since CSF is not included there. Hence, for brain IVIM applications, one should pay attention to CSF PVEs, but also consider inclusion of relaxation effects.Acknowledgements
We acknowledge Siemens Healthcare for granting access to product sequence source code. This work was partially supported by NIH grants R01MH108574, P41EB015902 and by the Swedish Research Council (grant no. 2011–2971).References
[1] Le Bihan D, Breton E, Lallemand D, Grenier P, Cabanis E, Laval-Jeantet M. MR imaging of intravoxel incoherent motions: application to diffusion and perfusion in neurologic disorders. Radiology. 1986;161(2):401-7.
[2] Le Bihan D, Breton E, Lallemand D, Aubin ML, Vignaud J, Laval-Jeantet M. Separation of diffusion and perfusion in intravoxel incoherent motion MR imaging. Radiology. 1988;168:497.
[3] Rydhög AS, Szczepankiewicz F, Wirestam R, Ahlgren A, Westin C-F, Knutsson L, et al. Separating blood and water: Perfusion and free water elimination from diffusion MRI in the human brain. NeuroImage. 2017;156:423-434.
[4] Okell TW, Chappell MA, Schulz UG, Jezzard P. A kinetic model for vessel-encoded dynamic angiography with arterial spin labeling. Magnetic Resonance in Medicine. 2012;68(3):969-79.
[5] Rydhög AS, van Osch MJ, Lindgren E, Nilsson M, Lätt J, Ståhlberg F, et al. Intravoxel incoherent motion (IVIM) imaging at different magnetic field strengths: What is feasible? Magnetic Resonance Imaging. 2014;32(10):1247-58.
Figures