2694
Evaluating T2* bias impact and correction strategies in quantitative proton density mapping1Cyclotron Research Centre - GIGA-CRC in vivo imaging, University of Liege, Liege, Belgium, 2Department of Neurophysics, Max Planck Institute for Human Cognitive and Brain Sciences, Leipzig, Germany, 3Laboratoire de Recherche en Neuroimagerie, CHUV, University of Lausanne, Lausanne, Switzerland, 4Wellcome Trust Centre for Neuroimaging, University College London, London, United Kingdom, 5Institut für Systemische Neurowissenschaften, Universitätsklinikum Hamburg-Eppendorf, Hamburg, Germany, 6Weierstrass Institute for Applied Analysis and Stochastics, Berlin, Germany
Synopsis
Bias correction is an important step for achieving accurate and precise parameter quantification in MRI. Residual T2*-weighting in quantitative proton density maps estimated from short echo time FLASH images is often considered negligible, despite the potential bias. Using the hMRI toolbox, we analyse simulated FLASH-based multiparameter mapping datasets with variable noise levels. Using the quantitative maps on which the simulations are based as a gold standard, we quantified the bias caused by residual T2*-weighting. Furthermore, we evaluated a number of estimation methods in terms of their sensitivity and/or effectiveness at correcting this T2*-weighting bias, and in terms of their robustness to background noise.
Introduction
Quantitative magnetic resonance imaging (qMRI) helps reveal the biophysical properties governing MRI contrast. By eliminating instrumental biases and other contrast mechanisms influencing the signal amplitude, quantitative parameter maps can be derived and ultimately serve as in vivo biomarkers1. Biases in proton density (PD) map estimation include radio-frequency transmit (B1+) and receive (B1-) fields and T2*-weighting2-5. We focus on the T2* bias in multi-echo fast low angle shot (FLASH) protocols, where the T2* signal dependence is often neglected5,6. Although often pointed out as a potential limitation especially in high iron content areas5,7,8, the extent and severity of this bias and the evaluation of correction strategies have not yet been fully reported.
Methods
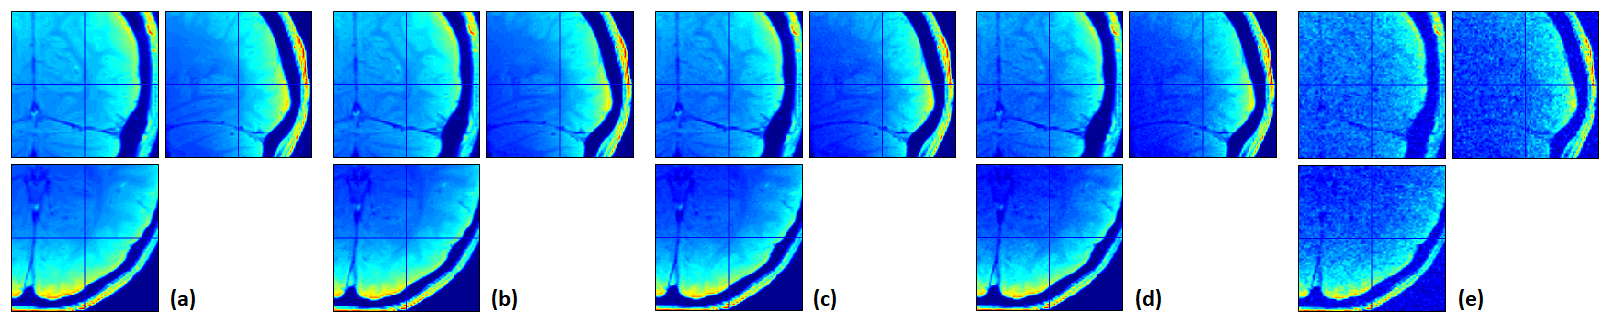
Multi-echo FLASH images were simulated according to the multiparameter mapping protocol described previously7. For PD map evaluation, simulations were limited to PD-weighted (FA=6deg) and T1-weighted (FA=21deg) images with TR=25ms and 8 TE values equally spaced between 2.34 and 18.72ms. The FLASH images were simulated using the Ernst equation (assuming perfect RF spoiling9) and sum-of-square combination of the individual receiver coil signals. Gaussian noise was added to the individual coil images resulting in spatially variable signal-to-noise ratios (SNR).
R2*, R1, PD and B1+ maps generated using the hMRI toolbox10 (single subject dataset) were adaptively denoised11,12 and masked to serve as noise-free inputs to the simulation and as references to evaluate deviations of the PD and R2* map estimates. For example, the relative error in PD estimates was evaluated as follows:
$$RelError(\%)=200*\frac{PD_{est}-PD_{ref}}{PD_{est}+PD_{ref}}$$
Synthetic coil sensitivities were generated using the Biot-Savart law13,14 for 48 coil elements distributed on a
24cm-diameter sphere (excluding the area around the inferior pole
corresponding to the neck aperture in the head coil).
Simulated data were processed using the hMRI toolbox10, with the ESTATICS model15 to estimate R2* maps and the rational approximation of the Ernst equation6 to estimate R1 and A (biased PD) maps. A maps accounted for B1+ bias only (based on the B1+ map input to data simulation). T2* correction factor 2 (optional), UNICORT-like B1- bias correction7,16 and calibration (setting the average white matter (WM) PD value to 69%17) were then applied to generate quantitative PD maps.
The A maps were derived either from:
(1) the first 6 echoes of the PD-weighted images, averaged to increase SNR,
(2) the first PD-weighted echo only (to reduce T2* bias),
(3) extrapolation (TE=0) of the signal decay in the PD-weighted images18.
An optional T2* correction factor was applied voxel-wise to the A map before B1- bias correction:
$$CorrFac=\frac{1}{mean(exp(-TE_i·R_2^*))}$$
where R2* was estimated using ESTATICS and the mean was calculated across TE1-6 for (1) and TE1 alone for (2). No additional correction factor was required for (3).
All the above methods are implemented in the hMRI toolbox10. The additional T2* correction factor, although sensibly used by some authors3 and easily derived from R2* estimates, is often neglected.
Results
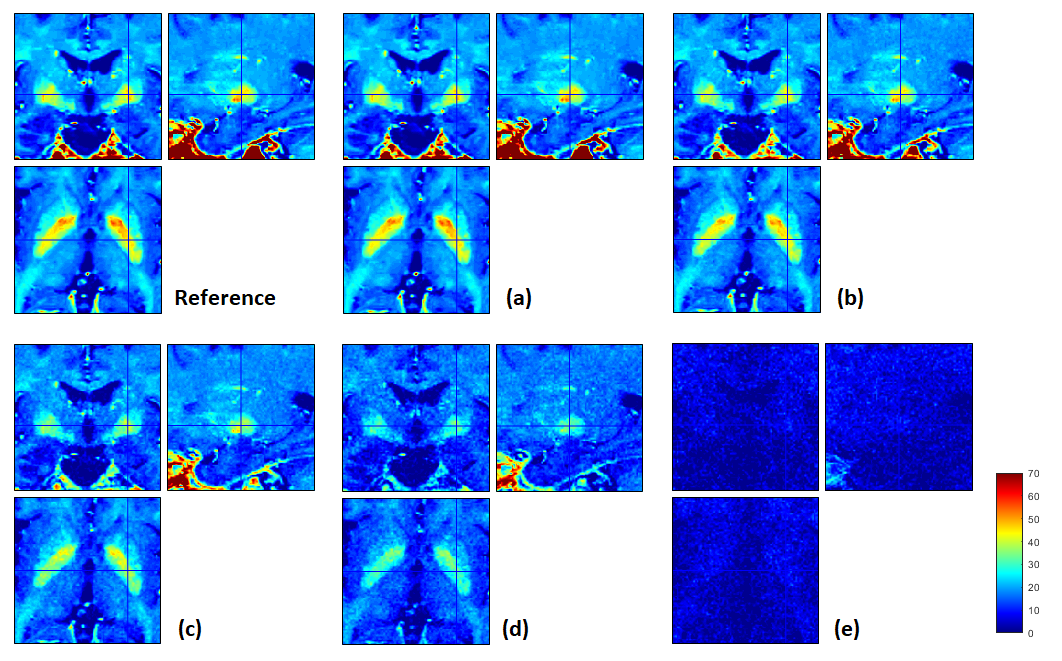
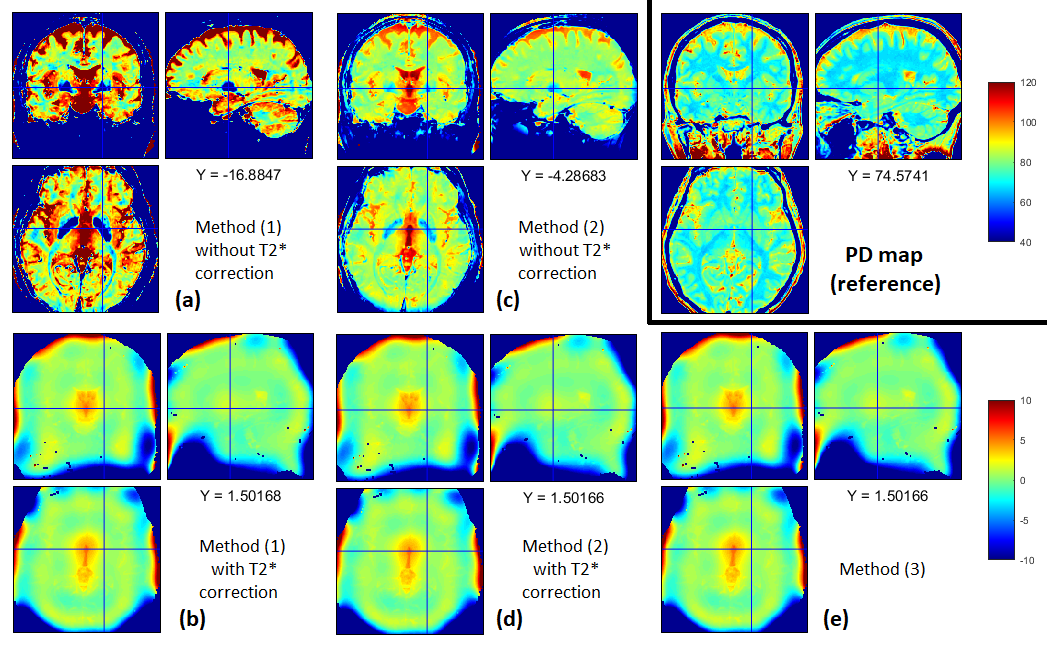
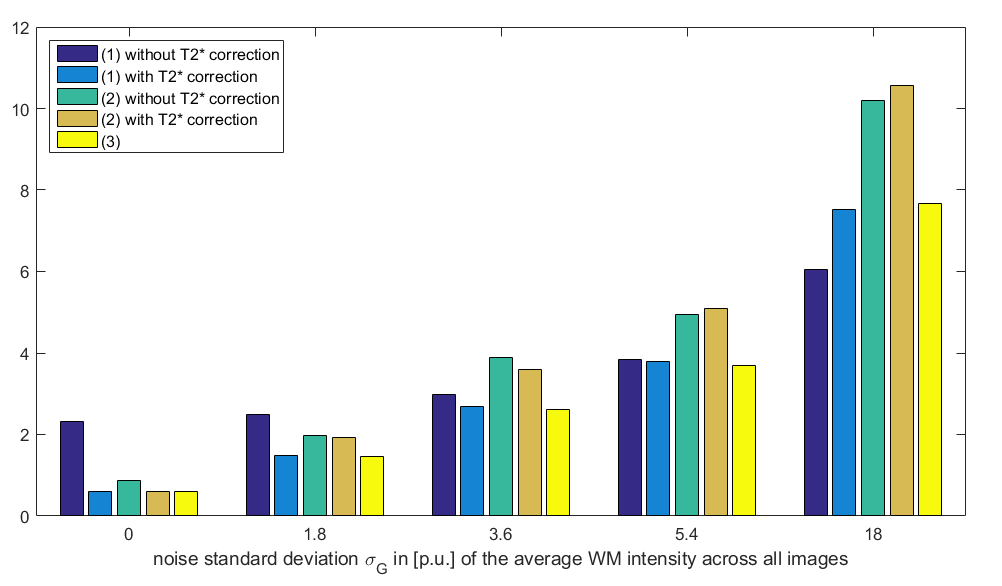
When data were simulated without any additional noise (Fig.1a), the R2* map was perfectly estimated (Fig.2a) and the additional T2* correction factor was successful at correcting for T2* bias in the calculated PD maps (Fig.3b,d). Without T2*-weighting correction, the T2* bias is stronger with method (1) than method (2) due to the longer effective TE in (1) (Fig.3a,c). The bias is especially severe in areas with high R2* values, leading to strongly underestimated PD values in high iron content nuclei. Extrapolation to TE=0 is effective at correcting for T2* bias (Fig.3e). Residual error in the PD estimate can be explained by the approximation5 made to estimate R1 and A and by the imperfect B1- bias correction achieved by the UNICORT procedure.
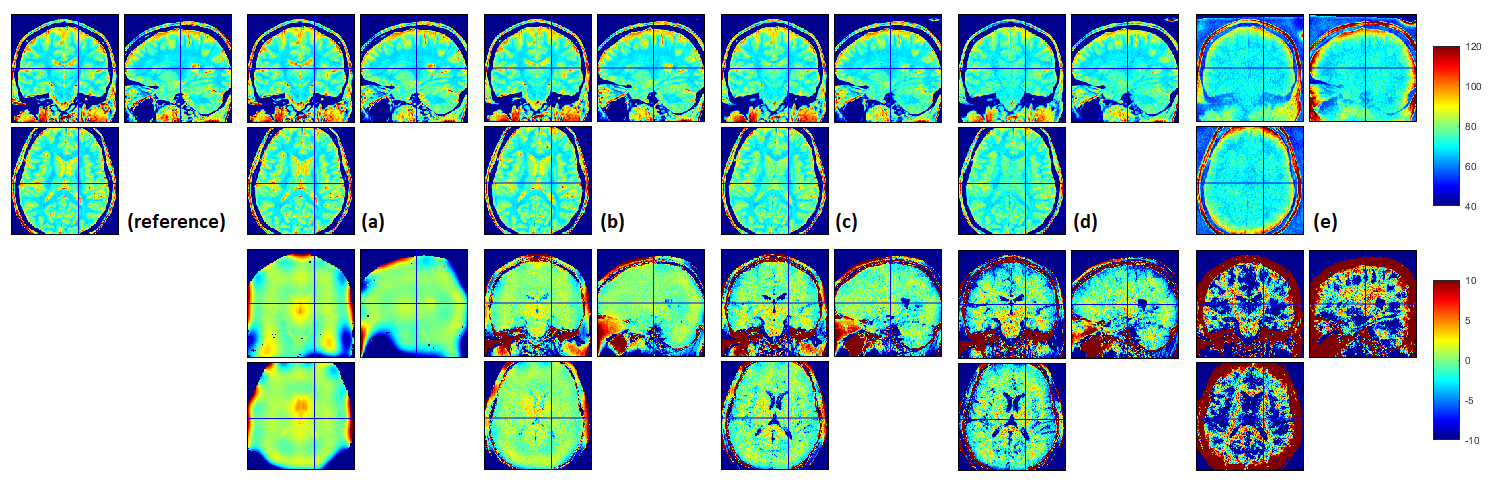
When SNR decreases (Fig.1b-e) and in the absence of appropriate correction19, the R2* map becomes increasingly biased due to the central chi-distribution of the noise (Fig.2b-e) impairing the effectiveness of the T2* correction factor in both methods (1) and (2). The TE=0 extrapolation method (3) also loses effectiveness and accuracy at lower SNR. These effects are shown in details in Figures 4&5.
Discussion and conclusion
Simulated FLASH multiparameter mapping datasets with increasing noise levels were analysed with the hMRI toolbox and various processing strategies for PD estimation. Without T2* bias correction and with calibration to PD=69% in the WM, PD values were overestimated in the cortex (T2*GM>T2*WM) and strongly underestimated in high iron content areas (globus pallidus, red nuclei, substantia nigra). Our results strongly suggest the necessity for T2* bias correction to increase the sensitivity and specificity of qMRI in these areas. All three methods taking T2*-weighting bias into account are effective. However, method(2) shows lower SNR since it relies on a single echo to estimate PD, while methods (1) (with T2* correction) and (3) perform similarly.Acknowledgements
EB received funding from the European Structural and Investment Fund / European Regional Development Fund & the Belgian Walloon Government, project BIOMED-HUB (programme 2014-2020). SM received funding from the European Union's Horizon 2020 research and innovation programme under the Marie Sklodowska-Curie grant agreement No 658589. NW and SM received funding from the BMBF (01EW1711A and B) in the framework of ERA-NET NEURON. The research leading to these results has also received funding from the European Research Council under the European Union's Seventh Framework Programme (FP7/2007-2013) / ERC grant agreement n° 616905. This project has received funding from the European Union's Horizon 2020 research and innovation programme under the grant agreement No 681094, and is supported by the Swiss State Secretariat for Education, Research and Innovation (SERI) under contract number 15.0137. MFC is supported by the MRC and Spinal Research Charity through the ERA-NET Neuron joint call (MR/R000050/1). The Wellcome Centre for Human Neuroimaging is supported by core funding from the Wellcome [203147/Z/16/Z].References
- Weiskopf N, Mohammadi S, Lutti A, Callaghan MF. Advances in MRI-based computational neuroanatomy: from morphometry to in-vivo histology. Curr Opin Neurol. 2015;28(4):313-22.
- Neeb H, Zilles K, Shah NJ. A new method for fast quantitative mapping of absolute water content in vivo. Neuroimage. 2006;31(3):1156-68.
- Volz S, Nöth U, Deichmann R. Correction of systematic errors in quantitative proton density mapping. Magn Reson Med. 2012;68(1):74-85.
- Abbas Z, Gras V, Möllenhoff K, Keil F, Oros-Peusquens AM, Shah NJ. Analysis of proton-density bias corrections based on T1 measurement for robust quantification of water content in the brain at 3 Tesla. Magn Reson Med. 2014;72(6):1735-45.
- Mezer A, Rokem A, Berman S, Hastie T, Wandell BA. Evaluating quantitative proton-density-mapping methods. Hum Brain Mapp. 2016;37(10):3623-35.
- Helms G, Dathe H, Dechent P. Quantitative FLASH MRI at 3T using a rational approximation of the Ernst equation. Magn Reson Med. 2008;59(3):667-72.
- Weiskopf N, Suckling J, Williams G, Correia MM, Inkster B, Tait R, Ooi C, Bullmore ET, Lutti A. Quantitative multi-parameter mapping of R1, PD*, MT, and R2* at 3T: a multi-center validation. Front Neurosci. 2013;7:95.
- Callaghan MF, Freund P, Draganski B, Anderson E, Cappelletti M, Chowdhury R, Diedrichsen J, Fitzgerald TH, Smittenaar P, Helms G, Lutti A, Weiskopf N. Widespread age-related differences in the human brain microstructure revealed by quantitative magnetic resonance imaging. Neurobiol Aging. 2014;35(8):1862-72.
- Preibisch C, Deichmann R. Influence of RF spoiling on the stability and accuracy of T1 mapping based on spoiled FLASH with varying flip angles. Magn Reson Med. 2009;61(1):125-35.
- The hMRI analysis toolbox for quantitative MRI and in vivo histology using MRI (hMRI): http://www.hmri.info/
- Mohammadi S, D'alonzo Ch, Ruthotto L, Polzehl J, Ellerbrock I, Callaghan MF, Weiskopf N, Tabelow K. Simultaneous adaptive smoothing of relaxometry and quantitative magnetization transfer mapping. Preprint no. 2432, WIAS, Berlin, 2017, DOI 10.20347/WIAS.PREPRINT.2432
- Tabelow K, D'alonzo Ch, Polzehl J, Callaghan MF, Ruthotto L, Weiskopf N, Mohammadi S. How to achieve very high resolution quantitative MRI at 3T? 22th Annual Meeting of the Organization of Human Brain Mapping (OHBM 2016), Geneva, Switzerland, June 26 - 30, 2016.
- Guerquin-Kern M, Lejeune L, Pruessmann KP, Unser M, Realistic Analytical Phantoms for Parallel Magnetic Resonance Imaging. IEEE Trans Med Imaging. 2012;31(3), 626-636.
- Matlab Framework for MRI Simulation and Reconstruction: http://bigwww.epfl.ch/algorithms/mri-reconstruction/code_v1-0.zip
- Weiskopf N, Callaghan MF, Josephs O, Lutti A, Mohammadi S. Estimating the
apparent transverse relaxation time (R2*) from images with different contrasts
(ESTATICS) reduces motion artifacts. Front Neurosci. 2014;8:278.
- Weiskopf N, Lutti A, Helms G, Novak M, Ashburner J, Hutton C. Unified segmentation based correction of R1 brain maps for RF transmit field inhomogeneities (UNICORT). Neuroimage. 2011;54(3):2116-24.
- Tofts PS, Quantitative MRI of the brain (chapter 4). John Wiley & Sons, Ltd, Chichester, UK.
- Ellerbrock I, Mohammadi S. Four in vivo g-ratio-weighted imaging methods: Comparability and repeatability at the group level. Hum Brain Mapp. 2017 Nov 1. doi: 10.1002/hbm.23858.
- Tabelow K, D'alonzo Ch, Ruthotto L, Callaghan MF, Weiskopf N, Polzehl J, Mohammadi S. Removing the estimation bias due to the noise floor in multi-parameter maps. The International Society for Magnetic Resonance in Medicine (ISMRM) 25th Annual Meeting & Exhibition, Honolulu, USA, April 22 - 27, 2017.
Figures