2693
Comparison of Efficacy of Multiple EPI Distortion Correction Techniques on Toddler Data1Functional MRI Facility / NIMH, National Institutes of Health, Bethesda, MD, United States, 2Section on Behavioral Pediatrics / NIMH, National Institutes of Health, Bethesda, MD, United States, 3Scientific and Statistical Computing Core / NIMH, National Institutes of Health, Bethesda, MD, United States, 4Data Science and Sharing Team / NIMH, National Institutes of Health, Bethesda, MD, United States
Synopsis
Echo-planar data acquired from a group of toddlers was distortion corrected using combinations of different data, algorithms, and software packages. Performance was evaluated by comparing mutual information scores of how well corrected versus uncorrected EPI data aligned with structural T1-weighted data.
Introduction
The use of resting state MRI EPI data [1] to characterize normal and pathological conditions in various populations continues to increase. As use of such data increases, so does the need to make sure results obtained from it align more accurately and consistently with corresponding anatomical data, both within and across subjects, if any reasonable findings and claims can be made.
Here, toddlers underwent a scanning battery in which several types of image data were repeatedly acquired over multiple visits. These data include T1-weighted anatomical data, resting state EPI data, and auxiliary data (B0 field maps [2] and reversed-blip EPI data [3, 4]).
This work compares how well B0 and reversed-blip EPI data, when employed in different software suites (AFNI [5] and FSL [6]), correct geometrically distorted EPI data, and improve registration to the T1-weighted structural data. This is evaluated by using ANTs [7] to compute mutual information (MI) scores between the T1-weighted structural data, uncorrected, and corrected images produced by the various algorithms and software packages.
Methods
Scanning: 41 toddlers (age range 9-21 months) were scanned on a GE (Waukesha, WI) MR-750 3T scanner (software revision DV22.0_V02), using the vendor's 32-channel head coil. Participants were scanned during late evening running into early morning sessions, unsedated. 70 scanning sessions were acquired with full or partial data, and included in these analyses. For inclusion, sessions must have a complete T1-weighted anatomical scan, an EPI rest scan with at least 15 volumes, and either a reversed-blip EPI scan or a B0 scan, acquired with the subject's head in the same position as the resting state data, so that at least one correction algorithm from each software package could be evaluated.
T1-weighted anatomical scans were acquired with the following parameters: image matrix = 256×256×142, with voxel size of 0.75×0.75×1.0mm, TR = 2100ms, TI = 885 ms, TE = 2.8ms, acquisition BW = 50kHz. Resting state data were acquired on a 96x96 image matrix, with 36 slices, TR = 2000ms, TE = 30ms, a nominal voxel size of 2.0×2.0×3.0mm, BW = 500kHz, flip angle = 65°, EPI echo spacing = 620 µs, and an acceleration factor (ASSET) of 2. Reversed blipped EPI data were collected matching parameters of the resting state scan, with the image phase-encoding blips having reversed polarity. B0 data were also acquired on the same image matrix and the same geometric prescription as the EPI data, using a dual-TE 2D gradient-echo sequence with the following parameters: TR = 1000ms, TE1/TE2 = 6.4/8.86ms, flip angle = 35°.
Analysis: Tools in two software packages (AFNI and FSL) were used to perform distortion correction on the EPI data using different algorithms and their accompanying software modules. From FSL, 'topup' and 'applytopup' were used to perform corrections using the reversed-blip EPI data, while 'fugue' utilized information from the B0 scan for distortion correction. From AFNI, '3dQwarp' utilized information from the reversed-blip EPI scan data, and a series of commands employing '3dNwarpApply' used B0 data for distortion correction.
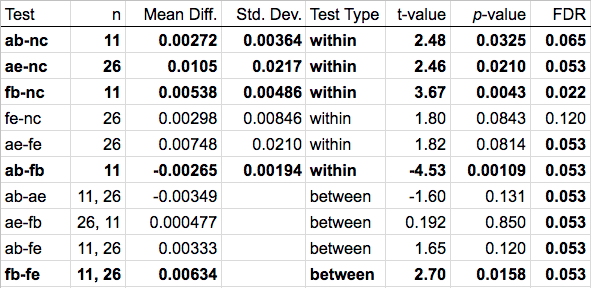
The first 15 volumes of EPI data from each session were distortion corrected using either the B0 or reversed-blip EPI data, using modules from both software suites. After distortion correction, ANTs was used to perform a rigid body registration of the first 15 volumes of the corrected EPI data to the anatomical data, and an average MI was computed between the registered 15 volumes of the distortion-corrected EPI data, to the T1-weighted data. A percentage change in MI was then computed for each pipeline, with MI score of the uncorrected EPI data to the T1-weighted anatomical data serving as the base state from which the change is computed. MI change for each pipeline was evaluated with a within subject t-test. Comparisons between pipelines were made with within subject tests when possible, and between subject t-tests otherwise, as shown in Figure 1. The Benjamini-Hochberg procedure was used to control for multiple-comparisons with a false discovery rate (FDR) of 0.1.
Data were organized into a BIDS tree structure ([8], http://bids.neuroimaging.io), to facilitate replication of the various distortion correction streams on the EPI data. Commands and parameters used in this study are available in a public repository on GitHub.com (https://github.com/nih-fmrif/bids-b0-tools).
Results and Discussion
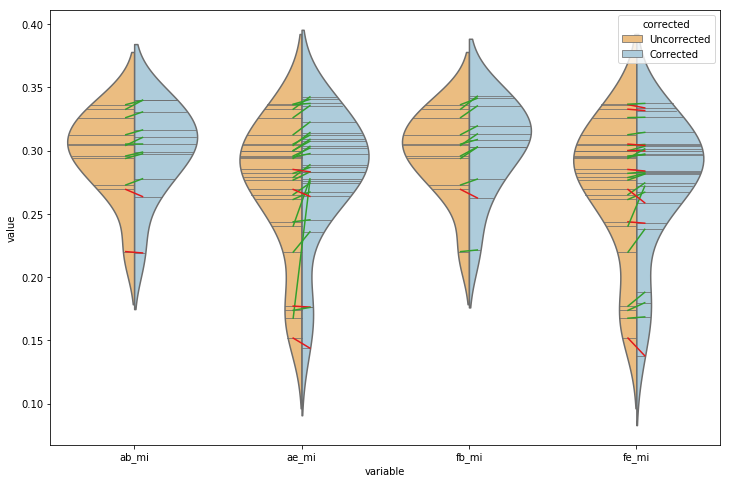
Statistics in Figure 1 give AFNI's reversed-blip EPI correction the highest average change in MI. However, its standard deviation, as with the standard deviation of all comparisons, were high relative to their means. FSL's B0 correction performed most consistently on these data, improving MI in 10 of 11 subjects, even though many fewer sessions had completed B0 scans. Figure 2 displays the relative performance of all schemes. These differences in performance between corresponding algorithms in AFNI and FSL warrant further investigation.
Acknowledgements
The authors thank the NIH IRP for supporting this work.
This study utilized the high-performance computational capabilities of the Biowulf Linux cluster at the National Institutes of Health, Bethesda, MD (http://biowulf.nih.gov).
References
1. Biswal, Yetkin, Haughton, Hyde. Functional connectivity in the motor cortex of resting human brain using echo-planar MRI. Magn Reson Med, Vol 34(4), 537 - 541 (1995).
2. Jezzard, Balaban. Correction for geometric distortion in echo planar images from B0 field variations. Magn Reson Med, Vol 34(1), 65 - 73 (1995).
3. Andersson, Skare, Ashburner. How to correct susceptibility distortions in spin-echo echo-planar images: application to diffusion tensor imaging. NeuroImage, Vol 20, 870 - 888 (2003).
4. Holland, Kuperman, Dale. Efficient correction of inhomogeneous static magnetic field-induced distortion in Echo Planar Imaging. NeuroImage, Vol 50, 175 - 183 (2010).
5. Cox. AFNI - Software for Analysis and Visualization of Functional Magnetic Resonance Neuroimages. Computers and Biomedical Research, Vol 29, 162 - 173 (1996).
6. Smith et. al. Advances in functional and structural MR image analysis and implementation as FSL. NeuroImage, Vol 23(S1), 208 - 19 (2004).
7. Avants, Tustison, Stauffer, Song, Wu, Gee. The Insight ToolKit image registration framework. Frontier in Neuroinformatics, Vol 8:44, 2014.
8. Gorgolewski et. al. The brain imaging data structure, a format for organizing and describing outputs of neuroimaging experiments. Scientific Data, Vol 3, 160044, 2016. doi:10.1038/sdata.2016.44
Figures