2688
Measured k-space based RF Compensation Effect Analysis within Various 2D Excitation Volume in 7T pTx system1Radiology, Cleveland Clinic, CLEVELAND, OH, United States
Synopsis
This work presents simple method for RF compensation effect analysis. For the RF compensation, we used previously presented measured k-space based method. We analyzed three different 2D excitation volume data using simple histogram based method and found that not only for small volume excitation region, larger volume excitation region shows significant and more dominant compensation effect. This finding will help inform the design of RF profiles in In-vivo 2D excitation applications in pTx system.
Purpose
2D RF excitation was introduced by Pauly et al1. However, long RF duration has prevented practical application. TSENSE2 with a parallel transmit (pTx) system has the potential to reduce RF duration. Various approaches have been proposed for improving the accuracy of the excitation profile in pTX-TSENSE3,4 . In this study, we used RF compensation method which was provided by Takahashi et al3 and further examined compensation effect with simple histogram based method for various 2D excitation volumes with different size in 7T.
Methods
System info
All the images are acquired using a Siemens 7T Magnetom with SC 72 gradient system (Siemens Medical Solutions, Erlangen) with 8Tx/32Rx ch head coil (Nova Medical) on an agar phantom5
RF design
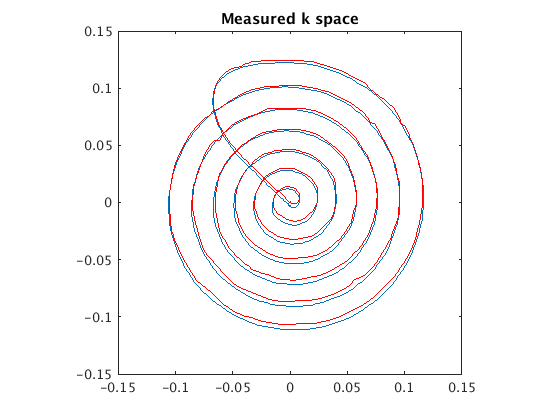
RF duration was set to 5.23ms, a duration that is short enough for practical use. To enhance 2D excitation efficiency, we used a variable density spiral-in trajectory. Field of excitation was 260mm at the k-space center and 180mm at the k-space boundary, Excitation volume resolution was 4mm. 70mT/m maximum gradient amplitude and 200T/m/s maximum slew rate was used. A compensated RF profile was calculated based on measured k-space data3. When we design variable density spiral gradient profile, sampling interval is set to 10us. So when we measure actual k-space trajectory from the gradient profiles, data sampling interval was set to 5us to minimize data resampling related errors. Figure 1 shows ideal and actually measured k-space trajectory. The 8ch RF profile with acceleration factor 4 was calculated based on an axial iso-center B1 sensitivity map6 (voxel size: 4x4x5mm). 24mm x 24mm, 40mm x 40mm and 56mm x 56mm 2D rectangular regions were set for the 2D excitation volume and a total of 6 RF profiles were generated.
Image parameters
A GRE 3D volume of was acquired using the RF profile described above. TR/TE 50/5ms, matrix 128 x128 x88, 2 mm isotropic voxels, flip angles 20°, bandwidth 260Hz/pixel. Total acquisition time was 5min 17s.
Results
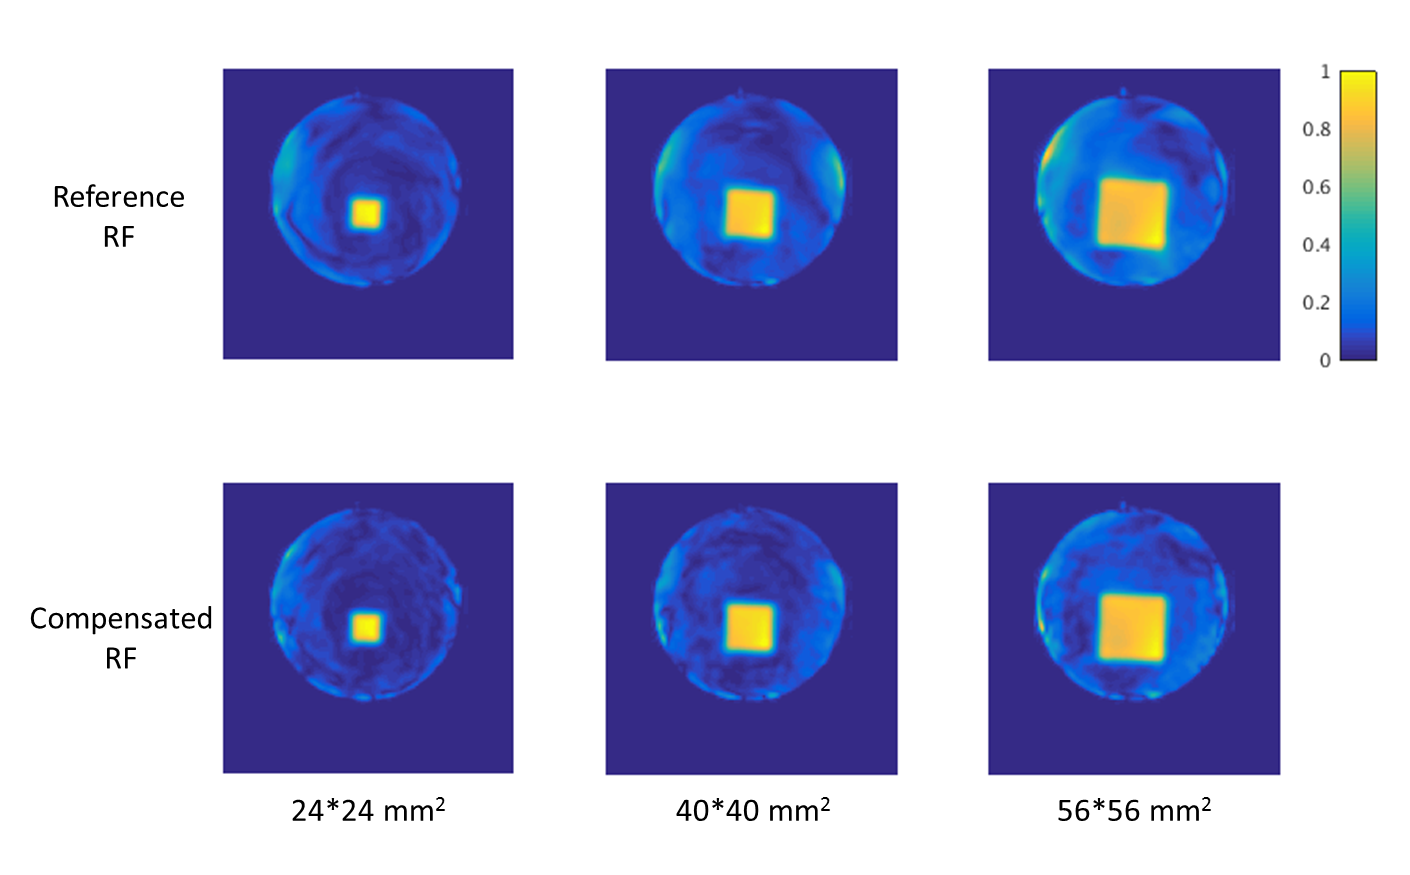
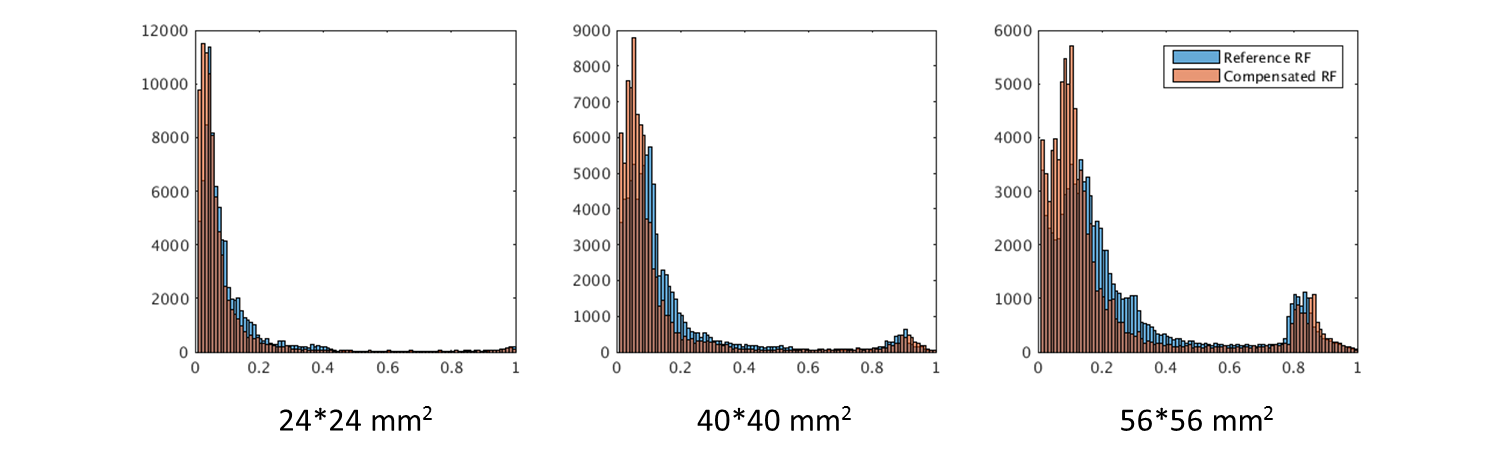
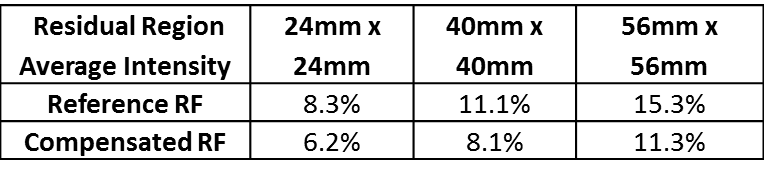
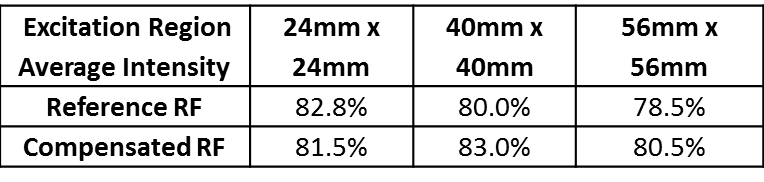
Only the axial iso-center slice image was analyzed, as the B1 sensitivity map used for the RF calculation was confined to this slice. Figure 2 compares the 2D excitation profiles with and without compensation. To test the RF compensation effect quantitatively, we calculated the histogram of each excitation volume (Figure 3). A threshold of 1% of the normalized maximum signal intensity was sed to exclude background. Normalized signal intensity less than 0.5 is considered ‘Residual excitation’ which implies outside region of the intended 2D excitation profile. Normalized signal intensity larger than 0.5 can be considered as ‘Excitation region’. We can confirm the RF compensation effect by examining the histogram of signal in both residual and excitation region. In ideal case, residual region signal should be near zero and excitation signal should be near one if we excite 2D volume efficiently. If RF compensation works well, residual region histogram plot should be shifted toward zero and excitation region plot should be shifted toward one. In Figure 3, we can confirm that residual region signals were clearly suppressed (shifted toward zero) in all volume images. And excitation region plots are also shifted toward one in larger volume images. Table 1, 2 show the average signal intensity in residual and expected excitation region. In larger excitation volume histogram, residual region signal is dropped and expected excitation region signal is increased more significantly.
Discussion
Smaller 2D excitation volume implies relatively significant high frequency components on corresponding excitation k-space. At first we expect to see high frequency components compensation would attribute more efficient excitation profile in small excitation volume images. However, we found that when 2D excitation volume increases RF compensation effect became more dominant when we consider residual excitation profile together. Interestingly, 24mm x 24mm excitation region RF compensation did not show improved effect. One possible explanation is a relatively low ratio of excitation voxel number to image boundary voxels which cause signal artifacts. We got 2mm iso-cubic voxel images and roughly 150 voxels signals were calculated for excitation region analysis only. For the smaller excitation region analysis, those artifact effects also need to be considered. Additionally, since we used simple rectangular excitation volume and histogram analysis only, further study and analysis will be necessary for more definite conclusion. This finding will help inform the design of RF profiles in In-vivo 2D excitation applications in pTx system.
Acknowledgements
The authors gratefully acknowledge technical support provided by Siemens Healthcare.References
1. Pauly J, Nishimura D, Macovski A. A k-space analysis of small-tip-angle excitation. J Magn Reson 1989;81:43–56.
2. Katscher U, Bornert P, Leussler C, van den Brink JS. TransmitSENSE. Magn Reson Med 2003;49:144–150.
3. Takahashi A, Peters T. Compensation of multi-dimensional selective excitation pulses using measured k-space trajectories, Magnet Reson Med. 1995; 34: 446–456
4. Zheng H, Zhao T, Qian Y, Ibrahim T, Boada F. Parallel transmission RF pulse design for eddy current correction at ultra high field, J.Magn.Reson. 2012;221:139-146
5. Friedman L, Glover GH. Report on a multicenter fMRI quality assurance protocol. J Magn Reson Imaging 2006;23:827–39.
6. Grissom W, Yip CY, Zhang Z, Stenger VA, Fessler JA, Noll DC. Spatial domain method for the design of RF pulses in multi coil parallel excitation. Magn Reson Med 2006;56:620–629.
Figures