2687
Accurate localization of individual DBS contacts by MRI using zero-TE phase images1GE Global Research, Niskayuna, NY, United States, 2GE Healthcare, Munich, Germany, 3GE Healthcare, Waukesha, WI, United States, 4Albany Medical Center, Albany, NY, United States
Synopsis
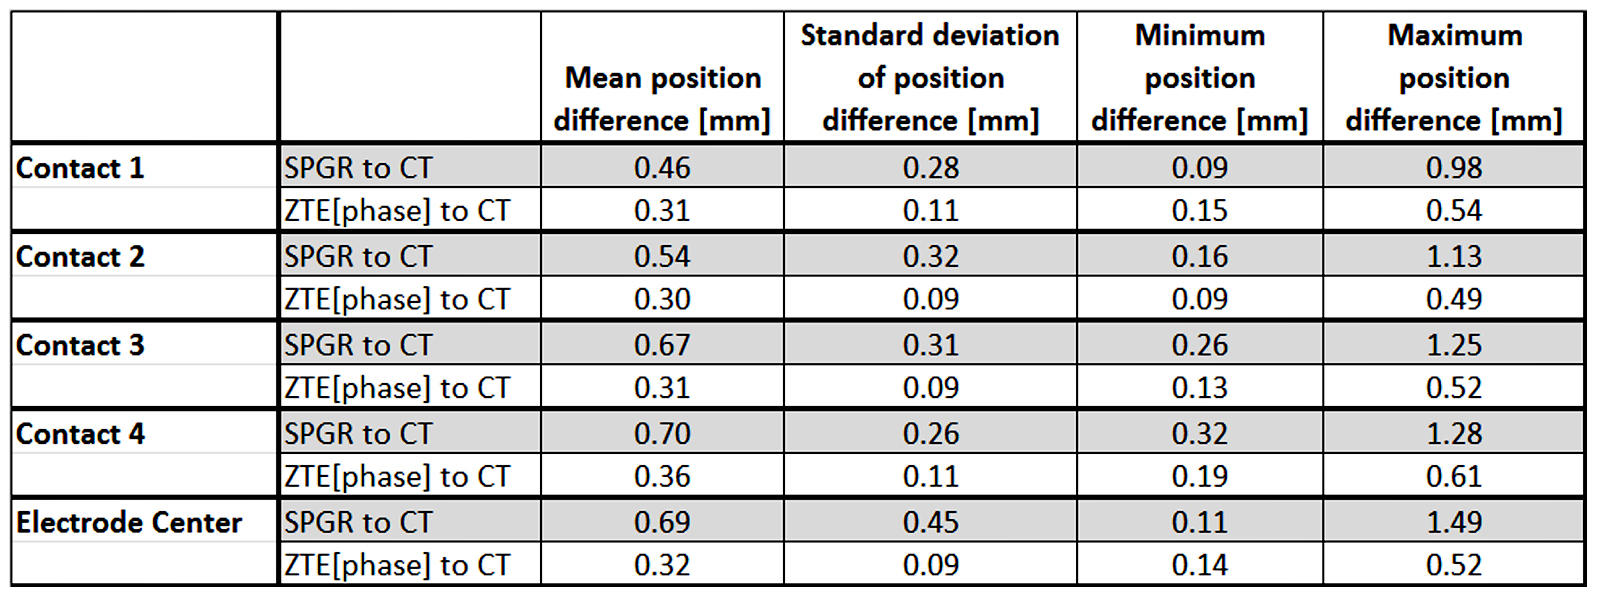
The goal of our work was to demonstrate improved DBS contact visualization and localization by using a zero-TE (ZTE) acquisition. Signal dephasing during sequence readout, proportional to the electrode-induced field inhomogeneity, enables high-contrast visualization of individual electrode contacts. Matching measured ZTE-phase maps to simulations of orientation dependent, susceptibility induced field inhomogeneity created by the electrode is shown to result in significantly more accurate and precise contact localization than by using standard SPGR acquisitions. Electrode center differences of 0.69±0.45mm/0.32±0.09mm were seen between SPGR/ZTE[phase] and CT.
Introduction
Deep Brain Stimulation (DBS) is a well-established approach for treating many neurological disorders1. Locating the DBS electrode post-operatively is important for assessing surgery success and aiding device programming; differences between the intended and actual target larger than 2 mm result in suboptimal outcome and may require reoperation2-3. Post-surgical imaging results in imperfect electrode localization, due to beam hardening artifacts (CT) or susceptibility induced signal loss (MRI). Physical electrode diameters of 1.27 mm appear as ~2.6mm-wide signal blooms in CT, and ~3.8 mm-wide signal voids in MRI4. Differences in DBS electrode locations on CT and MRI images exceeding 1 mm are routinely found5.
The goal of our work was to demonstrate improved, MRI-based electrode visualization/localization, by using a zero-TE (ZTE) acquisition6,9. Signal dephasing during sequence readout, proportional to the electrode-induced field inhomogeneity7, enables high-contrast contact visualization. Matching measured ZTE-phase maps to simulations of orientation dependent, susceptibility induced field inhomogeneity created by the electrode results in significantly more accurate/precise contact localization than by using standard SPGR acquisitions.
Methods
Imaging: A head-shaped, gel-filled phantom with an embedded Medtronic 3387 DBS lead was scanned on a GE Revolution CT scanner and at 3T (GE MR750) using an 8-channel head coil. Images were acquired with matched SPGR and proton-density-weighted ZTE sequences (spatial_resolution/BW/flip/TE/TR/nex/acquisition_time/B1+RMS/SAR of 0.8mm/31kHz/12°/3ms/7ms/1/8:28min/1.38mT/1.45W/kg and 0.8mm/31kHz/3°/20ms/620ms/3/8:34min/1.15mT/1W/kg for SPGR/ZTE).
The phantom was imaged in six positions for both MR and CT; nine fiducial markers attached to the phantom were used to register MRI to CT scans, hence validate localization performance.
Electrode localization: Electrode regions were first automatically segmented and up-sampled by a scale factor (10x for CT/SPGR, 0.5x-10x for ZTE). Electrode orientation was estimated via SVD of a morphological mask obtained by thresholding the MR magnitude/CT images.
For CT/SPGR, the 4 contacts’ positions were estimated from the shape of the signal-bloom (CT), and of the inverted signal-void (pseudo-positive contrast) (SPGR).
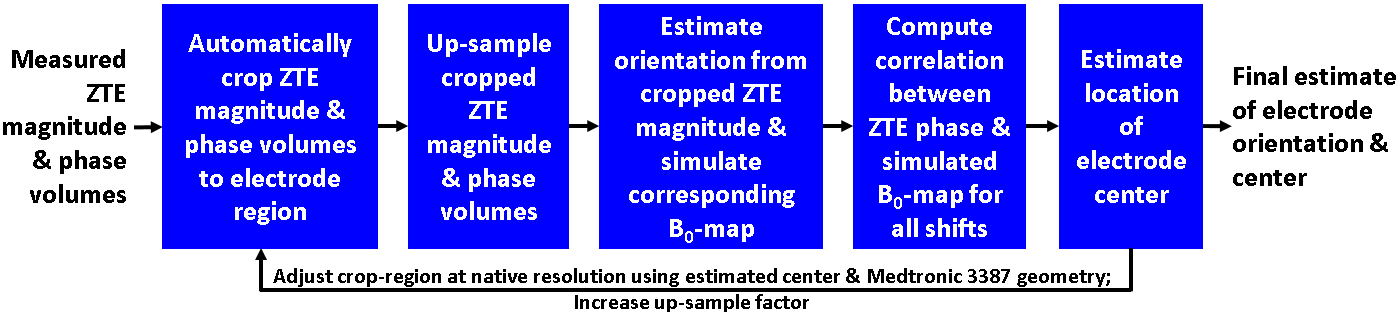
For ZTE[phase] localization, a geometric model of a Medtronic 3387 lead with appropriate susceptibility values was first created. A multi-scale correlation-based approach was used for localization: at each scale, after segmenting the electrode region in the ZTE data and determining orientation, B0-maps matching the scale/orientation were simulated, using the geometric model as input8. The volume inside the electrode was set to zero, to reduce the impact of this noise-dominated region on localization. The electrode center was estimated by finding the translation maximizing the correlation between the simulated B0-map and ZTE[phase]; this value was used as a starting point for the next scale. The contacts’ positions were computed using the electrode center and the known geometry. The translation and correlation operations were jointly done via 3D FFTs for fast computation. Figure 1 summarizes the workflow for electrode localization for ZTE[phase].
Accuracy and precision validation: For each phantom position and each MR/CT scan, fiducial centers were identified by matching each fiducial’s volume with a template. Rigid 4×4 transformation matrices were then computed that best projected the fiducials from the MR to the CT locations. The SPGR/ZTE-determined electrode/contact location was projected into the CT space using this transformation and compared to the CT location.
Results
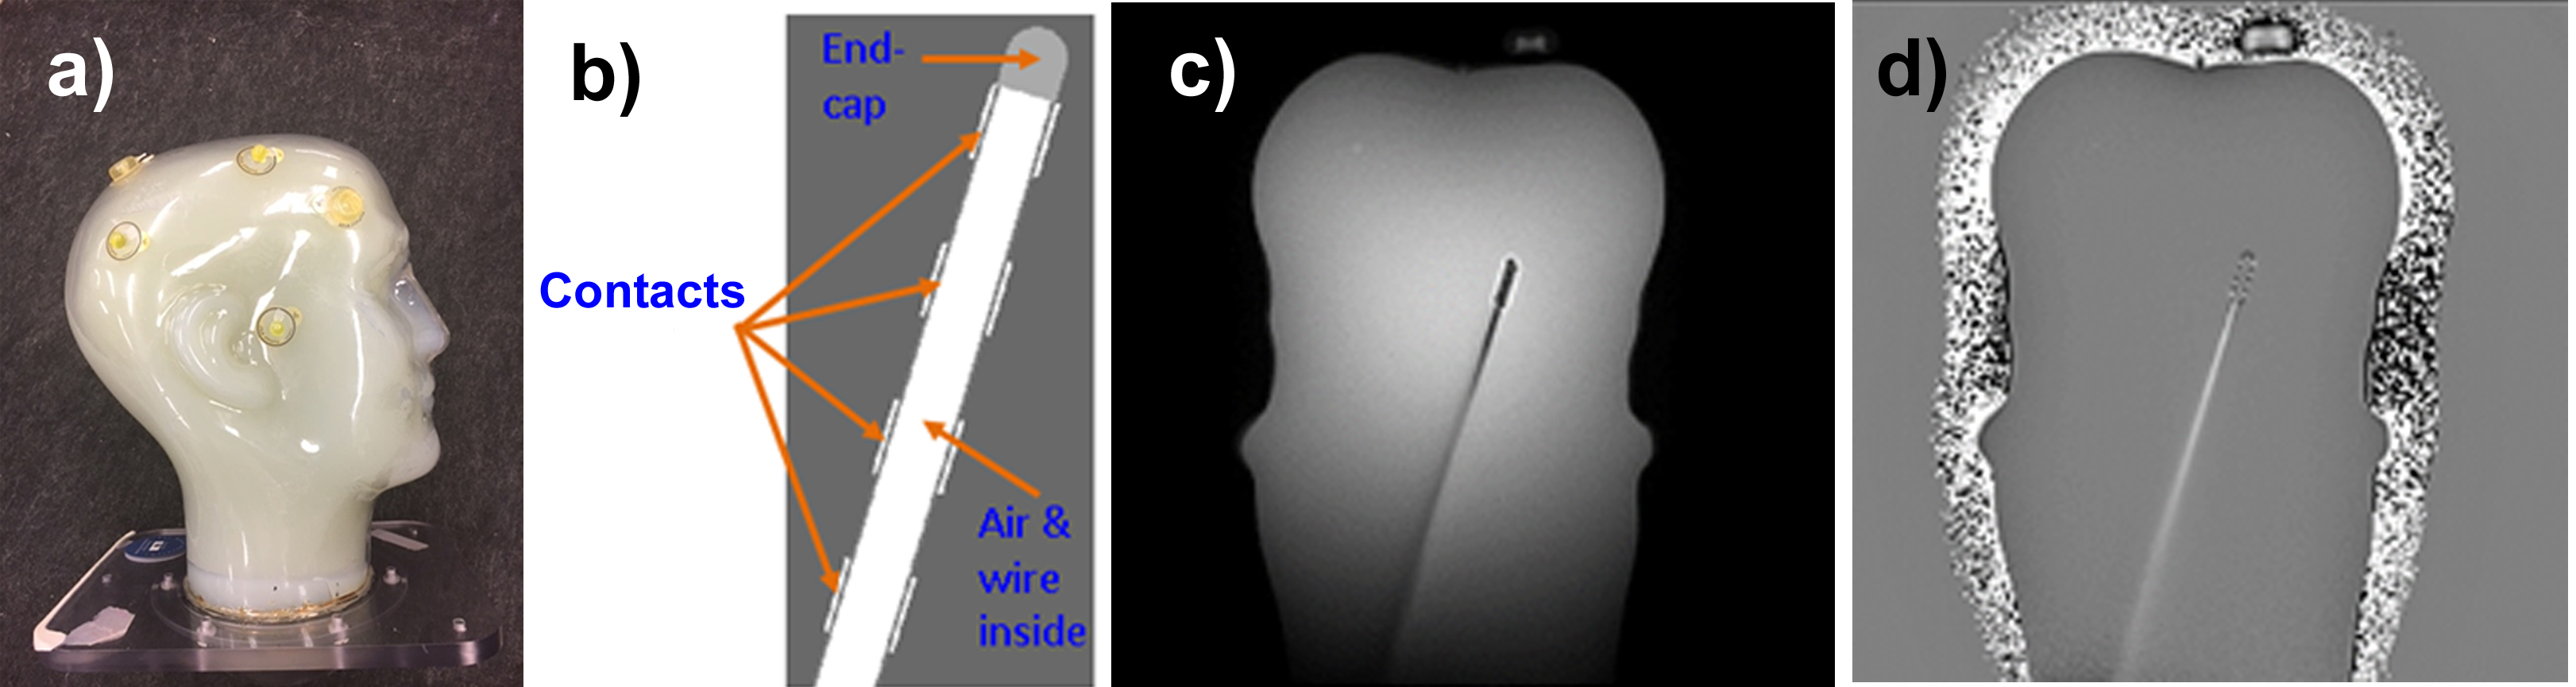
Figure 2 displays a phantom picture(a), the electrode geometry(b) and magnitude/phase phantom ZTE images(c). Note the flat contrast in ZTE[phase], only highlighting the high-susceptibility contact regions. Given the minimal TE, phase accumulation only happens during signal readout. The low susceptibility differences in vivo, in the absence of the electrode, will also render phase-contrast flat.
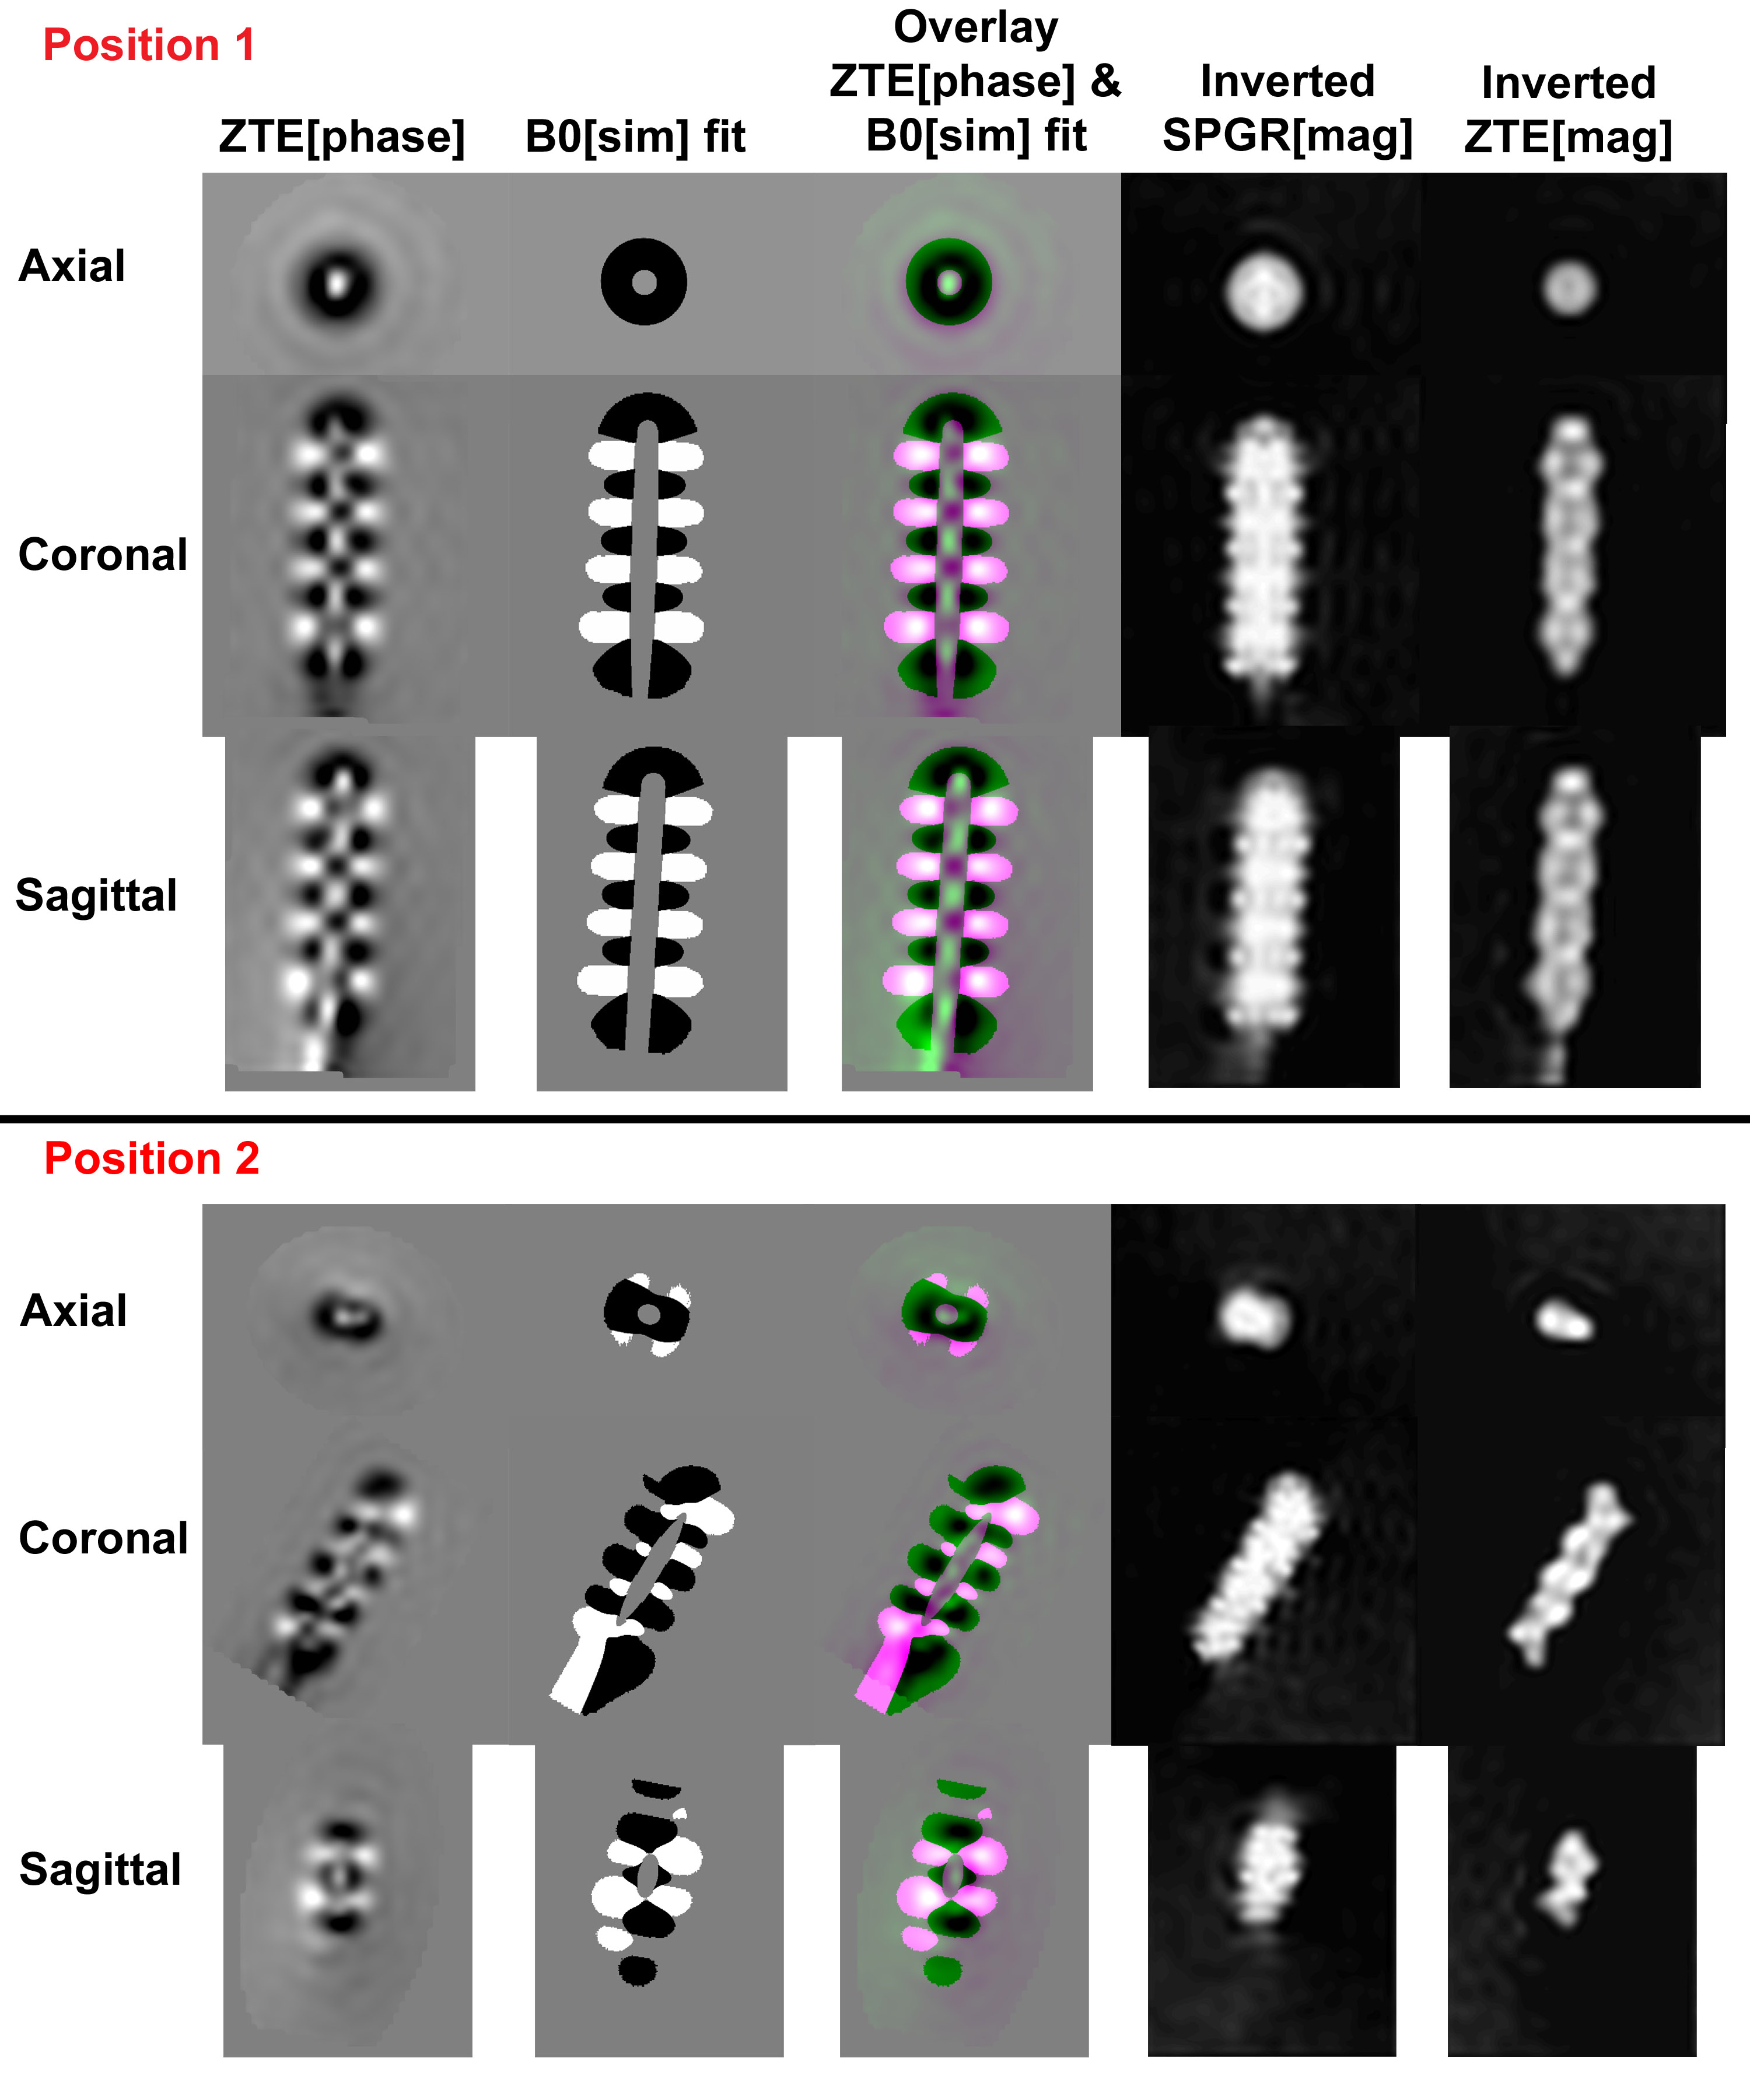
Figure 3 presents zooms of ZTE[phase] images around the electrode, the B0 simulation and the fitted overlay between the two for two phantom positions. Corresponding ZTE/SPGR magnitudes are also presented in the last 2 columns. Note the better visibility of individual contacts in the ZTE[phase], and the good match between the ZTE[phase] and the simulation.
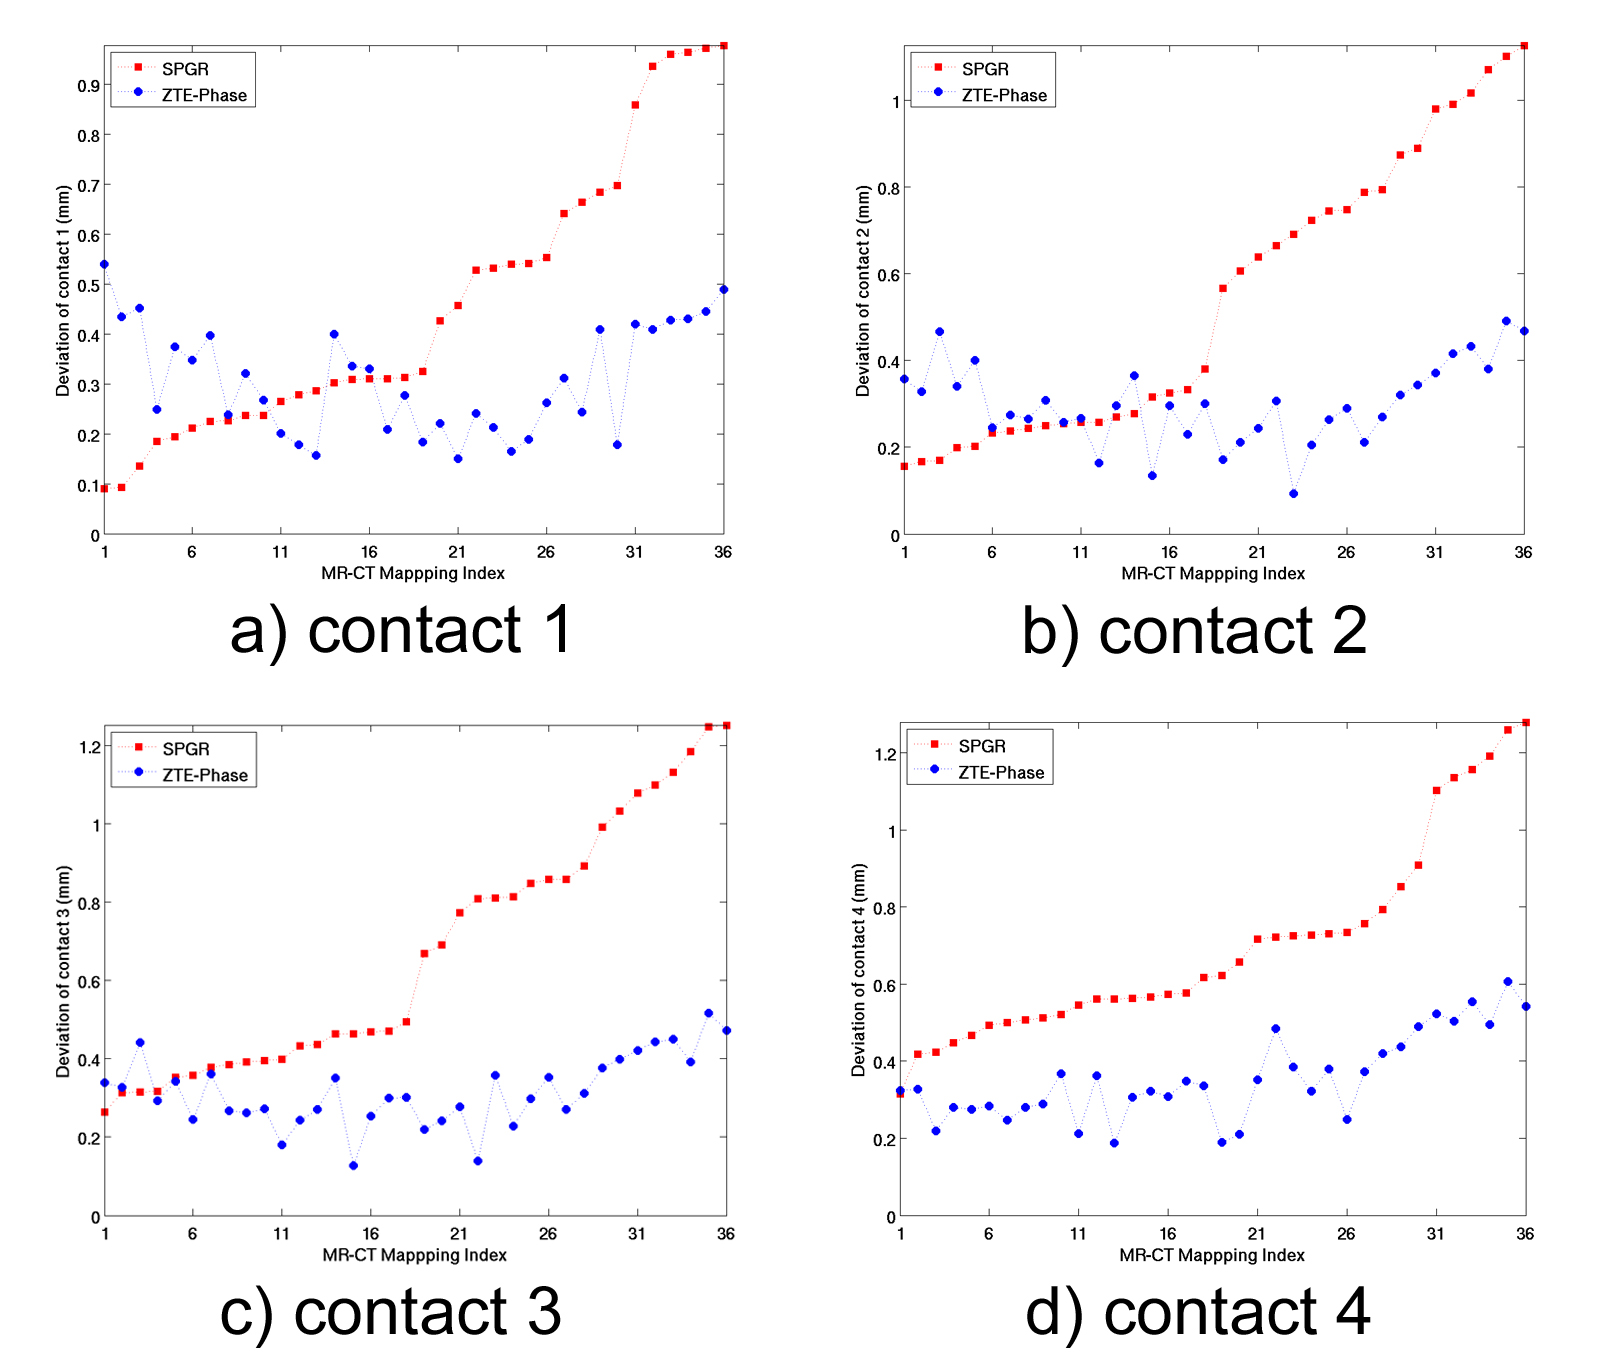
Figure 4 presents the differences in the position of the 4 contacts between SPGR-CT and ZTE-CT resulting from the 36 registration procedures.
Figure 5 summarizes the results. 1-way ANOVA indicates significantly smaller ZTE-CT differences compared to SPGR-CT (p<0.001), hence higher localization accuracy. Homogeneity of variance tests indicate smaller ZTE-CT standard deviations compared to SPGR-CT, indicating higher localization precision. While electrode localization errors can be as high as 1.49mm in SPGR, they never exceed 0.52mm in ZTE.
Discussion and Conclusion
A new ZTE-phase based approach was presented, which can visualize individual contacts in DBS implant patients. Better localization accuracy/precision in locating individual contacts is seen compared to the case of standard T1-weighted acquisitions5.Acknowledgements
No acknowledgement found.References
[1] A. Wagle Shukla, M.S. Okun, State of the Art for Deep Brain Stimulation Therapy in Movement Disorders: A Clinical and Technological Perspective, IEEE reviews in biomedical engineering, 9 (2016) 219-233.
[2] T.M. Ellis, K.D. Foote, H.H. Fernandez, A. Sudhyadhom, R.L. Rodriguez, P. Zeilman, C.E.t. Jacobson, M.S. Okun, Reoperation for suboptimal outcomes after deep brain stimulation surgery, Neurosurgery, 63 (2008) 754-760.
[3] P. Blomstedt, P. Lindvall, J. Linder, M. Olivecrona, L. Forsgren, M.I. Hariz, Reoperation after failed deep brain stimulation for essential tremor, World Neurosurg, 78 (2012) 554. E551-555.
[4] M.O. Pinsker, J. Herzog, D. Falk, J. Volkmann, G. Deuschl, M. Mehdorn, Accuracy and distortion of deep brain stimulation electrodes on postoperative MRI and CT, Zentralblatt fur Neurochirurgie, 69 (2008) 144-147.
[5] J.Y. Lee, J.W. Kim, J.Y. Lee, Y.H. Lim, C. Kim, D.G. Kim, B.S. Jeon, S.H. Paek, Is MRI a reliable tool to locate the electrode after deep brain stimulation surgery? Comparison study of CT and MRI for the localization of electrodes after DBS, Acta Neurochir, 152 (2010) 2029-2036.
[6] Madio DP, Lowe IJ, Ultra-fast imaging using low flip angles and fids, Magn Reson Med 34 (1995) 525–529.
[7] M Carl, J-T A Chiang, Investigations of the origin of phase differences seen with ultrashort TE imaging of short T2 meniscal tissue, Magn Reson Med, 67(2012), 991-1003.
[8] J. P. Marques, R. Bowtell, Application of a Fourier-based Method for Rapid Calculation of Field Inhomogeneity Due to Spatial Variation of Magnetic Susceptibility, Concepts Magn Reson, 25B (2005), 65-78.
[9] R. F. Schulte, J. Ashe, S. Ranjan, J. Prusik, J. Pilitsis, S. Hayes, A. Menini, F. Wiesinger, l. Hancu, Improved Localisation of DBS Electrodes using Pseudo-Positive Contrast from a Zero-Echo-Time Acquisition, Proc. ISMRM, 0499, 22-24 April, 2017.
Figures