2684
Motion Correction for Quantitative 3D UTE Cones Magnetization Transfer (3D UTE-Cones-MT) Imaging and 3D UTE Cones Adiabatic T1ρ (3D UTE-Cones-AdiabT1ρ) Imaging of the Knee Joint1Radiology, University of California, San Diego, San Diego, CA, United States, 2GE Healthcare, San Diego, CA, United States, 3VA San Diego Healthcare System, San Diego, CA, United States
Synopsis
Conventional T2 and T1ρ have limited values in evaluating short T2 tissues, and are affected by the magic angle effect. Ultrashort echo time (UTE) sequences can detect short T2 tissues. Magnetization transfer (MT) modeling and adiabatic T1ρ (AdiabT1ρ) seem to be insensitive to the magic angle effect. The combination of 3D UTE-Cones sequence with MT (3D UTE-Cones-MT) and AdiabT1ρ (3D UTE-Cones-AdiabT1ρ) may resolve those limitations. However, patient motion may occur during the relatively long scan time. This study aims to develop 3D UTE-Cones-MT and UTE-Cones-AdiabT1ρ with an elastix registration technique to compensate for motion during the scans.
Introduction
T2 and T1ρ are two widely investigated biomarkers for magnetic resonance (MR) imaging of osteoarthritis (OA). There are two major limitations. First, both T2 and T1ρ sequences cannot evaluate short T2 tissues such as the deep cartilage, menisci, ligaments and tendons, which are important as OA is a whole organ disease. Second, both T2 and T1ρ are highly sensitive to the magic angle effect (2). Magnetization transfer (MT) imaging and signal modeling have shown to be insensitive to collagen fiber orientation (3). More recently, T1ρ measurements using adiabatic spin-locking pulses (AdiabT1ρ) have also been shown to be less sensitive to the magic angle effect (4). Meanwhile, ultrashort echo time (UTE) sequences can detect signal from short T2 tissues. The combination of the time-efficient 3D UTE-Cones sequence with MT (3D UTE-Cones-MT) and AdiabT1ρ (3D UTE-Cones-AdiabT1ρ) may allow magic angle insensitive assessment of both short and long T2 tissues in the knee joint (5-7). However, patient motion may occur during the relatively long scan time and this adversely affects quantitative analyses. This study aims to develop 3D UTE-Cones-MT and UTE-Cones-AdiabT1ρ with an elastix registration technique to compensate for motion during the scans.Method
Cadaveric human knee specimens and volunteer studies were performed on a 3T MR750 scanner (GE Healthcare). An 8-channel knee coil was used for signal excitation and reception. The 3D UTE-MT data were acquired with TR=100 ms, TE=32 µs, flip angle=7°, FOV=14 cm, slice thickness=3 mm, readout=256×256, 32 slices; number of spokes per MT preparation (Nsp) = 9, three powers (500°, 1000°, 1500°) and five MT frequency offsets (2, 5, 10, 20 and 50 kHz), with scan time of 58 seconds per acquisition. UTE-MT modeling was performed to calculate macromolecular proton fraction f, T2m, RM0m and R1w. 3D UTE-Cones- AdiabT1ρ data were acquired with TR=500 ms, FOV=15×15×10.8 cm3, bandwidth=166 kHz, FA=10°, matrix=256×256×36, Nsp=25, number of adiabatic inversion pulses NIR=0,2,4,6,8,12 and 16 each with a scan time of 2 min 34 sec. B1 mapping was performed with UTE-Cones actual flip angle imaging with TR1/TR2=20/100 ms, FA=45°, matrix=128×128×8, with scan time of 4 min 57 sec. B1 corrected T1 was performed using a UTE-Cones variable flip angle technique with TR=20 ms, FA=5°,10°,20° and 30°, matrix=256×256×36, scan time of 9 min 28 sec. Both 3D UTE-Cones-MT and UTE-Cones- AdiabT1ρ data were acquired before and after a series of translational and rotational motion. MT modeling and AdiabT1r fitting were performed on the 3D UTE datasets before and after elastix motion registration, and the fitting values were compared.
The elastix motion registration is based on Insight Segmentation and Registration Toolkit (ITK). The software consists of a collection of algorithms that are commonly used to solve (medical) image registration problems. Both rigid (Euler) and non-rigid (B-spline) were applied to register the images. Fitting values before and after motion correction were compared.
Results and Discussion
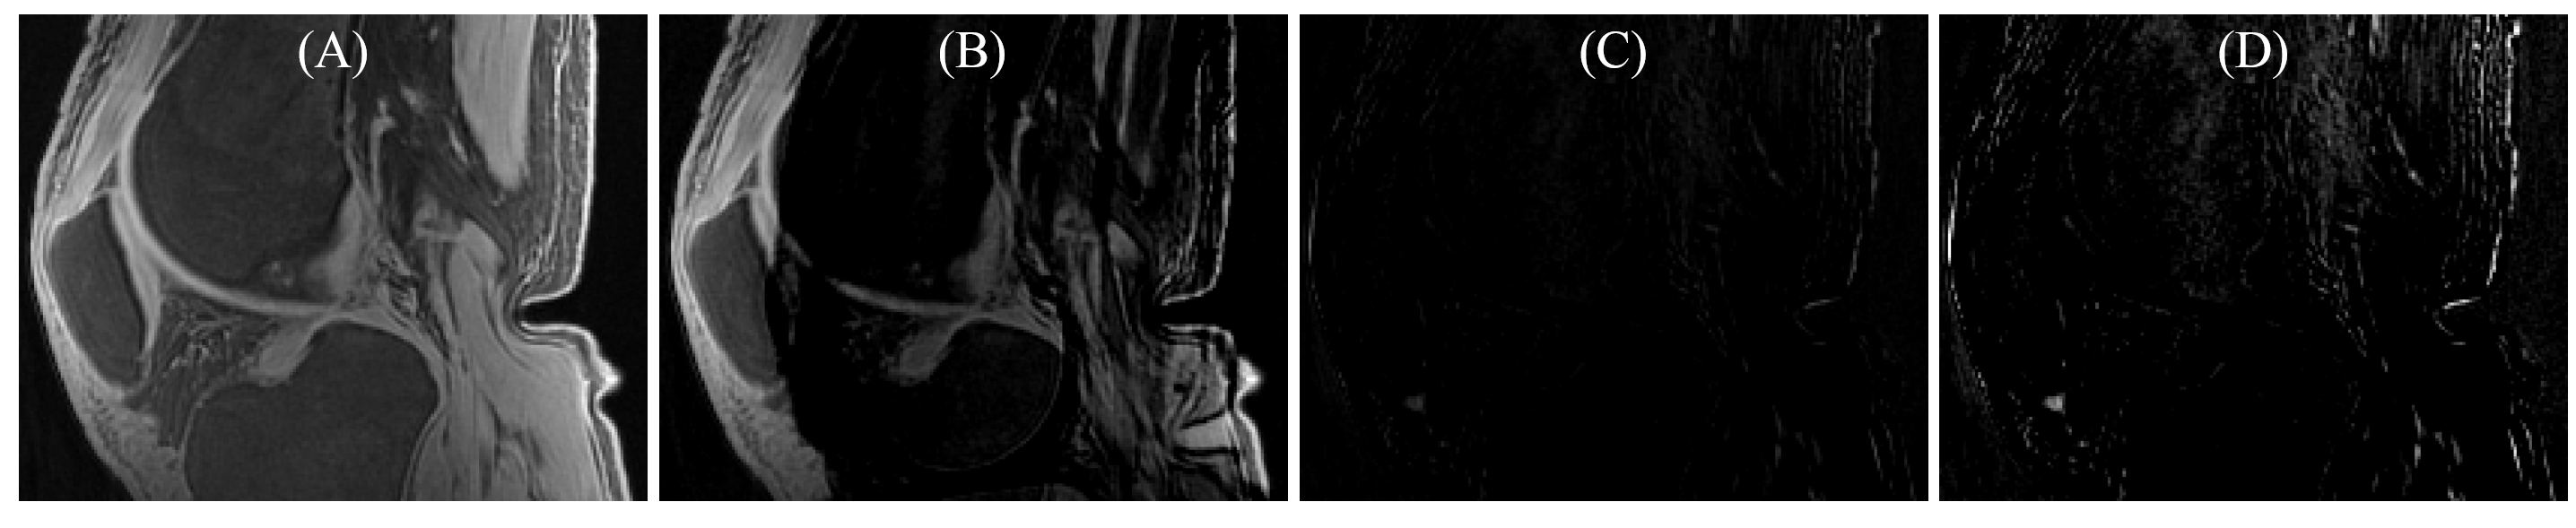
Figure 1 shows the efficiency of the elastix motion correction algorithm on 3D UTE-Cones- AdiabT1ρ imaging of a cadaveric knee joint. Perfect registration was achieved as demonstrated by the near noise level in the difference image.
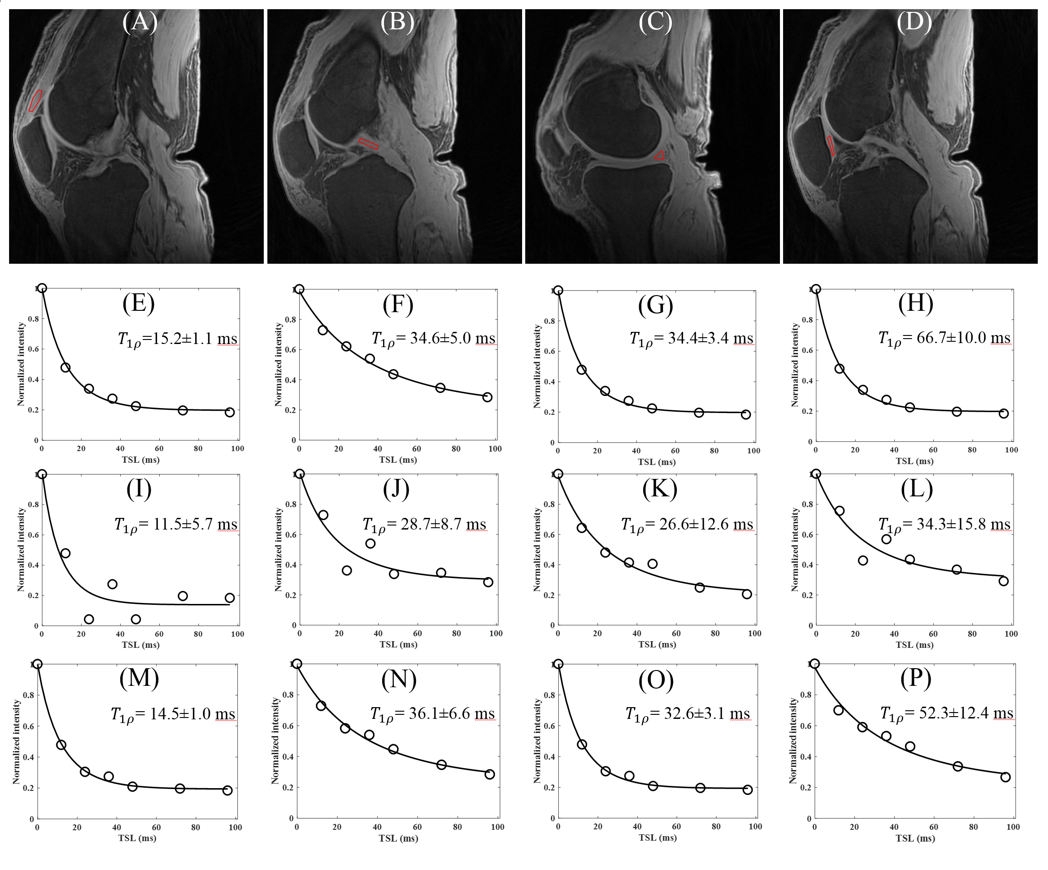
Figure 2 shows AdiabT1ρ fitting of patella tendon before and after motion. Excellent AdiabT1ρ fitting was achieved demonstrating a T1ρ of 15.2±1.1 ms for the patella tendon, 34.6±5.0 ms for the PCL, 34.4±3.4 ms for the meniscus and 66.7±10.0 ms for the patellar cartilage. Poor fitting was achieved with motion. After elastix motion registration, very similar AdiabT1ρ values were achieved for the patella tendon (AdiabT1ρ=14.5±1.0 ms), the PCL (AdiabT1ρ=36.1±6.6 ms), the meniscus (AdiabT1ρ=32.6±3.1 ms) and the patellar cartilage (AdiabT1ρ=52.3±12.4 ms) when compared to the still condition.
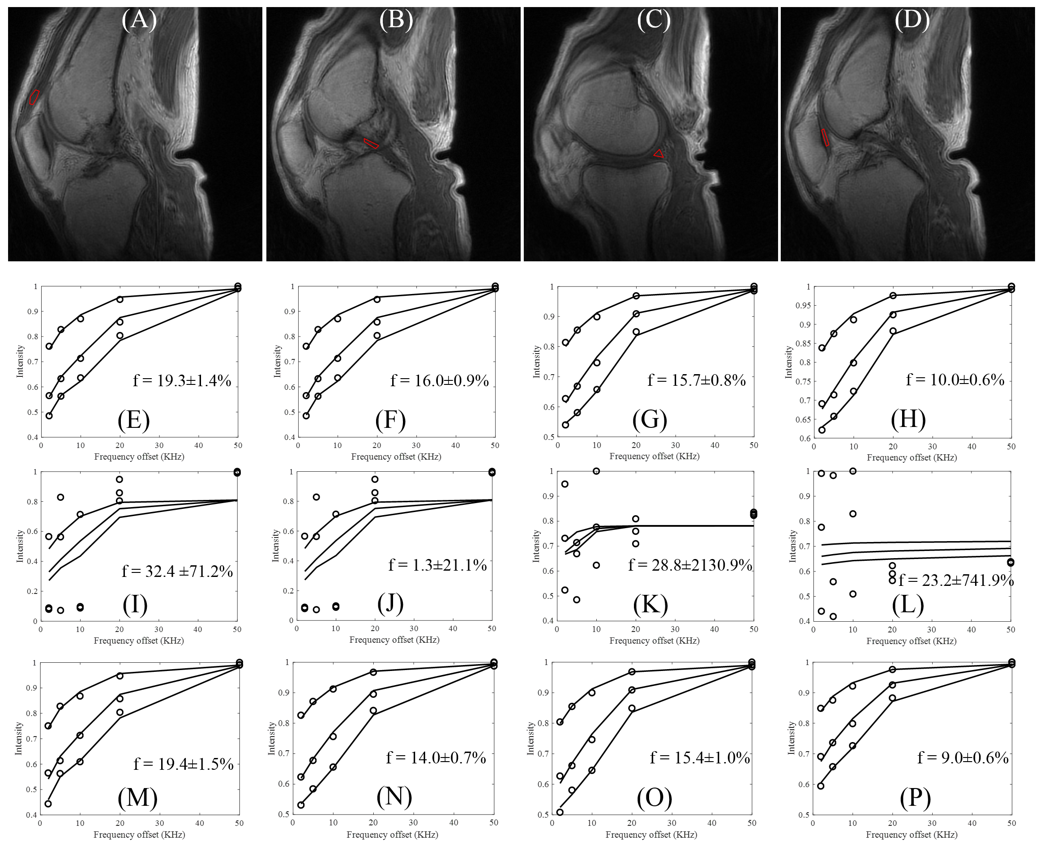
Figure 3 shows 3D UTE-Cones-MT modeling before and after motion. Excellent MT modeling was achieved for the patella tendon (f=19.3±1.4 %), the PCL (f=16.0±0.9 %), the meniscus (f=15.7±0.8 %) and the patellar cartilage (f=10.0±0.6 %). Poor fitting was achieved with motion. After elastix motion registration, very similar macromolecular fractions were achieved for the patella tendon (f=19.4±1.5 %), the PCL (f=14.0±0.7 %), the meniscus (f=15.4±1.0 %) and the patellar cartilage (f=9.0±0.6 %) when compared with the still condition.
Conclusion
The 3D UTE-Cones-MT and UTE-Cones- AdiabT1ρ techniques together with elastix motion correction provide robust volumetric measurement of macromolecular fractions and AdiabT1ρ of both short and long T2 tissues in the knee joint. These magic angle insensitive biomarkers are likely to greatly increase the sensitivity and specificity in early diagnosis and treatment monitoring of OA.Acknowledgements
The authors acknowledge grant support from NIH (1R01 AR062581-01A1, 1 R01 AR068987-01) and the VA Clinical Science R&D Service (Merit Award I01CX001388).References
1. Duvvuri U, Reddy R, Patel SD, Kaufman JH, Kneeland JB, Leigh JS. T1rho-relaxation in articular cartilage: Effects of enzymatic degradation. Magn Reson Med 1997;38:863-867.
2. Shao H, Pauli C, Li S, Ma Y, Tadros AS, Kavanaugh A, Chang EY, Tang G, Du J. Magic angle efect plays a major role in both T1rho and T2 relaxation in articular cartilage. Osteoarthritis Cartilage 2017;doi:10.1016/j.joca.2017.01.013.
3. Ma Y, Shao H, Du J, Chang EY. Ultrashort Echo Time Magnetization Transfer (UTE-MT) Imaging and Modeling: Magic Angle Independent Biomarkers of Tissue Properties. NMR Biomed 2016; 29:1546-1552.
4. Hänninen N, Rautiainen J, Rieppo L, Saarakkala S, Nissi MJ. Orientation anisotropy of quantitative MRI relaxation parameters in ordered tissue. Scientific Reports 2017;doi: 10.1038/s41598-017-10053-2.
5. Carl M, Bydder GM, Du J. UTE imaging with simultaneous water and fat signal suppression using a time-efficient multispoke inversion recovery pulse sequence. Magn Reson Med 2016;76:577–582.
6. Ma YJ, Chang EY, Carl M, Du J. Quantitative magnetization transfer ultrashort echo time imaging using a time-efficient 3D multispoke Cones sequence. Magn Reson Med 2017;doi:10.1002/mrm.26716.
7. Ma Y, Lu X, Carl M, Zhu Y, Chang EY, Du J. Accurate T1 mapping for Short T2 Tissues using 3D Ultrashort Echo Time Cones Actual Flip Angle-Variable TR Method. ISMRM Workshop: Advanced Musculoskeletal MRI: Arthritis & Beyond 2017, Hangzhou, China.
Figures