2676
T2 Mapping Using ZTE Combined with Burst Encoding (BURZTE)1GE Healthcare, Munich, Germany
Synopsis
ZTE acquisition is combined with spin-echo burst encoding for quiet T2 mapping. An initial ZTE excitation train encodes multiple 3D radial spokes, which get refocused by reversing the gradients. A double spin-echo leads to T2 decay, from which T2 maps are extracted by exponential fitting. Accuracy is validated in the Eurospin TO5 relaxation phantom, while in vivo feasibility is demonstrated by T2 mapping in healthy brains.
Introduction
Burst imaging enables relatively rapid and silent encoding in MRI via encoding multiple k-space lines with a train of short and evenly-spaced RF block pulses [1,2]. Another silent acquisition method is ZTE [3,4,5], where the object is encoded with 3D radial trajectories, ramping the gradients already before the RF pulse and updating them with slow, hence silent switching from one spoke to the next one. In this work, ZTE is combined with spin-echo burst encoding for quiet T2 mapping.Methods
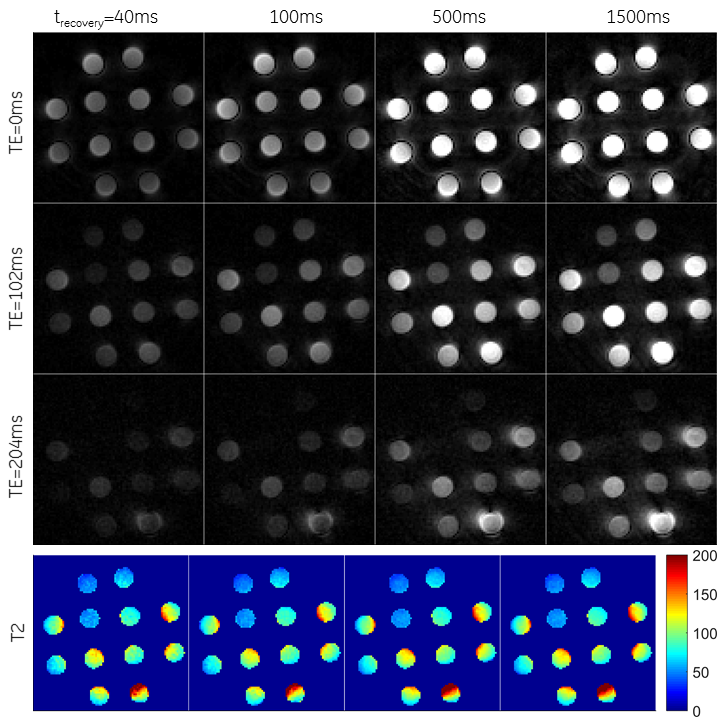
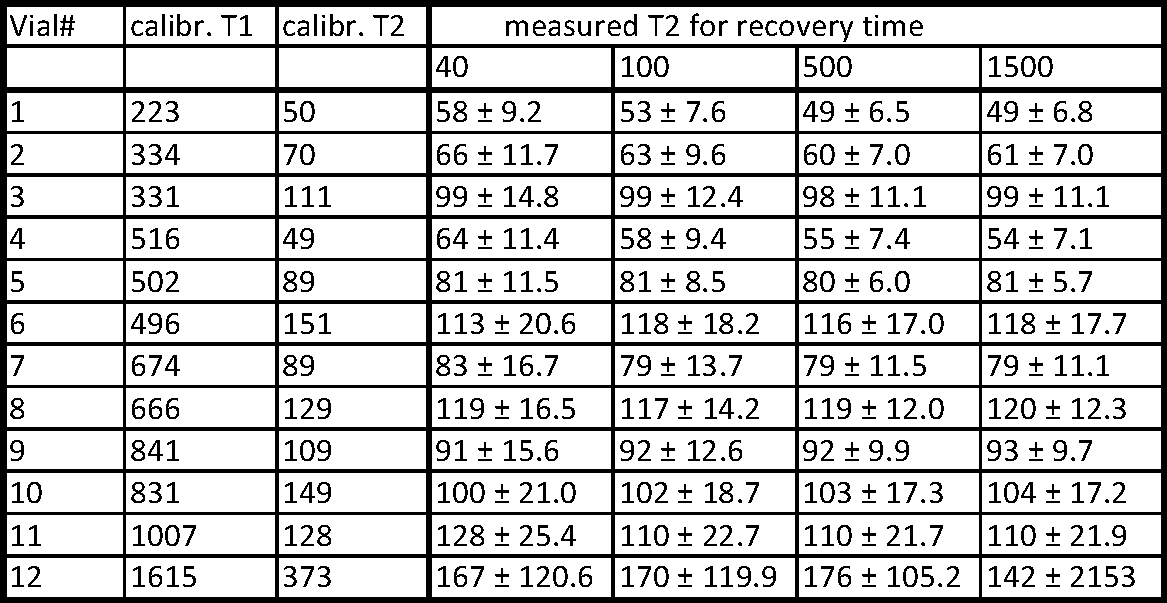
Burst encoding was implemented into a ZTE sequence by reversing the gradients, switching off the RF pulses during the burst acquisition part and repeating the same gradient trajectories. A double spin-echo module was included for T2 mapping using optimal adiabatic pulses [6]. The pulse sequence, named T2-BURZTE (Fig.1), was implemented on a GE MR750w scanner. Data is reconstructed automatically on the scanner using standard 3D gridding and FFT. T2 maps were extracted by fitting the images of three echo times to an exponential decay. Accuracy was investigated in a reference relaxation-phantom, consisting of 12 different vials with different T1 and T2 relaxation times [7]. Each vial was segmented using region growing, leading to 12 3D masks each containing approximately 2500 voxels. In vivo feasibility was demonstrated by imaging the brain of healthy volunteers.Results and Discussion
Accurate T2 mapping is possible with T2-BURZTE, as demonstrated in the reference relaxation phantom (Figs.2 and 3). The impact of different T1 times is relatively small, because of fitting the three echo times, hence reducing the impact of initial magnetisation. The main impact of long T1 times on the T2 estimation is a decrease in SNR, hence reduced accuracy.
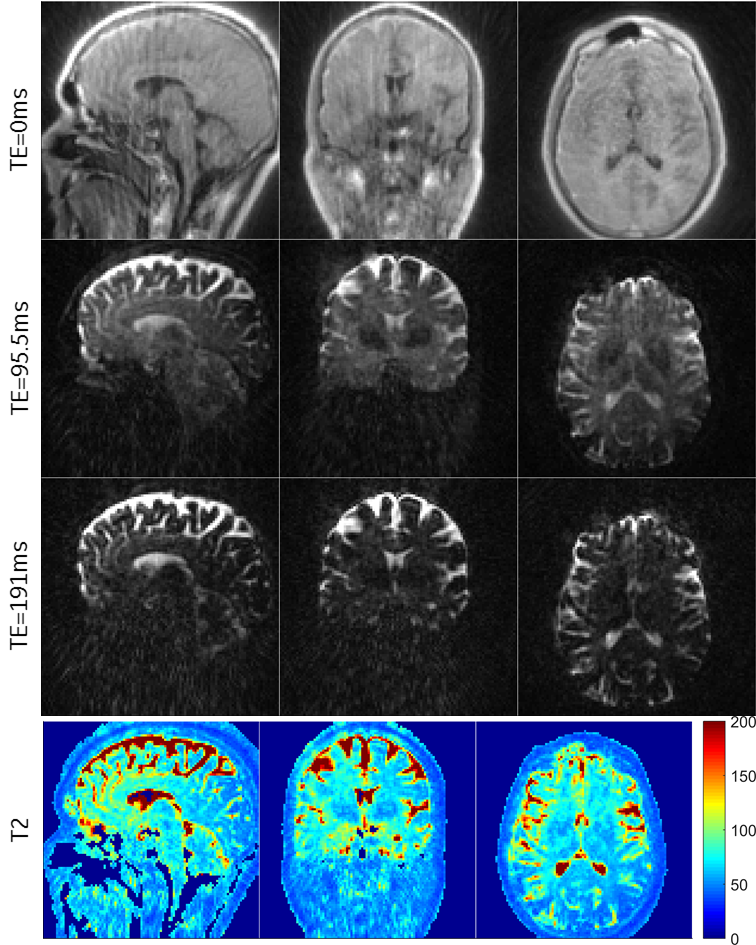
Brain scans with two different resolutions (2mm)3 and (1.7mm)3 are shown in Figs.4 and 5, respectively. A main limitation of T2-BURZTE in vivo is SNR, hence a relatively large flip angle of 5° was chosen with recovery times of 250ms and 200ms, respectively. The resulting acquisition times increase rapidly with 3D isotropic encoding, because the number of spokes is proportional to the squared matrix size and because of the required waiting times for double spin-echo and recovery at the end.
The power deposition (SAR) is limited because of choosing an optimal adiabatic pulse obeying both constant adiabaticity and offset independent adiabaticity with a small sweep width (500Hz) and flip angle (integral of 400° under magnitude), hence making this sequence a good candidate for T2 mapping also at higher fields (7T).
Burst encoding never made it into the clinic [2], mainly because of SNR limitations and calibration requirements. The SNR is improved considerably by a full 3D-encoding, while the fully compensated gradient trajectory and the double spin-echo removes unknown phases, hence obviating the need for any calibration. This novel T2 mapping method might enable more quantitative and comparable imaging approaches in MRI, as compared to standard T2 weighted imaging.
Acknowledgements
No acknowledgement found.References
- Burst imaging. Hennig J, Hodapp M. MAGMA. 1993; 1:39-48.
- Burst imaging—Can it ever be useful in the clinic? Doran SJ, Bourgeois ME, Leach MO. Concepts Magn Reson Part A. 2005; 26A(1):11-34.
- Fast imaging in liquids and solids with the back-projection low angle shot (BLAST) technique. Hafner S. Magn Reson Imaging 1994;12:1047-1051.
- Ultra-fast imaging using low flip angles and fids. Madio DP, Lowe IJ. Magn Reson Med 1995;34:525–529.
- Density of organic matrix of native mineralized bone measured by water- and fat-suppressed proton projection MRI. Wu Y, Ackerman JL, Chesler DA, Graham L, Wang Y, Glimcher MJ. Magn Reson Med. 2003;50:59-68.
- Design of a constant adiabaticity pulse for selective population inversion. Mitschang L, Ittermann B, Schubert F, Rinneberg H. J Magn Reson 2004;168:103-109.
- Eurospin Test Object 5. http://www.diagnosticsonar.com/mritext.html
Figures