2668
Rapid dynamic contrast-enhanced MRI for small animals at 7T using 3D UTE-GRASP1Center for Biomedical Imaging (CBI), Center for Advanced Imaging Innovation and Research (CAI2R), New York University School of Medicine, New York, NY, United States
Synopsis
It remains challenging to achieve simultaneous high spatial isotropic resolution and high temporal resolution in dynamic contrast enhanced (DCE) MRI of small animals, due to the relatively low signal to noise ratio (SNR) from small voxels. The purpose of this study is to develop a highly accelerated, high-spatial and high-temporal resolution DCE-MRI method for small animal imaging at 7T using 3D ultrashort echo time (UTE) golden-angle radial sampling with a combined compressed sensing and parallel imaging approach based on the GRASP technique. Our preliminary results demonstrate that the proposed UTE-GRASP method has the potential to improve both spatial and temporal resolution.
Purpose
T1-weighted dynamic contrast enhanced (DCE) MRI has been widely used to assess tissue microenvironment of cancer as well as various inflammatory diseases (1). However, the potential of DCE-MRI is often not fully utilized for routine clinical scans as well as preclinical scans due to limitations in signal to noise ratio (SNR) and imaging speed. In small animal imaging, a low SNR with a relatively small voxel size makes it difficult to acquire dynamic MRI data with a high spatial and high temporal resolution. The purpose of this study is to develop a highly accelerated, high-spatial and high-temporal resolution DCE-MRI method, which extends the previously proposed GRASP technique (2) to small animal imaging applications by using ultrashot echo times and isotropic 3D coverage at 7T.Methods
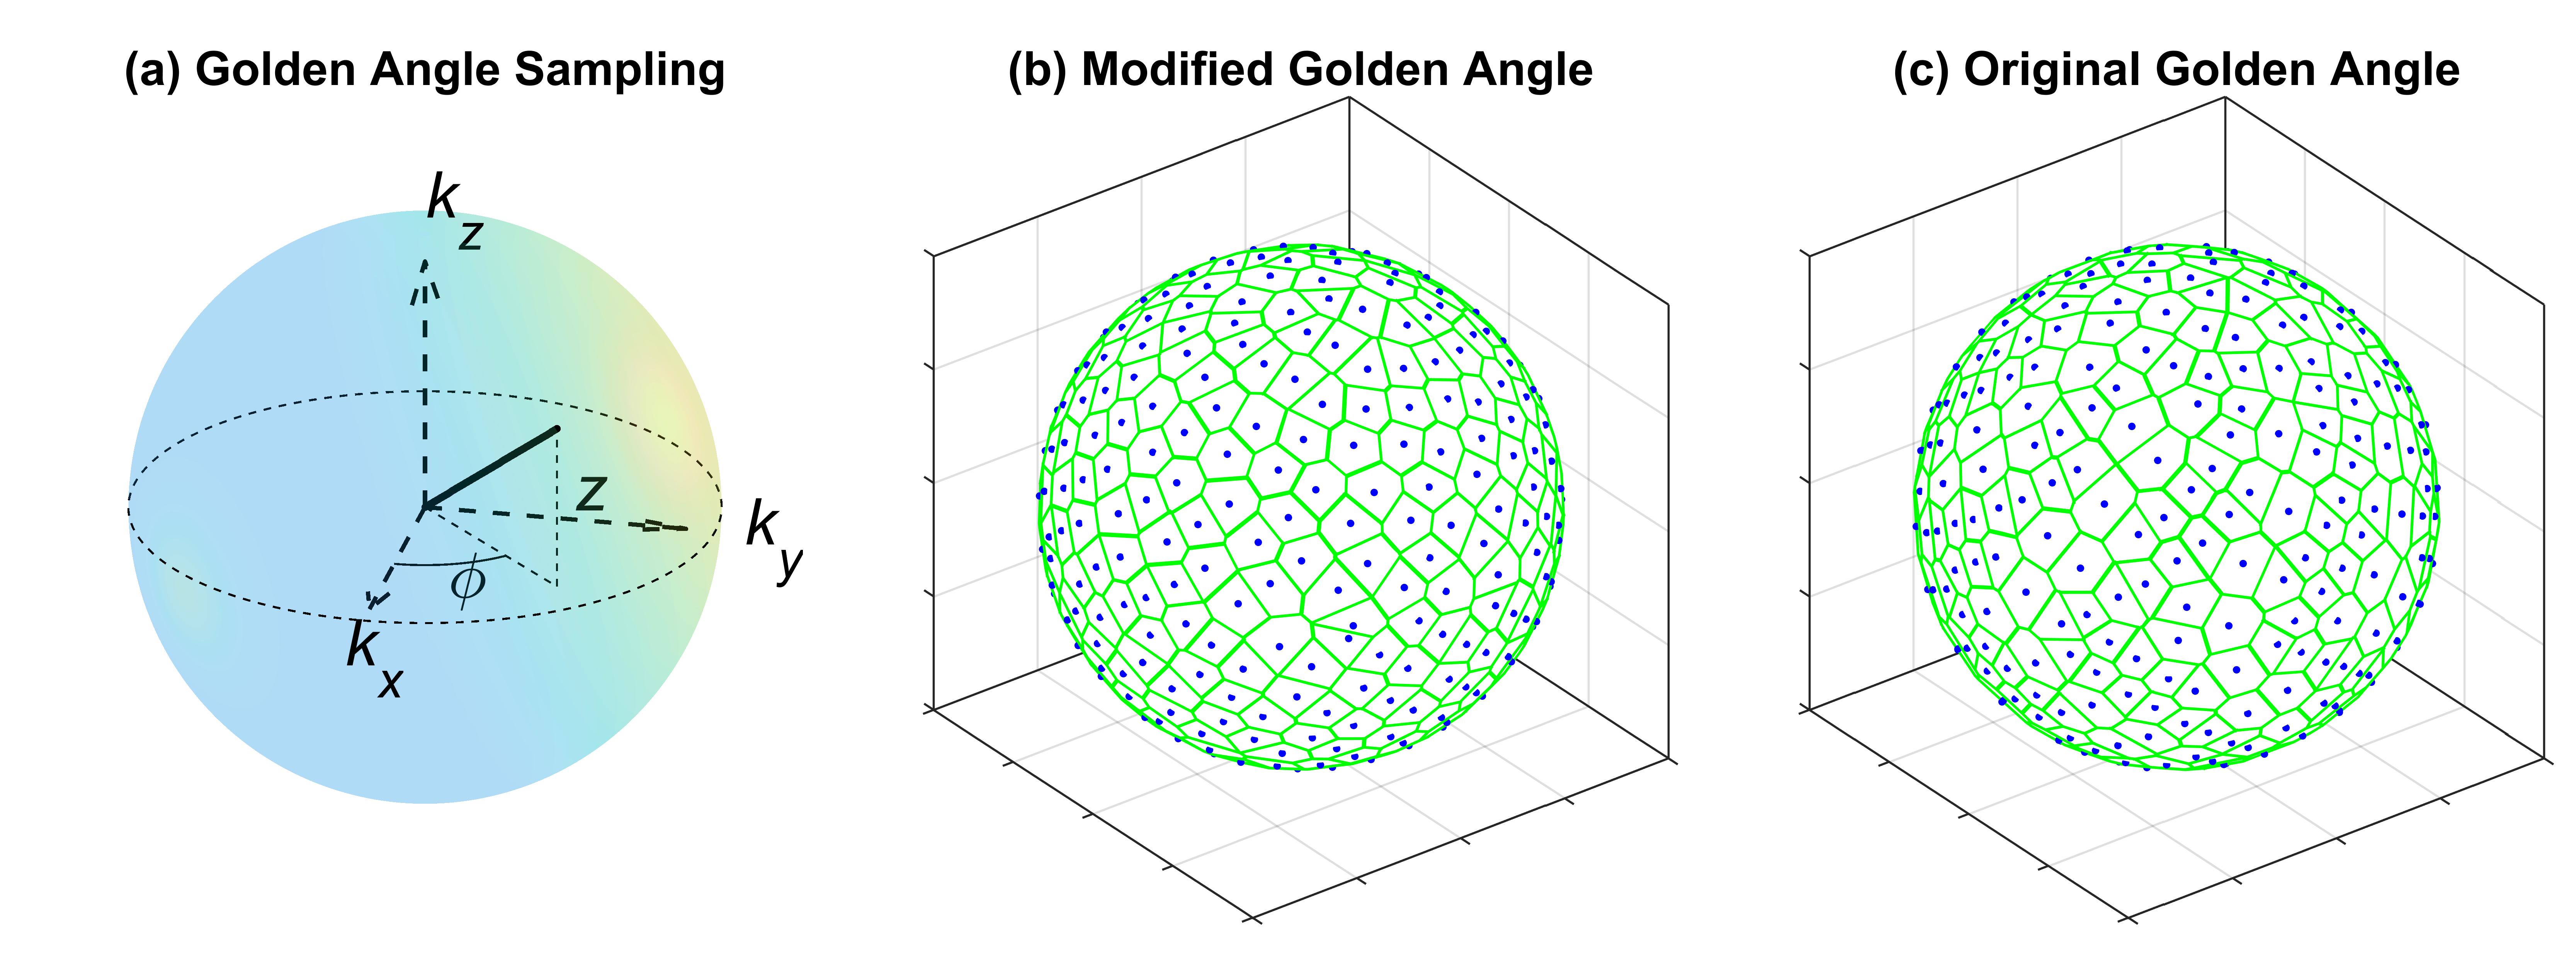
A 3D UTE pulse sequence was used to achieve an isotropic spatial resolution and to minimize the T2* effect. As shown in Fig.1, a 3D golden-angle sampling with center-out radial readouts was implemented using a 2D golden angle approach, A=0.6823 and B=0.4656, that were suggested by Hahn et al (3). The 3D space was filled by increasing the azimuth angle (Φ), Φm=2πmA and projection direction length in kz direction (Z), with Z being modules one of mB, where m=1, 2, …, NProj (the number of radial spokes). Note that we alternated the read-out spoke direction between the upper and lower hemisphere. This scheme approximately filled the 3D space uniformly as shown in Fig.1b which is comparable to the 3D golden-angle method with full radial readouts (Fig.1c). The joint compressed sensing and parallel imaging reconstruction was implemented based on the GRASP algorithm (2) by enforcing data consistency with the SENSE model and sparsity in the temporal finite difference domain. The regularization parameter λ weights the contribution of the sparsity term relative to SENSE data consistency term.
Data Acquisition: Six to eight-week-old C57BL6 mice (n=3) with GL261 mouse glioma models were used for this study. MRI experiments were performed on a Bruker 7T micro-MRI system, with 1H four-channel phased array receive-only MRI CryoProbe. DCE-MRI acquisition was performed using the 3D UTE sequence with a 3D golden-angle sampling as described above. Scan parameters were TR/TE=4/0.008 ms, image matrix = 128x128x128, and field of view = 25x25x25 mm. The spatial resolution was 0.195x0.195x0.195 mm. The 3D UTE sequence was continuously run to acquire 102,712 spokes with flip angle 8.3 degree for 6 minutes and 51 seconds. A bolus of Gd-DTPA in saline at the standard dose of 0.1 mmol/kg was injected through a tail vein catheter, starting 30 seconds after the acquisition of pre-contrast images. The mice were treated in strict accordance with the National Institutes of Health Guide for the Care and Use of Laboratory Animals, and this study was approved by the Institutional Animal Care and Use Committee.
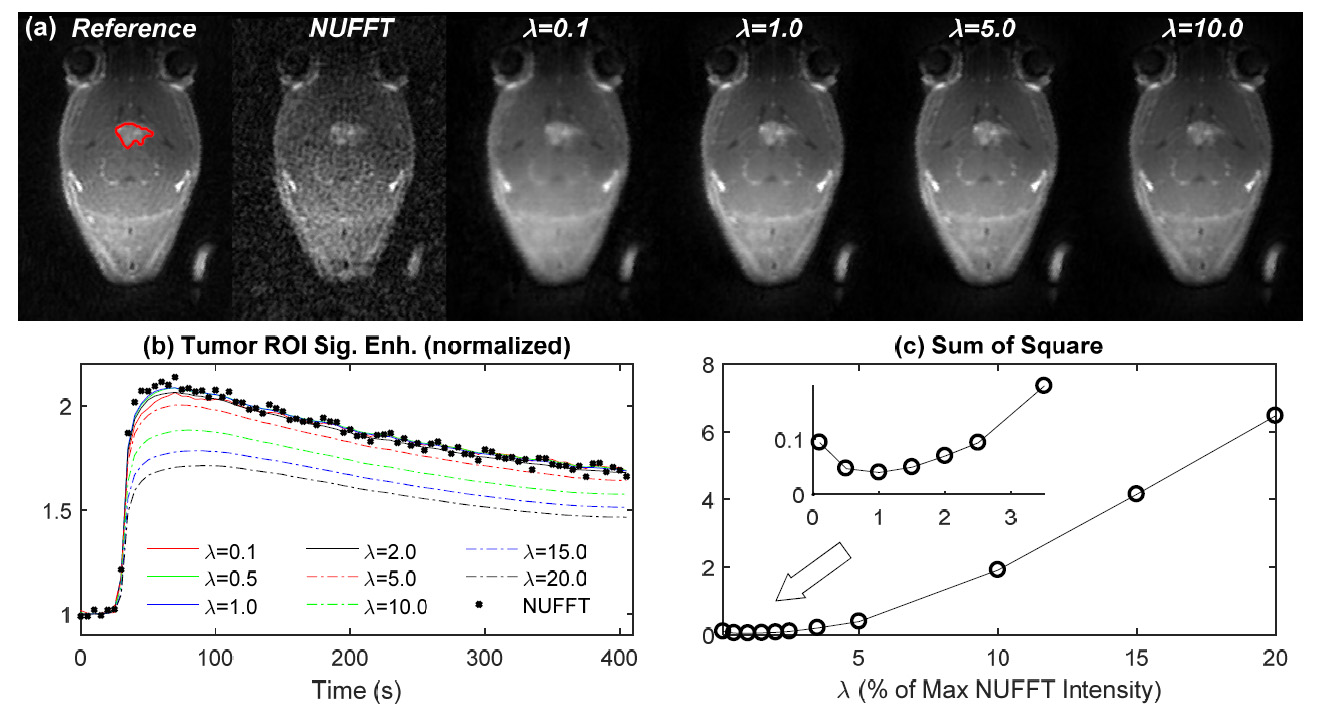
Image Reconstruction: The targeted temporal resolution was T=5 s/frame (82 frames with 1,250 spokes/frame). Non-Uniform Fast Fourier Transform (NUFFT) was employed as standard reconstruction to initialize the GRASP reconstruction. NUFFT reconstruction of 38,750 post-contrast spokes (50 s~ 205 s) was used as a reference to select the regularization parameter λ. Different λ (0.1%~20% of the maximum intensity in the FFT reconstruction) reconstructions were shown in Fig.2a. General kinetics model (4) was implemented for DCE-MRI pharmacokinetic model analysis with arterial input function (AIF) measured from an artery. T1 was assumed to be 2.3 s for tumor and 1.6 s for all other tissues. The image reconstructions and DCE-MRI data analysis were carried out by High Performance Computing (HPC) cluster from New York University, with Graphic Computer Unit (GPU) support.
Results
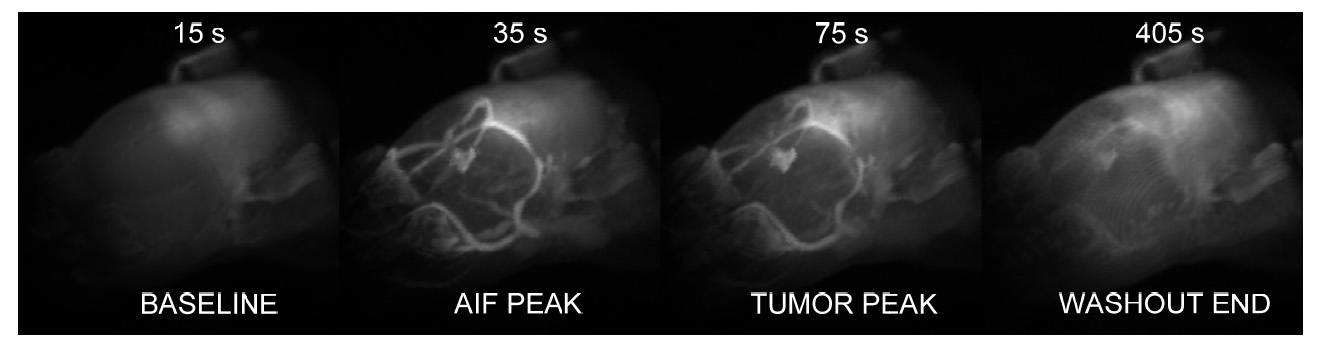
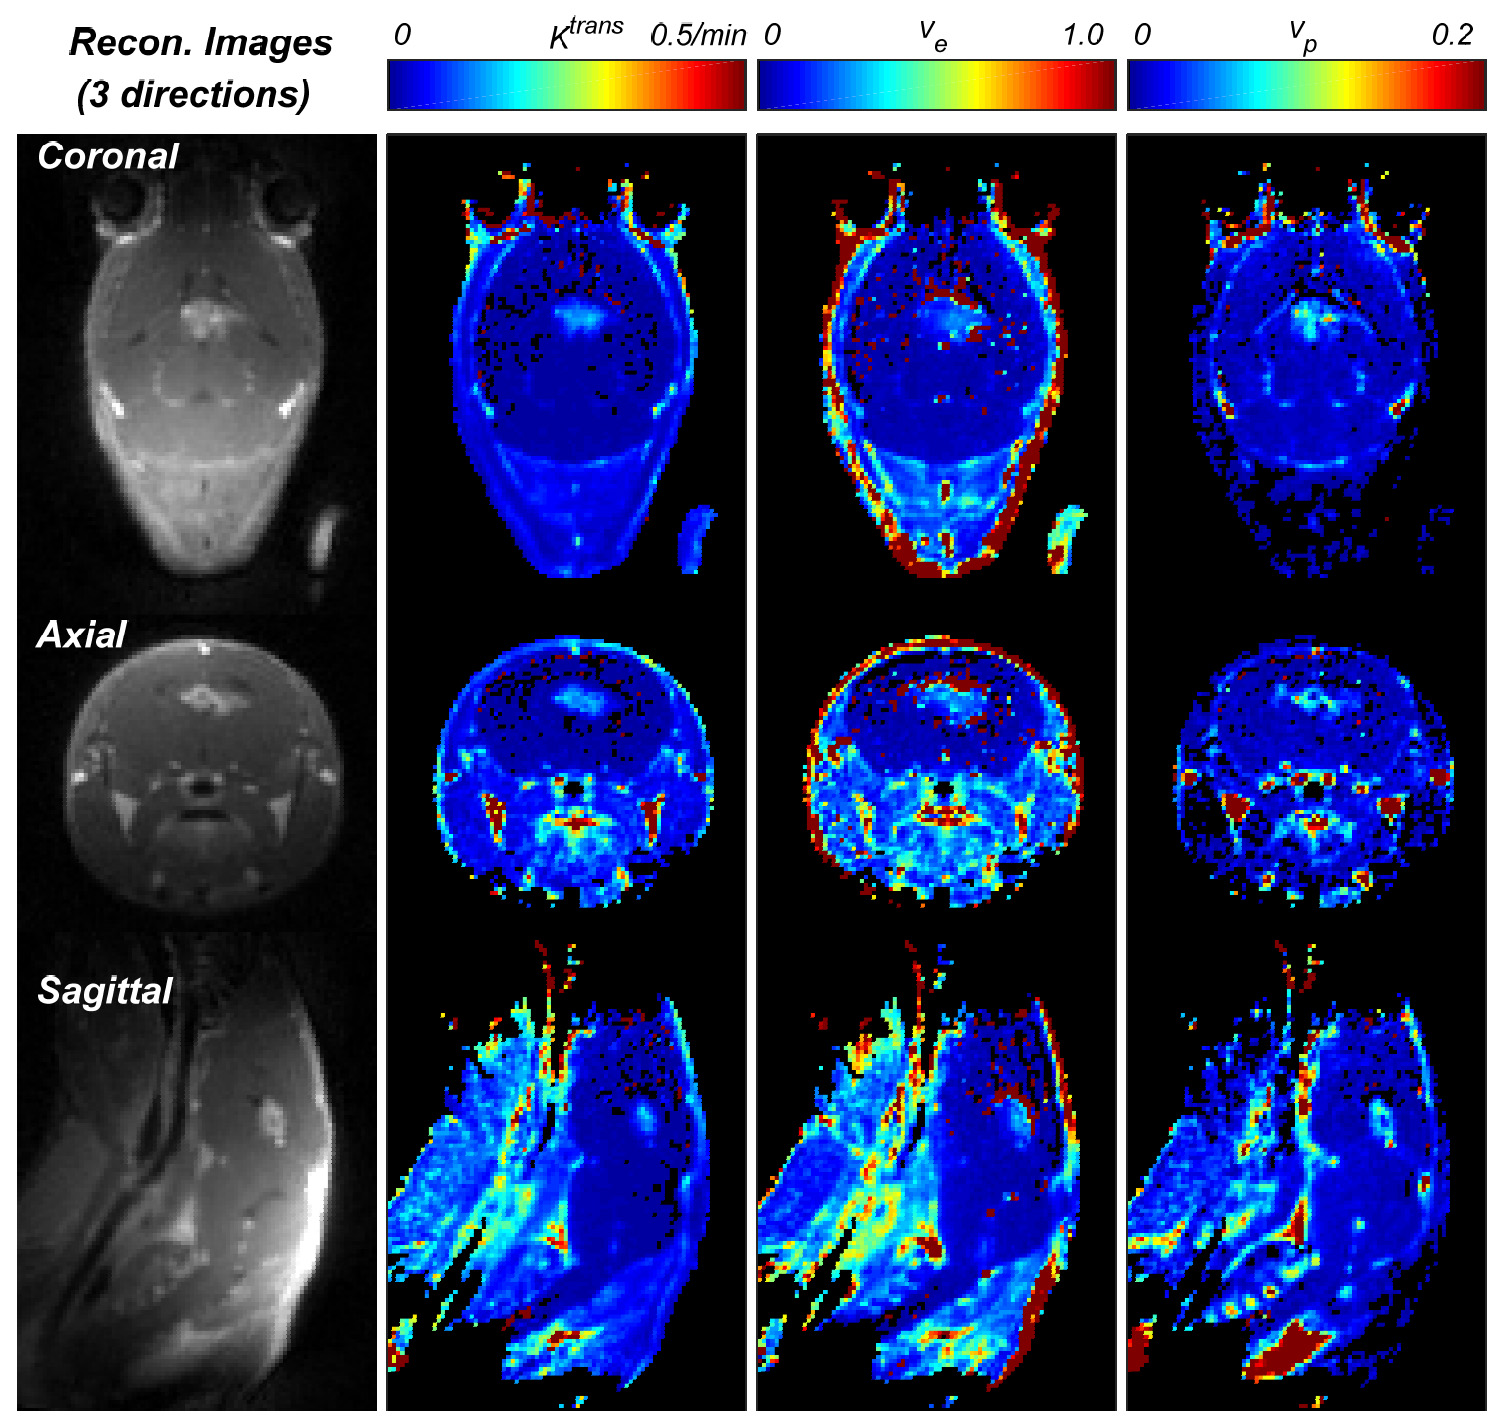
Based on the comparison of contrast enhancement curves of the tumor (Fig.2b and 2c), it was found that λ=1 has the minimum difference with the curve from the NUFFT images. The 3D-UTE-GRASP dynamic images allowed monitoring of the vascular delivery of the contrast agent as shown in Fig.3. It was also feasible to use the high-temporal and high-spatial resolution data for quantitative pharmacokinetic analysis to show the 3D maps of physiologically relevant kinetic parameters (Fig.4). The results from all the three animals show consistent results.Discussion and Conclusion
The proposed 3D-UTE-GRASP DCE-MRI method can be used to acquire DCE-MRI data with isotropic spatial resolution of 0.195 mm and temporal resolution of 5 seconds for small animal imaging at high magnetic fields with minimal T2* effects. The flexibility of the image reconstruction method allows choosing a temporal resolution after the data acquisition. In contrast to the conventional DCE-MRI method which typically has about 1 mm thick slices, the proposed 3D-UTE-GRASP method with an isotropic resolution of about 0.2 mm can be used to better assess the 3D heterogeneity of a tumor.Acknowledgements
NIH 1 R01 CA160620 / NIH P41 EB017183References
- Ingrisch M, Sourbron S, Morhard D, Ertl-Wagner B, Kumpfel T, Hohlfeld R, Reiser M, Glaser C. Quantification of perfusion and permeability in multiple sclerosis: dynamic contrast-enhanced MRI in 3D at 3T. Investigative radiology 2012;47(4):252-258.
- Feng L, Grimm R, Block KT, Chandarana H, Kim S, Xu J, Axel L, Sodickson DK, Otazo R. Golden-angle radial sparse parallel MRI: combination of compressed sensing, parallel imaging, and golden-angle radial sampling for fast and flexible dynamic volumetric MRI. Magn Reson Med 2014;72(3):707-717.
- Hahn T, Kozerke S, Schwizer W, Fried M, Boesiger P, Steingoetter
A. 19F MR imaging golden angle-based capsule tracking for intestinal transit
and catheter tracking: initial in vivo experience. Radiology
2012;265(3):917-925.
- Tofts PS, Brix G, Buckley DL, et al. Estimating kinetic parameters from dynamic contrast-enhanced T1-weighted MRI of a diffusable tracer: standardized quantities and symbols. J Magn Reson Imaging 1999;10(3):223-232.4.
Figures