2655
Artifact Detection Using Correlation Analyses Applied to MEGA-PRESS Data Containing Subject Head Movements1Department of Radiation Physics, and Department of Medical and Health Sciences, Linköping University, Linköping, Sweden, 2Center for Medical Image Science and Visualization, Linköping University, Linköping, Sweden, 3Department of Medical Radiation Physics, Lund University, Lund, Sweden
Synopsis
Subject movements and other disturbances might contaminate the Magnetic Resonance Spectroscopy data, and these artifacts can be misinterpreted as actual metabolite signals by the quantification program. Thus, an automatic method could be very helpful for finding artifacts and eliminating them. In this work, an approach of using correlation analyses was tested in order to evaluate if motion contaminated data could be identified. A total of 296/320 spectra were correctly categorized according to the movement-paradigm. This procedure could be suitable for identifying data that are affected by subject motion or other artifacts that would reduce the quality of the result.
Introduction
It is very important that the metabolite concentrations obtained from a Magnetic Resonance Spectroscopy (MRS) measurement are reliable in both clinical and research applications. Subject movement during singular scans might result in disturbances that contaminate the resulting spectrum, and these artifacts can be misinterpreted as actual metabolite signals by the quantification program, which results in unreliable concentration estimates. Therefore, an automated method could be very helpful for finding artifacts and eliminating them from the data. In this proof-of-principle study, an approach of using correlation analyses was tested in order to evaluate if motion contaminated data could be identified.Materials and Methods
Data from 12 healthy volunteers were collected using a 3 T Philips Ingenia MR scanner equipped with a 12-channel head coil. The measurement protocol consisted of two MEGA-PRESS measurements (TR/TE = 2000/68 ms, N = 16384 time points, M = 40 dynamics (dyn) (20 OFF and 20 ON), each consisting of P = 8 phase cycle (PC) steps, edited pulse ON at 1.90 ppm, edited pulse OFF at 7.46 ppm, water suppression MOIST) with the voxel (35 x 25 x 25 mm3) placed in the left cerebellar hemisphere. The first MEGA-PRESS measurement was considered as a reference, thus without any intentional movements, and the second measurement contained four randomized episodes of head movements (dyn 7 PC 1 – dyn 7 PC 7, dyn 19 PC 6 – dyn 20 PC 5, dyn 37 PC 6 – dyn 37 PC 8, dyn 38 PC 4 – dyn 39 PC 3). The volunteers were instructed when to move through vocal communication via the speakers. The completely unprocessed data (raw data) were extracted from the scanner and reconstructed using ReconFrame (GyroTools, Switzerland) and the signals from the different coil elements were combined with SNR-weighting using the water reference signal. The data was phase corrected according to Klose [1] and frequency aligned based on the water residual in the water suppressed data [5]. At this point, the data had the dimension of NxMxP.
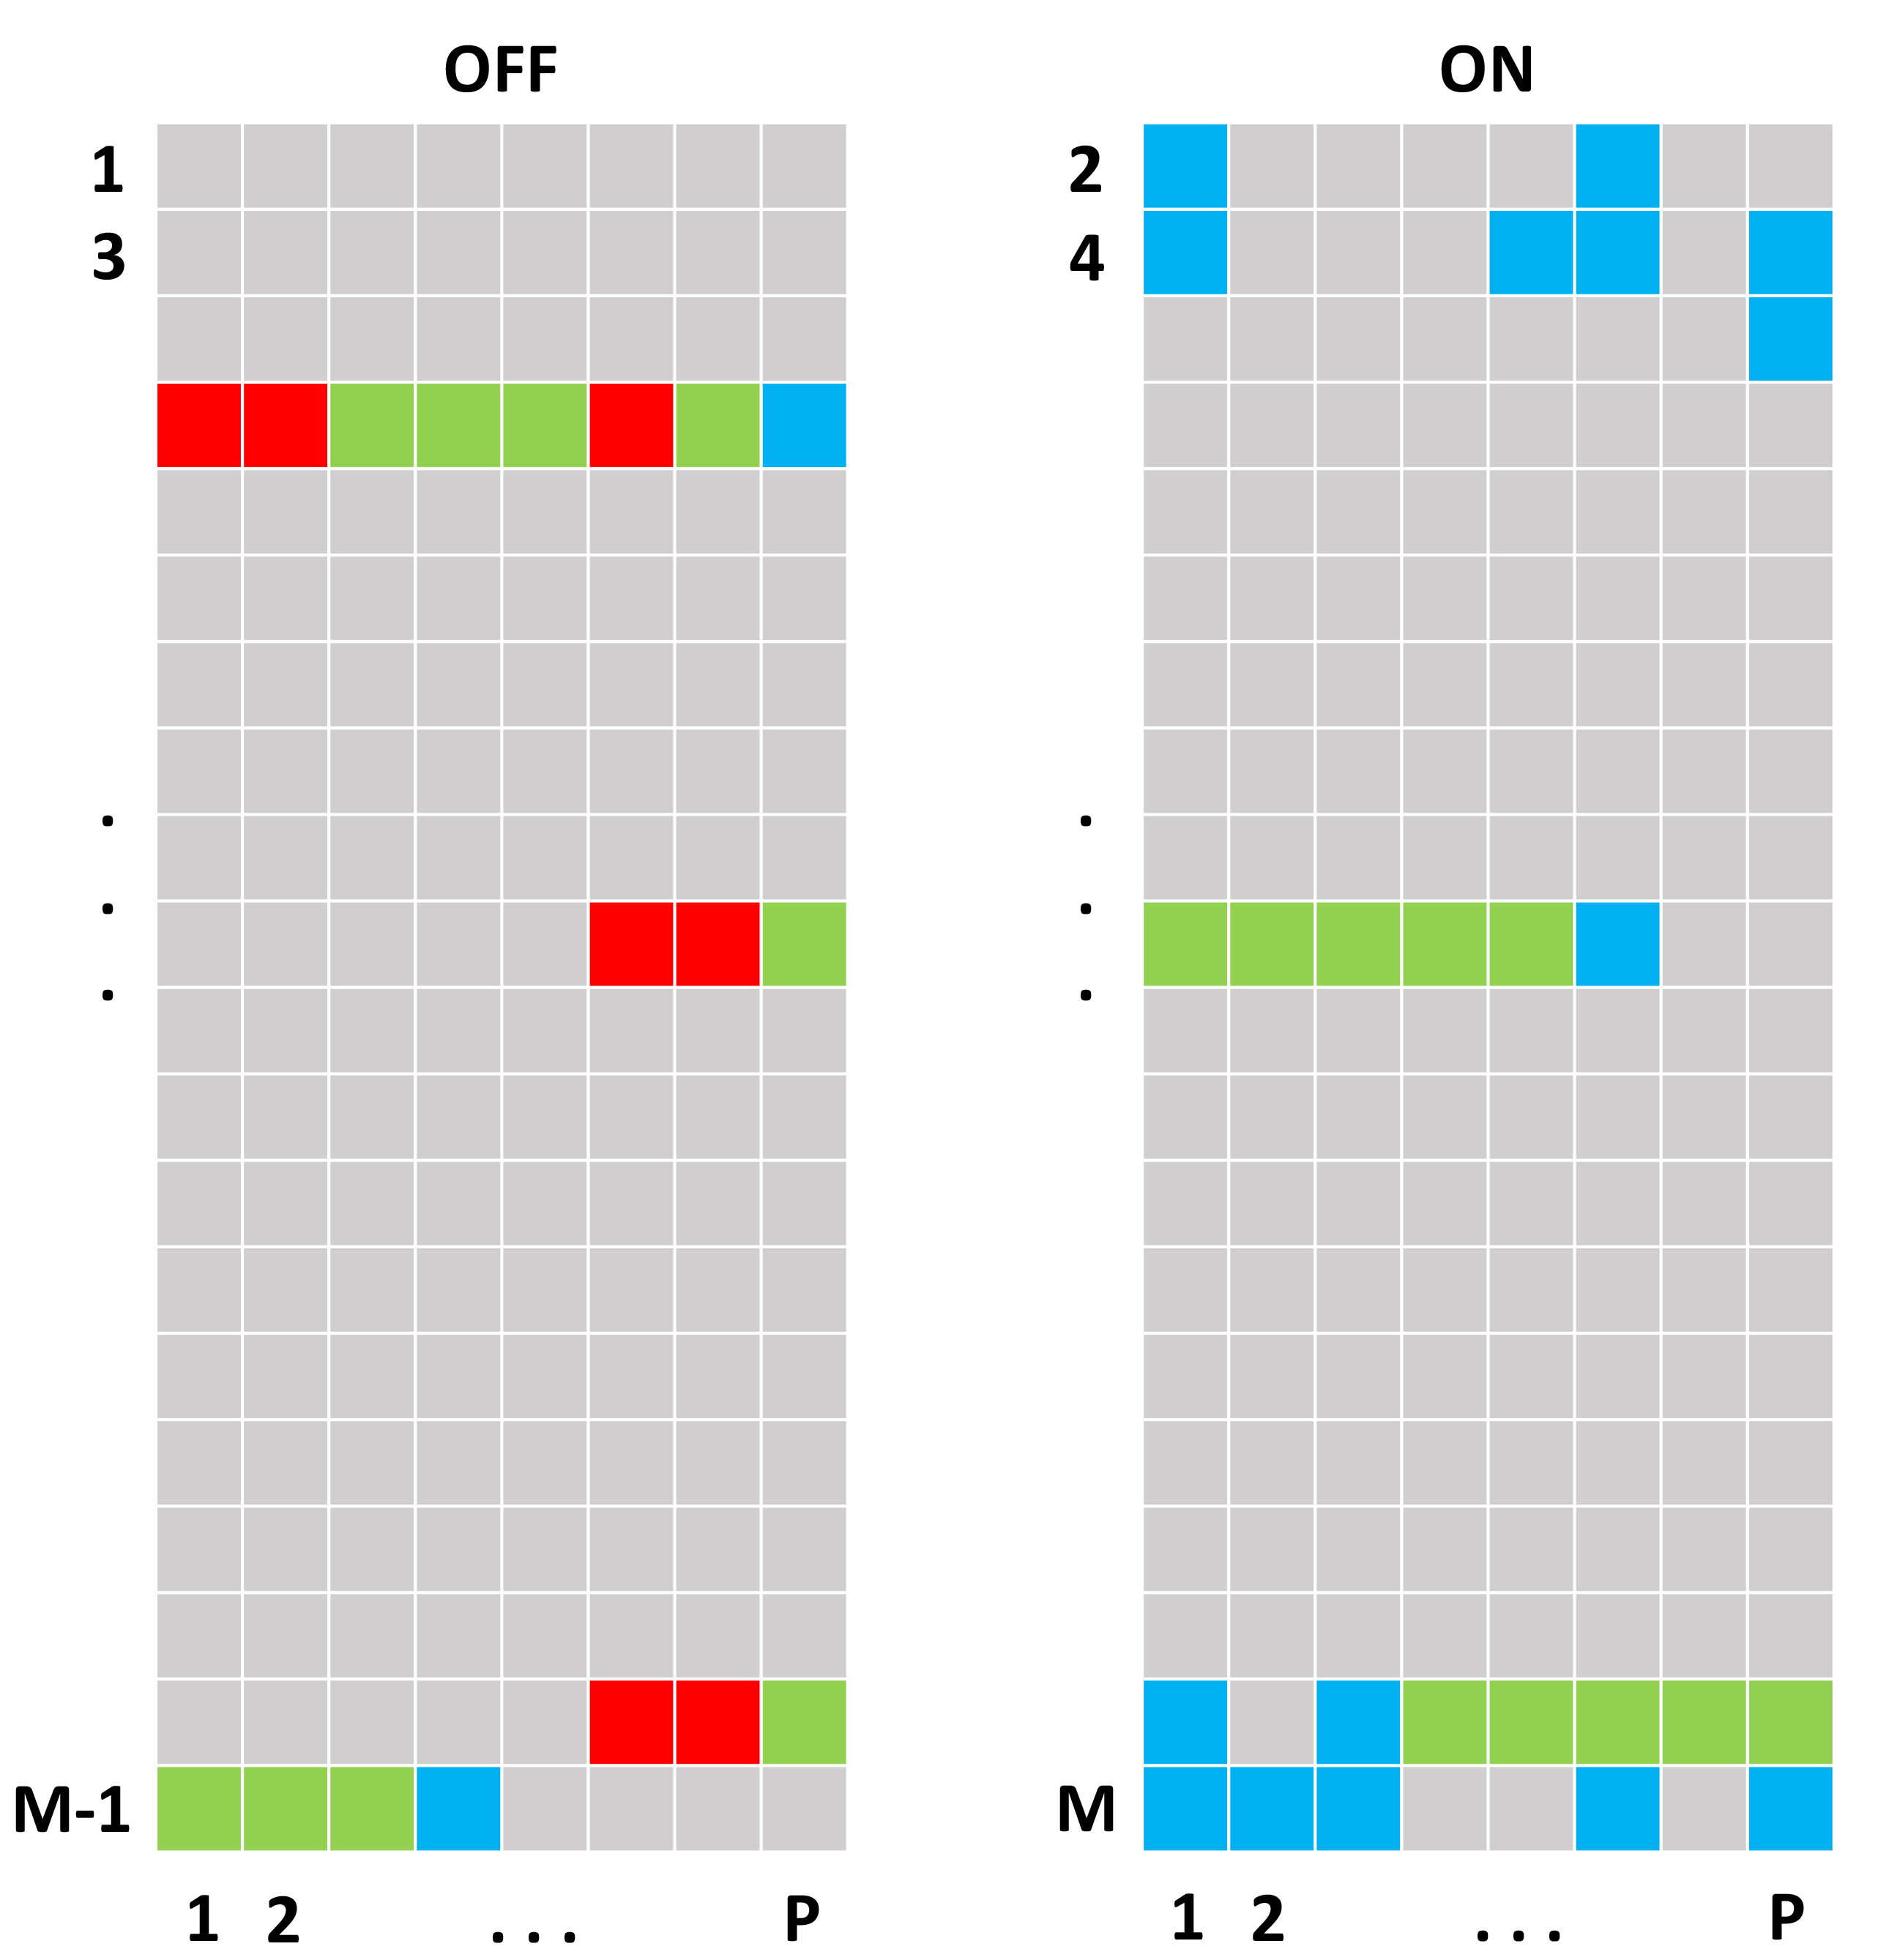
After Fourier transform, the spectral region between 1 to 4 ppm was extracted and used in the correlation analysis. Since the editing pulse was applied to 1.90 ppm in the ON data, this leaves these spectra with a different appearance than the OFF data, and thus two separate correlation analyses were conducted, one for the OFF data and one for the ON data. For each of the eight phase cycle steps, one spectrum was extracted and correlated to the mean of the other M/2-1 spectra. Since the OFF and ON spectra were analyzed separately, this generated two correlation matrices of the size M/2xP. A single acquisition was considered affected by motion if the correlation was below a threshold value.
Results
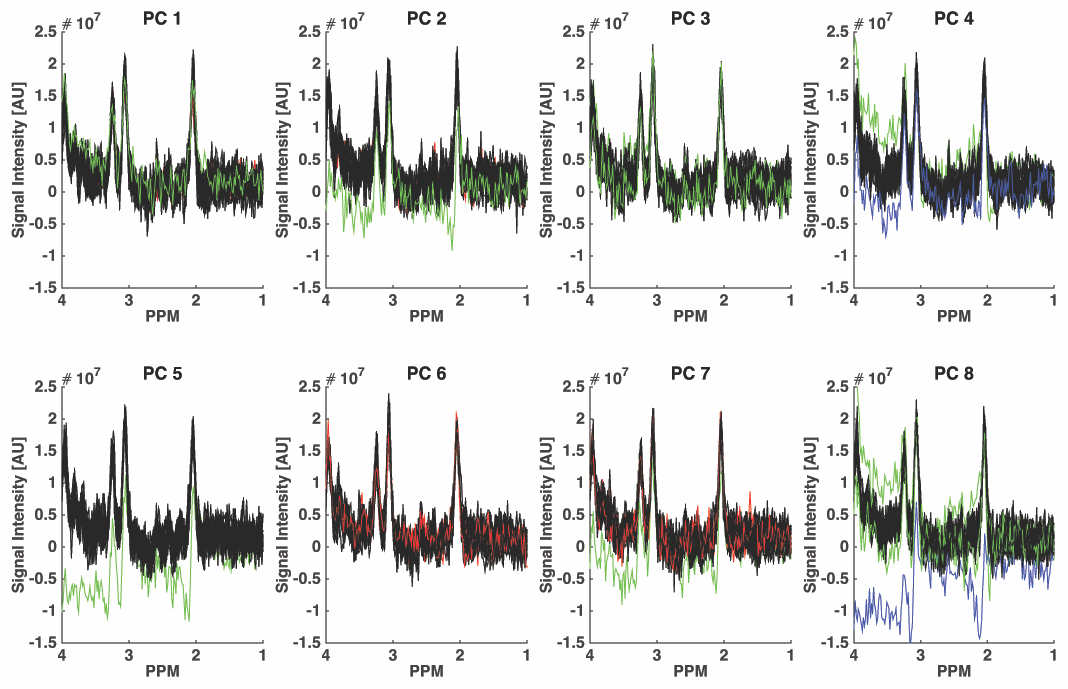
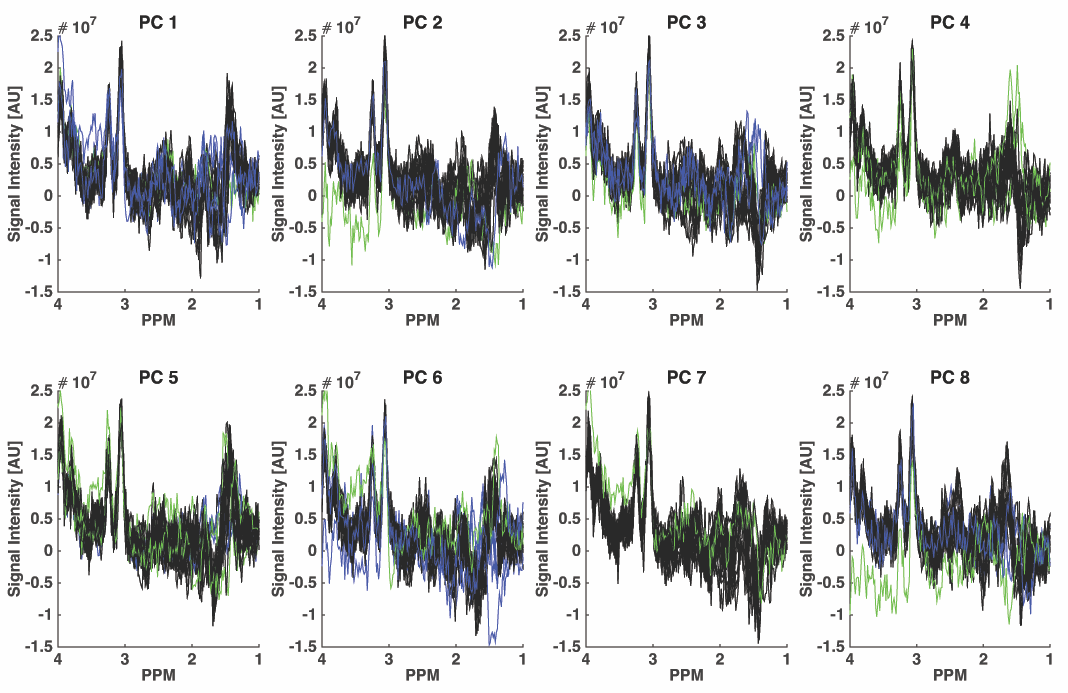
Fig. 1 illustrates the result from the correlation analyses performed on one dataset, a total of 296/320 spectra were correctly identified according to the movement-paradigm. However, it appears as the effect of the movements was delayed approximately 1-2 spectra in the data. The cut off correlation value was chosen to 0.78 to obtain a specificity and sensitivity as high as possible. Fig. 2-3 show the ON and OFF data color-coded according to Fig. 1, where green and blue spectra were identified as data with artifacts and therefore should be removed.Discussion
The correlation approach has recently been suggested for phase-correction [6]. In this proof-of-principle study, most of the data containing movement artifacts were detected according to the instructed paradigm. However, the effect of the movement appears to be delayed and some of the worst spectra was actually false positive, thus not including movements according to the paradigm. Further experiments need to be performed to turn this into an automated method and fortunately, there are already more data collected suitable for this purpose.Conclusion
By spectral correlation analysis, single MRS acquisitions showing movement or other artifacts could be identified and removed from averaging that otherwise could have reduced the quality of the data.Acknowledgements
Support from Knut and Alice Wallenberg Foundation is gratefully acknowledged.
We are grateful to Richard Edden of Johns Hopkins in Baltimore for very generously providing the MEGA-PRESS pulse sequence and other tools developed under NIH GRANTS P41 015909 and R01 016089.
References
1. Mescher M, Merkle H, Kirsch J, Garwood M, Gruetter R. Simultaneous in vivo spectral editing and water suppression. NMR Biomed. 1998 Oct:11(6):266-72.
2. Mullins PG, McGonigle DJ, O'Gorman RL, Puts NA, Vidyasagar R, Evans CJ, et al. Current practice in the use of MEGA-PRESS spectroscopy for the detection of GABA. Neuroimage. 2014;86:43-52.
3. Mescher M, Tannus A, Johnson MOn, Garwood M. Solvent Suppression Using Selective Echo Dephasing. Journal of Magnetic Resonance, Series A. 1996;123(2):226-9.
4. Klose U. In vivo proton spectroscopy in presence of eddy currents. Magnetic Resonance in Medicine. 1990;14(1):26-30.
5. Helms G, Piringer A. Restoration of Motion-Related Signal Loss and Line—Shape Deterioration of Proton MR Spectra Using the Residual Water as Intrinsic Reference. Magnetic Resonance in Medicine. 2001;46:395-490.
6. Wiegers EC, Philips BWJ, Heerschap A, van der Graaf M. Automatic frequency and phase alignment of in vivo J-difference-edited MR spectra bz frequency domain correlation. MAGMA 2017; Epub ahead of print.
Figures