2652
Pediatric Head Motion Detection using Free Induction Decay Navigators1Radiology, Boston Children's Hospital, Harvard Medical School, Boston, MA, United States, 2Radiology, Boston Children's Hospital, Boston, MA, United States
Synopsis
Free induction decay navigators (FIDnavs) are sensitive to head motion and can be rapidly acquired using standard scanner hardware, making them an attractive approach for motion detection in pediatric MRI. In this study, we perform a head-to-head comparison of various FIDnav motion detection algorithms in controlled volunteer experiments and in pediatric patients scanned under typical conditions using a modified MPRAGE sequence. We demonstrate that computing the change in cross-correlation coefficient between FIDnav signal vectors results in excellent detection accuracy in both volunteers and patients, based on concurrent ground-truth RMS displacements measured using an electromagnetic tracking system.
Introduction
Motion artifacts pose a significant problem for the acquisition of diagnostic quality MR images in children, often necessitating repeat scans or the use of sedation. Free induction decay navigators (FIDnavs) are an attractive approach for monitoring pediatric head motion as they can be acquired very rapidly, with no additional hardware. Motion detection with FIDnavs relies on combining signals from multi-channel array coils into a single global motion parameter and defining an empirical threshold to indicate a motion event. This information may then be used to provide real-time feedback to the operator, trigger a prospective correction strategy, or retrospectively identify motion-corrupted data. Several FIDnav motion detection algorithms have been proposed1-5; however, there is no consensus on the optimal metric or threshold for reliable detection, and a lack of validation in realistic clinical scenarios. In this work, we perform a head-to-head comparison of the detection power of various algorithms in volunteers and in a pediatric patient cohort.Methods
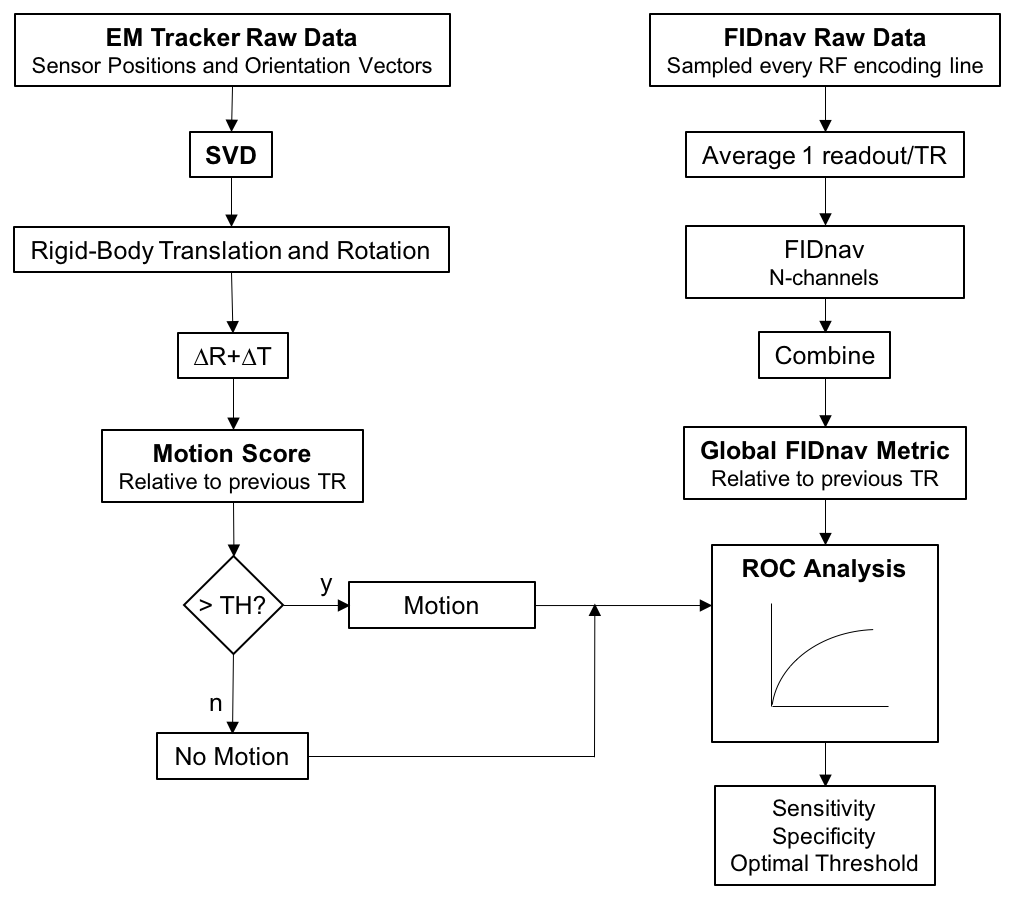
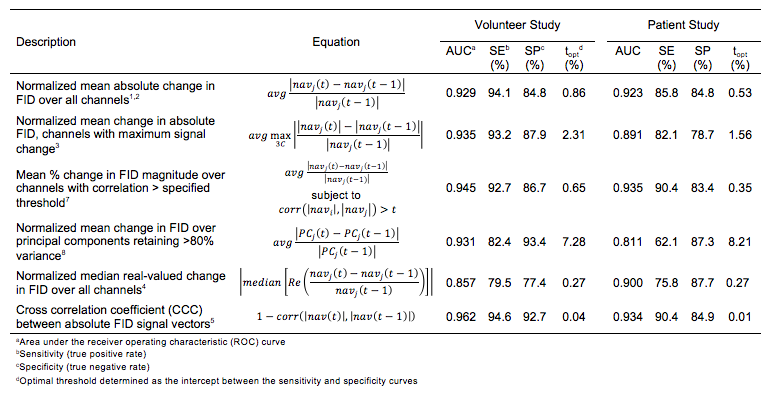
For initial validation, three volunteers were scanned at 3T (Siemens Healthcare, Erlangen, Germany) with a 32-channel head coil. FIDnavs (0.3 ms duration) were inserted into a non-selective sagittal MPRAGE sequence (TR/TI/TE=1540/800/2.47 ms, α=9°, RBW=200 Hz/pix, TA=6.6 min) after each excitation in the RF pulse train. Multiple scans were acquired for each subject, including one acquisition without any voluntary motion and up to four acquisitions where subjects were verbally instructed to perform eight small, random head movements during the scan. 16 pediatric patients (aged 4-18 years) were also scanned at 3T with the same modified MPRAGE sequence (TR/TI/TE=1540/800/2.47 ms, α=9°, RBW=200 Hz/pix, 2x GRAPPA acceleration, TA=4.2 min). No specific instructions were given to the patients, other than to remain as still as possible for the duration of the scan. Ground truth displacements and rotations were simultaneously measured during all scans using an electromagnetic (EM) tracking system (Robin Medical Inc., Baltimore, MD). These were used to retrospectively compute a motion score, describing the RMS displacement of a point on the surface of the brain6 relative to the previous TR. Motion events were defined as a change in this worst-case displacement >0.4 mm. FID samples from the first readout were averaged to yield a single complex navigator signal per channel for each TR. A receiver operating characteristic (ROC) analysis was performed on both the volunteer and patient data to compare the sensitivity and specificity of various coil combination strategies, summarized in Table 1. The motion detection algorithms for both EM and FIDnav data are shown in Figure 1.Results
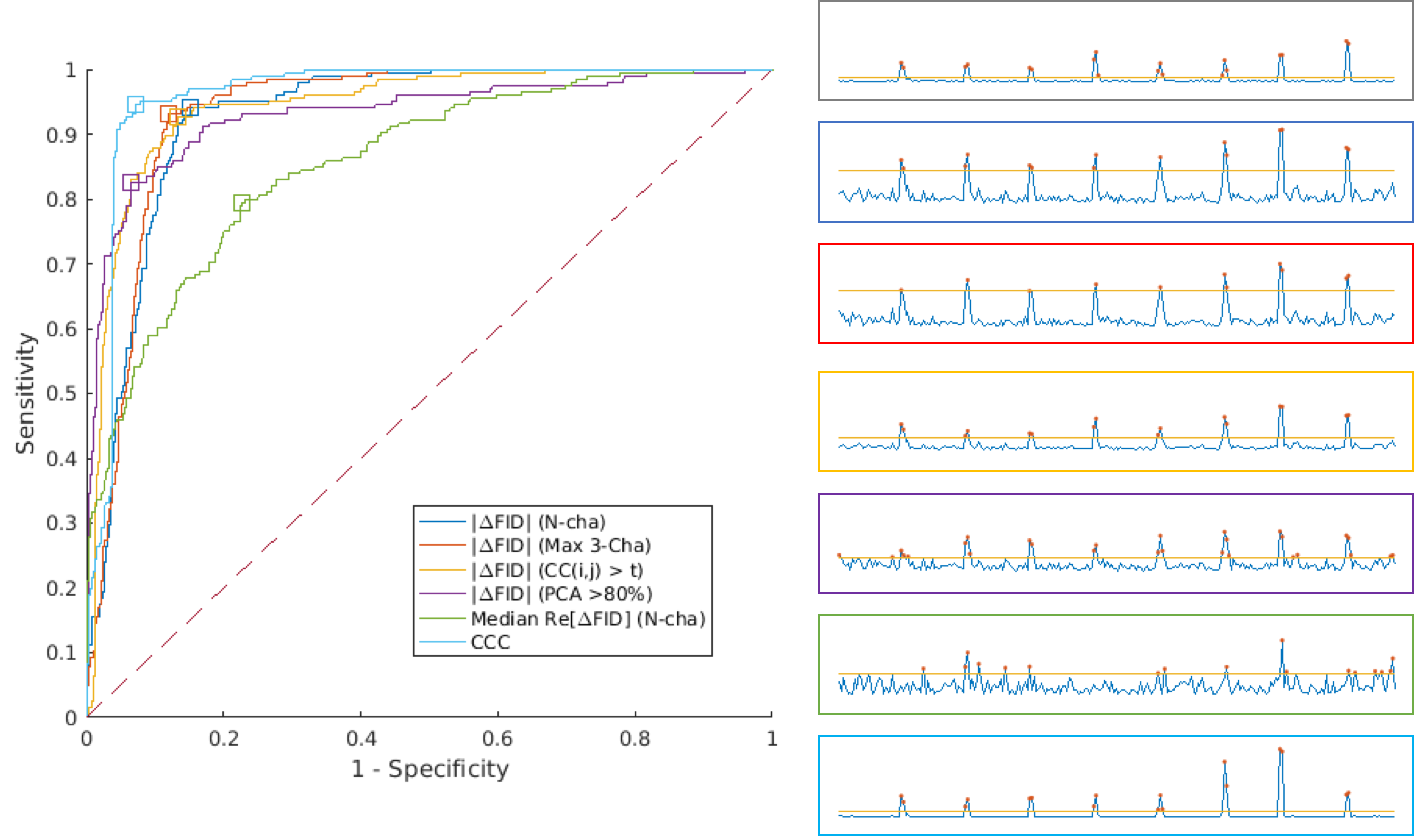
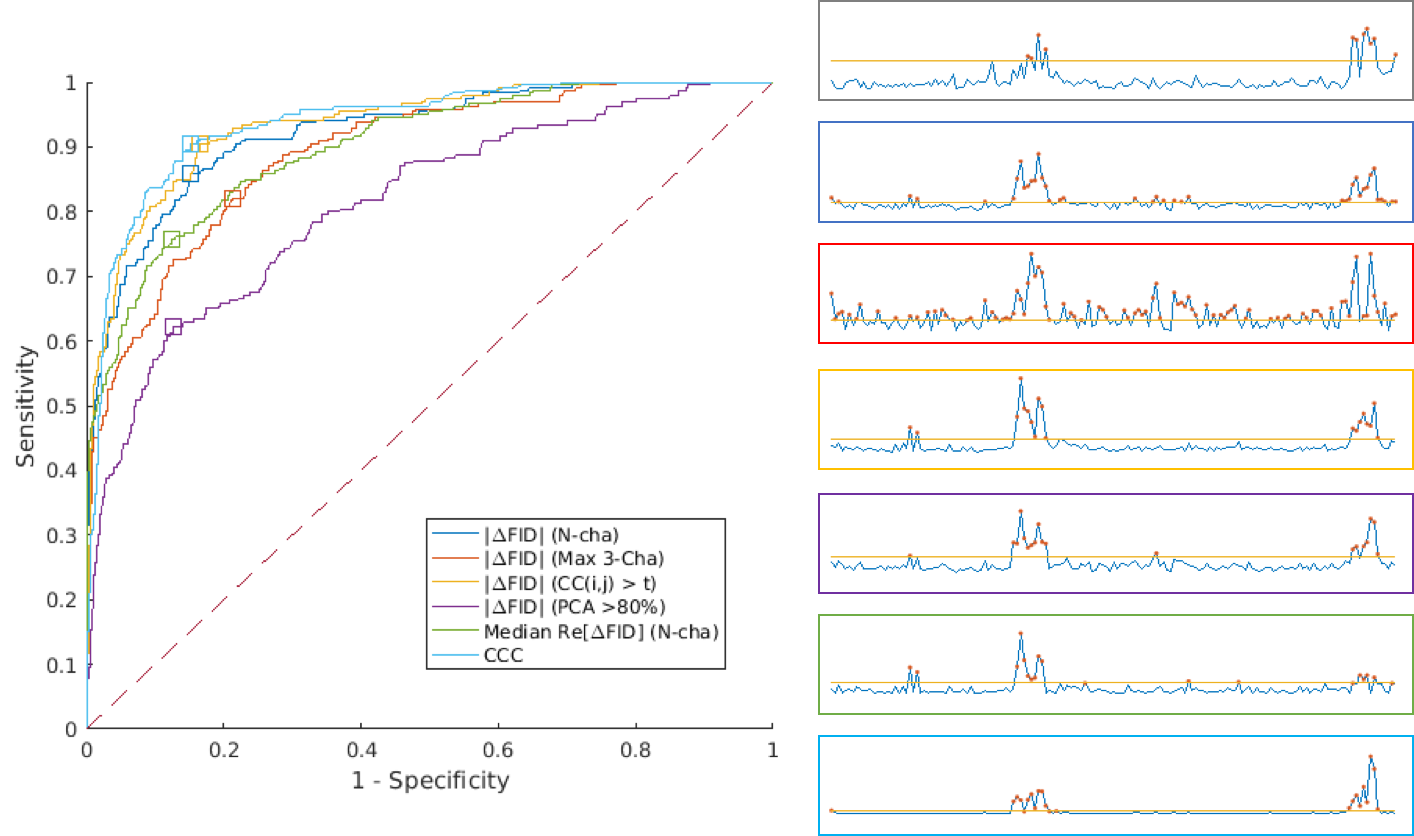
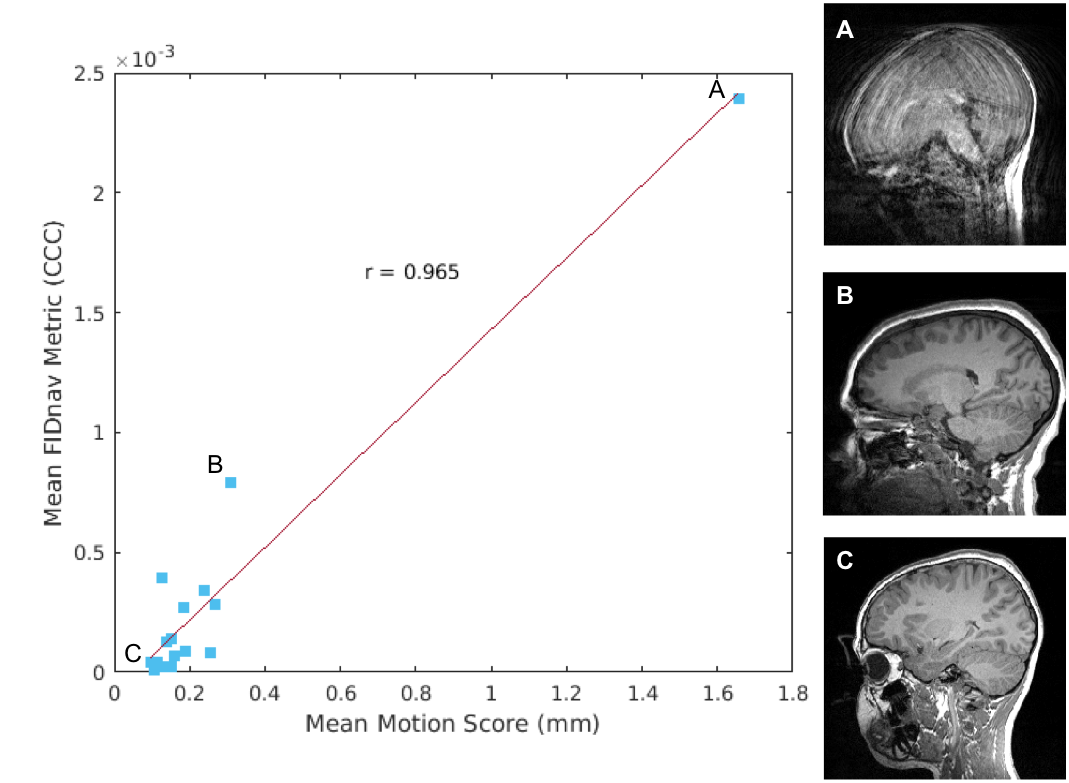
In the controlled volunteer experiment, the EM tracker detected 205 motion events across all scans (n=12), with a mean motion score of 1.9 mm. Most proposed FID motion detection algorithms exhibited good detection accuracy (AUC>0.9), with the change in cross-correlation coefficient (CCC) between FIDnav signal vectors achieving sensitivity and specificity >90% (Table 1). From Figure 2, it is evident that the effect of each motion on the resulting FIDnav signal change is variable. A total of 240 motion events were detected by the EM tracker in the pediatric patient scans, with a mean motion score of 1.42 mm. The ROC analysis (Fig. 3) revealed that CCC also performed best in patients, with a sensitivity of 90.4% and specificity of 84.9%. The mean change in CCC for each patient was highly correlated (r=0.965) with the mean motion score over the entire scan (Fig. 4).Discussion
Ideally, a motion detection algorithm should have high sensitivity and specificity to successfully mitigate artifacts, whilst avoiding unnecessarily prolonging the scan time in a prospective correction or reacquisition scenario. For this study, a change in RMS displacement >0.4 mm (~half a voxel) was chosen to represent a substantial motion event; however, tolerance to motion ultimately depends on the sequence acquisition and diagnostic application. The algorithms tested were not exhaustive, but were chosen to represent previously proposed strategies in the motion detection literature. Computing the CCC between FIDnavs had the highest sensitivity/specificity across both volunteer and patient experiments, indicating this metric may be more robust against the confounding effects of noise and non-rigid motion. Preliminary results show this global FIDnav metric correlates with mean motion score; future work will compare FIDnav motion detection results against radiologic evaluation of image quality in a larger patient cohort.Conclusion
This study demonstrates the potential of FIDnav motion detection to reduce motion sensitivity and improve scan efficiency in pediatric and other uncooperative patients and underscores the need for further validation in these populations.Acknowledgements
This research was supported in part by the following grants: NIH-5R01EB019483, NIH-4R01NS079788 and NIH-R44MH086984.References
1. Kober T, Marques JP, Gruetter R, and Krueger G, Head motion detection using FID navigators, Magn Reson Med. 2011;66:135–143.
2. Dyverfeldt P, Deshpande VS, Kober T, et al., Reduction of motion artifacts in carotid MRI using free-induction decay navigators, J Magn Reson Imag. 2014;40:214-220.
3. Waszak M, Falkovskiy P, Hibert T et al., Prospective head motion correction using FID-guided on-demand image navigators, Magn Reson Med. 2017;78:192-203.
4. Kober T, Gruetter R, and Krueger G, Prospective and retrospective motion correction in diffusion magnetic resonance imaging of the human brain, Neuroimage 2012;59:389–398.
5. Stemkens B, Benkert T, Chandarana H et al., Adaptive bulk motion exclusion for improved robustness of abdominal magnetic resonance imaging, NMR Biomed. 2017;30:e3830.
6. Tisdall MD, Hess AT, Reuter M, et al., Volumetric navigators for prospective motion correction and selective reacquisition in neuroanatomical MRI, Magn Reson Med. 2012;68:389–399.
7. Zhang T, Cheng JY, Chen Y, et al., Robust Self-Navigated Body MRI Using Dense Coil Arrays, Magn Reson Med. 2016;76:197–205.
8. Andreychenko A, De Senneville BD, Navest RJM, et al., Respiratory Motion Model Based on the Noise Covariance Matrix of a Receive Array, 2017;e26775.
Figures