2645
The treatment efficacy of novel adjuvant chemotherapy evaluated by bi-exponential model diffusion weighted imaging in breast carcinomaLiang Yuyu1, Zhu Rongrong2, Yang Yong2, and Zhuo Zhizheng3
1Imaging, NingXia People's Hospital, Yinchuan, China, 2Imaging, NingXia People's Hospital, YinChuan, China, 3Imaging Systemt Clinical Science Philips Healthcare, Philips(China) Investment co.Ltd., Beijing, China
Synopsis
This study aims to explore the efficacy of NAC assessed by quantitative multi-parameter utilized bi-exponential diffusion weighted imaging in breast cancer. In this study, there is significant difference in ΔFfast value between groups, mainly results from the rise of Ffast value of tumor because of chemotherapy. Nonetheless, the diagnosis efficacy is mild for NAC assessment using ΔFfast value.
Introduction
Neoadjuvant chemotherapy (NAC) is the standard therapy method before operation[1]. Therefore, evaluation of treatment of chemotherapy is the key point in clinical. This study mainly investigates the efficacy of NAC assessed by quantitative multi-parameter utilized bi-exponential diffusion weighted imaging in breast cancer.Methods
55 subjects with breast carcinoma were recruited. This study was approved by the Ethics Committee of Ningxia People’s Hospital, Yinchuan,China. These patients underwent the MR scanning by using a 3T scanner (Ingenia,Philips Healthcare, Best, The Netherlands) with an IVIM protocol: (TR=1000ms,TE=76.5 ms,slice thickness=5mm,slice space=1.5mm,10 b values of b=0, 20, 30, 50 100, 200, 400, 800, 1000, 1500s/mm2. The IVIM images were preprocessed by a bi-exponential model before NAC and after 2 NAC episodes, respectively. The value of slow apparent diffusion coefficient (ADC), fast ADC and Ffast were measured. These patients were divided into effective group and ineffective group according to the criteria of treatment evaluation in solid tumor. Paired student’s t test was applied to compare the slow ADC, fast ADC, Ffast in two groups. The slow ADC, fast ADC, Ffast, Δslow ADC and ΔFfast calculated as the value difference before and after NAC were compared by independent student’s t test; p < 0.05 was considered statistically significant. A receiver-operating characteristic (ROC) analysis was performed to evaluate the sensitivity and specificity of NAC efficacy in two groups with ΔFfast.Results
32 subjects were classified as effective group and 23 subjects for ineffective group. Before and after NAC, the slow ADC was (0.397 ±0.219) * 10-3 and (0.672 ± 0.321) * 10-3 mm2/s in effective group respectively, and these values were (0.336 ± 0.090) * 10-3 and (0.622 ± 0.243) * 10-3mm2/s in ineffective group respectively, there is significant difference in slow ADC between effective and ineffective groups before and after-NAC. However, there is no significant difference was found in intra-group. Before and after NAC, the fast ADC was (7.139 ± 2.495) * 10-3 and (7.696 ± 3.683) * 10-3mm2/s in effective group respectively, and these values were (8.447 ± 4.137) * 10-3 and (8.741 ± 5.160) * 10-3mm2/s in the ineffective group respectively. There is no significant difference in fast ADC before or after NAC between two groups. Before and after NAC, the Ffast was 0.319 ± 0.0.142 and 0.576 ± 0.133 in effective group respectively, and these values were 0.359 ± 0.130 and 0.52 ± 0.14 in ineffective group respectively. there is significant difference in Ffast between effective and ineffective groups before and after-NAC, but, there is no significant difference was found in intra-group. The AUC (area under curve) was 0.700 in the ΔFfast ROC. When 0.136 was set as the cut-off value, sensitivity and specificity was 81.3% and 60.9% respectively, the assessment efficacy was moderate.Discussion
Cell necrosis post-neoadjuvant chemotherapy (NAC), enlargement of extracellular space and the increase of interstitial substance such as vessel, that reflect the rise of Ffast value (perfusion factor stands for the organization microcirculation) [2], especially for the tumor cell which is sensitive to chemotherapy.Conclusion
The slow ADC and Ffast were increased prominently measured by multi-b bi-exponential model DWI before and after NAC. However, there is no significant advantage of ΔFfast to evaluate the treatment efficacy in NAC in breast carcinoma.Acknowledgements
No acknowledgement found.References
1 Hylton N. MR imaging for assessment of breast cancer response to neoadjuvant chemotherapy[J]. Magn Reson Imaging Clin N Am, 2006, 14(3):383-389.
2 Tamura T,Usui S,Murakami S,et al.Comparisons of multi b-value DWI signal analysis with pathological specimen of breast cancer[J].Magn Reson Med,2012,68:890-897.
Figures
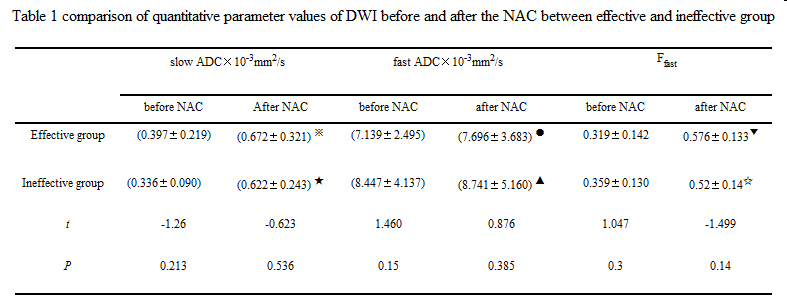
In effective group, before and after NAC, the
slow ADC was compared with t※ = -5.686, P※=0.000,there was significant difference. The fast ADC was compared with t● = 0.732, P●=0.470, there was no significant difference. The Ffast was
compared with t▼ = -9.419, P▼=0.000, there was significant
difference. In ineffective group, before
and after NAC, the slow ADC was compared with t★ = -7.07, P★=0.000,
there was significant difference. The fast ADC was compared with t▲ = -0.23, P▲=0.82, there was no significant difference. The Ffast
was compared with t☆ = -5.686, P☆=0.000,
there was significant difference.
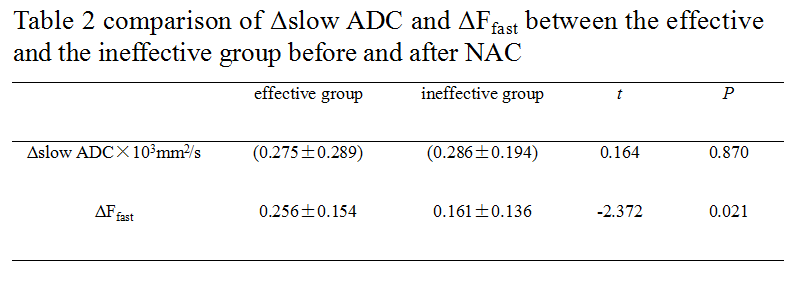
The difference of ΔFfast was more significant than the difference
of Δslow ADC between
effective group and ineffective group
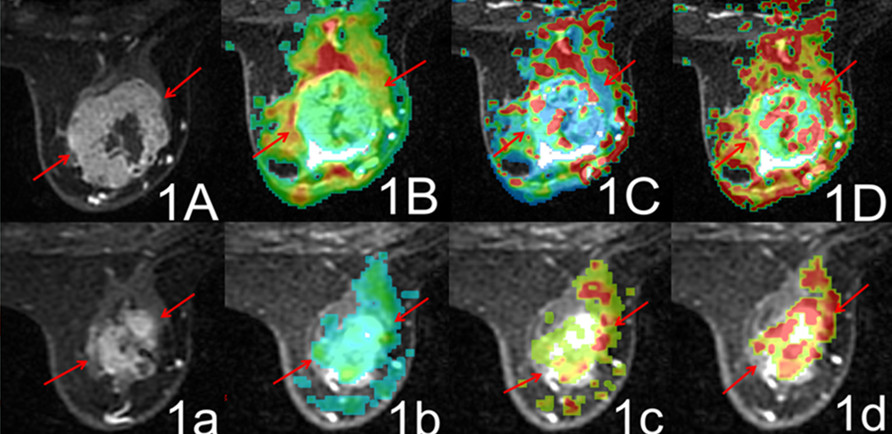
Figure was for a female patient, 45 years old, right
breast infiltrating ductal carcinoma, level Ⅱ. Figures 1A and 1a:
the VIBRANT90s images, before and after NAC the tumor length reduced from 5.8cm
to 3.2 cm, and the RECIST evaluated NAC. Figures 1B and 1b: slow ADC pseudocolor map, slow ADC was 0.414 x 10⁻³mm2/s
before NAC, 0.465 x 10⁻³mm2/s after ; Figures 1C and 1c: fast ADC pseudocolor map, fast ADC
was 1.31 x 10⁻³mm2/ s before NAC, 7.85 x 10⁻³mm2/
s after ; Figures 1D and 1d:Ffast pseudocolor map, Ffast was 0.288 before NAC, 0.401 after , increased
obviously.
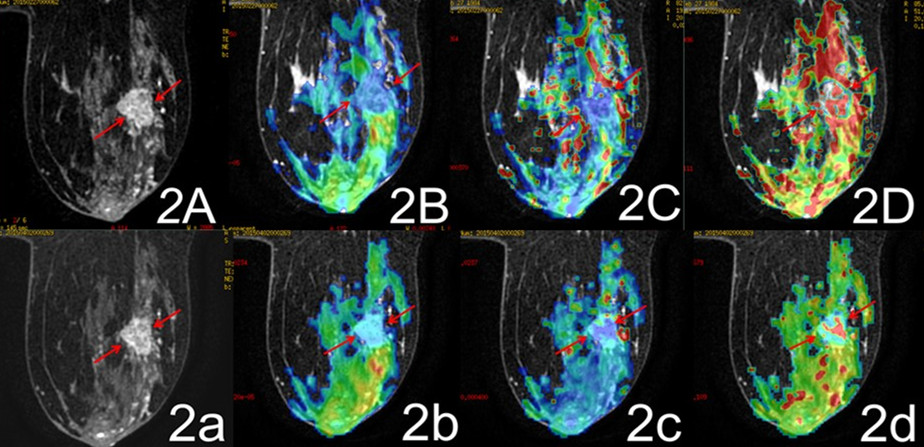
Figures 2 for a female patient, 31 years old, right
breast infiltrating ductal carcinoma, level Ⅱ, figures 2A and 2a: VIBRANT90s images, before and after
NAC the tumor length reduced from 2.5 cm to 2.1 cm, RECIST evaluation NAC is ineffective; figures 2B
and 2b: slow ADC pseudocolor map, slow ADC was 0.395
x 10-3mm2/s before NAC, 0.44 x 10⁻³mm2/s
after; figures 2C and 2c: fast ADC pseudocolor map, ,fast ADC was 0.92 x 10⁻³mm2/
s before NAC, 3.0 x 10⁻³mm2/
s after; figures 2D and 2d: Ffast
pseudocolor map, Ffast was 0.358 before NAC, 0.67 after, increased obviously.
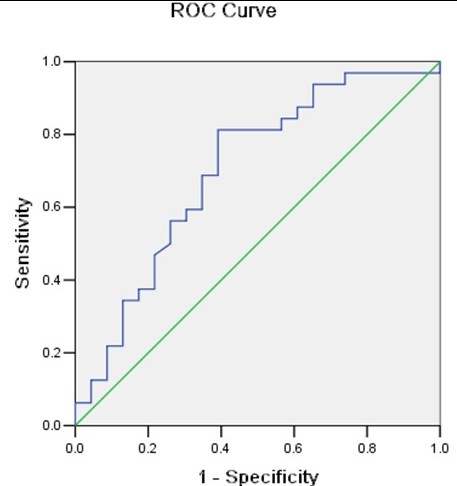
Figure showed ROC curve that the curative effect assessment of NAC using Δ Ffast. The AUC
(area under curve) was 0.700. When 0.136 was set as the cut-off value,
sensitivity and specificity was 81.3% and 60.9% respectively, the assessment
efficacy was moderate.