2642
MRI TEXTURE ANALYSIS: DIFFERENTIAL DIAGNOSIS OF CEREBRAL GLIOMAS FOLLOWING WHO 2016 CLASSIFICATION OF CNS TUMOURS1Radiology, The First Affiliated Hospital of Dalian Medical University, Dalian, China, 2Radiology, The first affiliated Hospital of Dalian Medical University, Dalian, China
Synopsis
For the first time in 2016, the World Health Organisation (WHO) Classification of Tumours of the Central Nervous System used molecular parameters in addition to histology to define many tumour entities, thus formulating a concept for how CNS tumour diagnose should be structured in the molecular era and in that way is both a conceptual and practical advance over its 2007 predecessor. The strength of non-invasive diagnosis using textural analysis of conventional MRI sequences was evaluated and gave satisfactory results comparing grade II, III and IV including their genetic status.
INTRODUCTION
Diffusely infiltrating gliomas including
WHO grades II, III, IV account for > 60% of all primary tumours MRI is commonly used because it
provides a wide range of physiologically meaningful contrasts to distinguish
different tissues by imaging, and therefore improves evaluations of
heterogeneous patterns of tissue compositions within diffuse gliomas. The aim of our study was to determine the strength
of MRI texture analysis using conventional sequences to distinguish cerebral
gliomas grade II, III and IV taking in account their genetic status.
MATERIALS AND METHODS
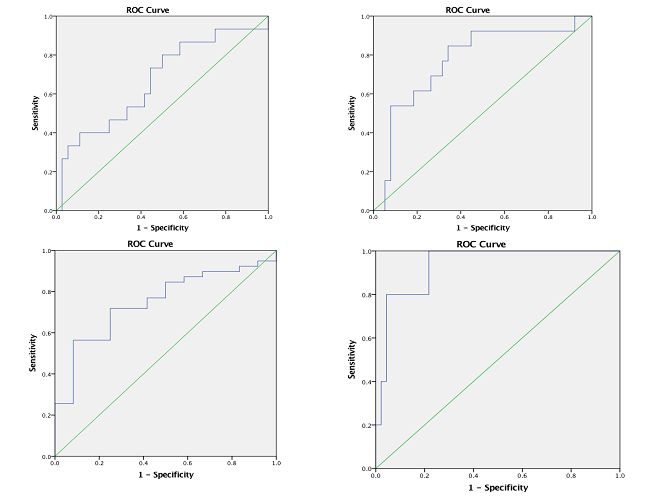
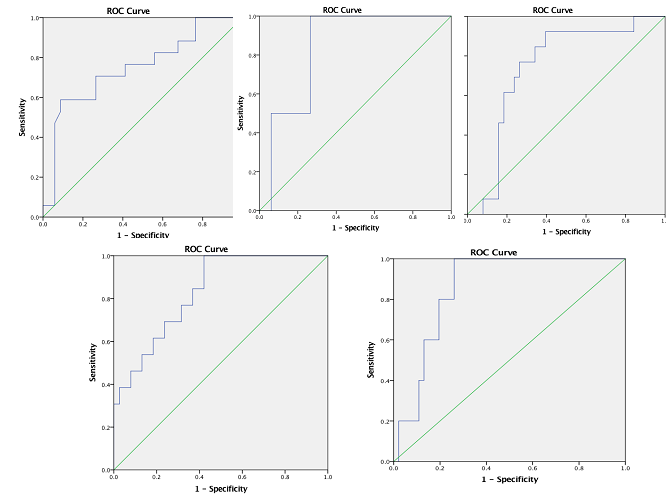
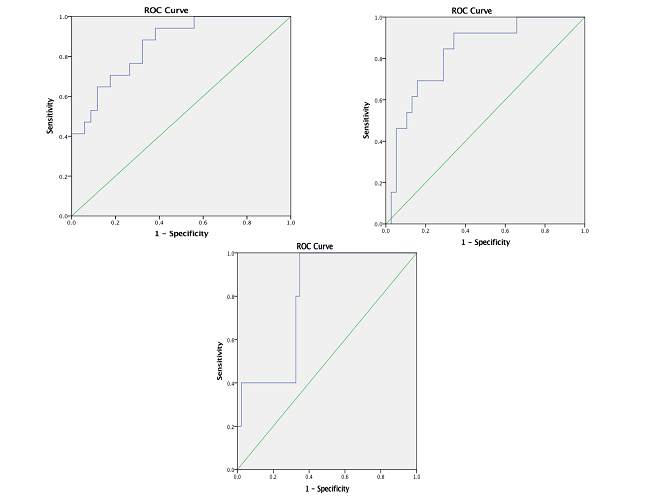
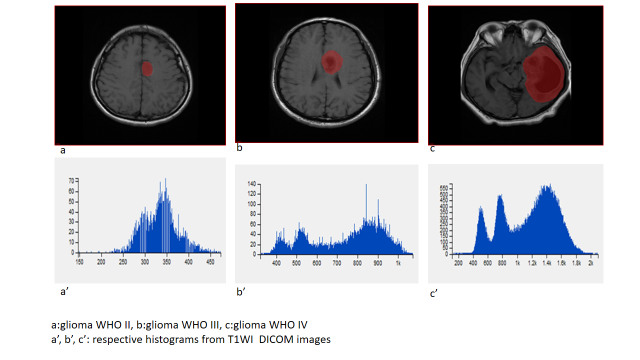
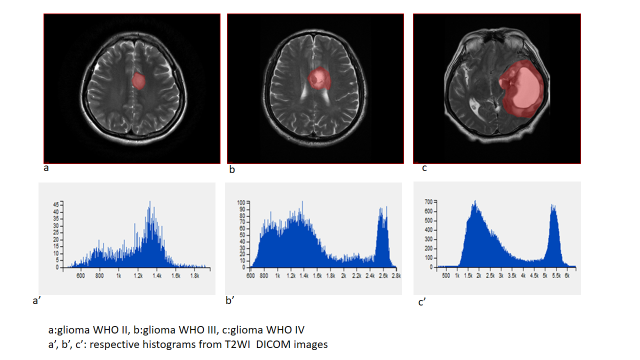
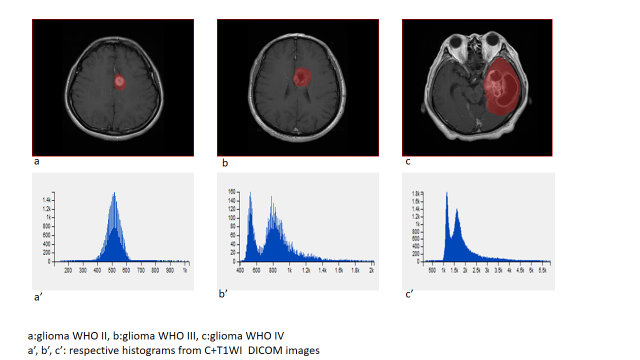
51 patients were included: 15 WHO II, 19 WHO III, and 17 WHO IV. T1WI, T2WI, T1WI+C MRI DICOM images performed with 1.5 Tesla machine in preoperative examinations were retrospectively selected. The MRTA was performed with OMNIKINETICS GE Software (Healthcare, China) ; the 3D ROIs were delimited manually on all axial slices covering the entire tumor parenchyma. First and second-orders’ texture parameters were selected for statistical analysis which was done on SPSS.24 software; One-way ANOVA and Kruskal-Wallis test were used to state the significance of texture parameters to differentiate gliomas. Receiver Operating Characteristics (ROC) were used to assess sensitivity and specificity to differentiate our tumors’ types which were comparing according to their grades and the genetic mutations (P53, IDH-1, EGFR, and GFAP). Spearman correlation permitted to determine the relationship between significant (statistically) texture parameters and the percentages of Ki-67.RESULTS
51 patients were included: 27 female and the mean age=21.78+/-21.13 years. The mean-percentage of Ki-67 estimated 50.1% with maximum of 72% and minimum of 27%. 27 patients had IDH-1 mutation, 30 P53 mutation, 33 GFAP and 10 EGFR.Ki-67 was positively correlated with parameters Skewness (r=0.444,p=0.001), Cluster shade (r=0.413, p=0.003), Cluster Prominence (r=0.364,p=0.009), Entropy (r=0.375,p=0.007), Sum Entropy(r=0.371,p=0.007) , Haralick Entropy (r=0.375,p=0.007), Inertia(r=0.328,p=0.019) , contrast (r=0.346,p=0.013), Difference Variance (r=0.323,p=0.021), Difference Entropy (r=0.350,p=0.012) and Glcm Entropy (r=0.357,p=0.01) and negatively correlated with parameters Energy (r=-0.361,p=0.009) , Uniformity (r=-0.366,p=0.008), Correlation (r=0.337,p=0.016), Angular Second Moment (r=0.361,p=0.009)and Haralick Inverse Difference Moment (r=-0.371,p=0.007). Grades II, III and IV were differentiated on all sequences, mostly on contrasted-T1WI where were recorded the highest AUC=0.858 corresponding to Skewness and the highest sensitivity=100% corresponding to Cluster Shade (AUC=0.825); the Highest specificity=83% was obtained on T2WI and corresponded to Variance (P=0.009, AUC=0.739). On T1WI, Short Run Low Grey Level (SRLGL, p=0.033, AUC=0.670) was significant with specificity of 50% and sensitivity of 80%. The group P53-mutation was differentiated on T2WI with highest AUC=0.745, sensitivity=92% corresponding to Skewness. Cluster Shade recorded highest specificity=72%. The parameter Inertia had the highest AUC and Sensitivity on both contrasted-T1WI (0.828, 92%) and T2WI (0.832, 100%) while differentiating the IDH-1 mutation’s group. The highest specificity=83% occurred on T1WI pre-contrast and corresponds to Uniformity. For GFAP-mutation, the specificity and sensitivity reached 100% on all sequences. The highest AUC= 0.935, 0.857 and 0.794 recorded on T1WI, T2WI and T1WIC+, respectively and corresponded to parameters Contrast, Min-Intensity and Quantile5. EGFR-mutation group was well differentiated on T2WI with highest AUC=0.837, Sensitivity=100% corresponded to parameter Inertia; Cluster Prominence recorded highest specificity of 100%. On T1WI Quantile5 (p=0.032) recorded highest AUC=0.748, specificity=75% and sensitivity=72%.DISCUSSION
Ki-67 mean values was increasing with the grades, 6.6%, 25.63% and 30.88% for grade II, III, IV respectively; this was described a previous study[1]. The tumours were very well differentiated on post-contrasted T1WI ; this can be explain by the high vasculature seen in most high grade gliomas and also diverse level of vascularization within on volume of tumour. Some authors got significant results even with different methods of analysis [2]. The performance of the parameter Cluster Shade was also described by Qin et al in the differentiation of glioma [3]. For TP53 mutation our results showed significant differentiation on T2. If we follow Aghi al [4] we can assume that’s due to the signal intensity related to histo-pathological changes. IDH1-mutationis frequently found in diffusely infiltrating gliomas and are rare in all other central nervous system (CNS). Zhang et al found that T1WI post contrast and T2WI contribute more in the discrimination tasks which corresponds to our results [5]. GFAP linked with inflammatory response was well differentiate between groups. EGFR:in our study TIWI post contrast didn’t show significance which is contradictory, this might be explain by the low number of patient tested for the mutation (12 out of 51). First and second orders texture features were well represented on the list of signicant parameters. Chung et al studied their performance [6] with good results.CONCLUSION
A performed on conventional MRI sequences to differentiate cerebral gliomas, taking in account their genetic changes, showed good and promising results which may improve the management of these lesions.Acknowledgements
Professor Miao, Doctor Wang, Ms Liang Han, Nafir Abdul Jalal, Ahmed Javed Khan, Mahamad M.
All persons who supported me to complete this work.
References
1. Walker C, Baborie A, Crooks D, Wilkins S, Jenkinson, Biology, genetics and imaging of glial cell tumours, The British Journal of Radiology, 84 (2011), S90–S106
.2. Hsieh KL-C, Tsai R-J, Teng Y-C, Lo C-M (2017, Effect of a computer-aided diagnosis system on radiologists’ performance in grading gliomas with MRI. PLoS ONE 12(2): e0171342.
3. Qin J. et al, Grading of gliomas by using radiomic featureon multiple magnetic resonance imaging sequences.Med Sci Monit, 2017; 23: 2168-2178.
4. Aghi M, Gaviani P, Henson JW, Batchelor TT, Louis DN, BarkerFG, 2nd. Magnetic resonance imagingcharacteristics predict epidermal growth factor receptor amplification status in glioblastoma. Clin Cancer Res 2005;11:8600–5.
5. Zhang X., Tian Q., Wu YX.,et al, IDH mutation assessment of glioma using texture features of multimodal MR images, Proc. SPIE 10134, Medical Imaging 2017: Computer-Aided Diagnosis, 101341S (March 3, 2017).
6. Chih-Jou Hsiao, Computer-aided grading of gliomas based on local and global MRI features, Computer Methods and Programs in Biomedicine (2016), http://dx.doi.org/doi:10.1016/j.cmpb.2016.10.021.
Figures