2641
MAGNETIC RESONANCE IMAGING TEXTURE ANALYSIS (MRTA) ON T1WI, T2WI AND T1WI CONTRAST: DIAGNOSTIC ACCURACY OF CEREBRAL GLIOMA.1Radiology, The First Affiliated Hospital of Dalian Medical University, Dalian, China, 2Radiology, The first affiliated Hospital of Dalian Medical University, Dalian, China
Synopsis
Cerebral gliomas are the most common primary malignant brain tumor in adults and include Astrocytoma, Oligodendroglioma and Oligoastrocytoma. Due to its multi-parametric approach, MRI was used to quantify tumor heterogeneity with Texture Analysis (TA). To avoid unnecessary surgeries and set-up good treatment’s plan, the analysis of conventional MRI sequences was performed and showed a strong level of discrimination between the three gliomas on each sequence. TA has shown promise in the discrimination between lesions on MR images and provided satisfactory results.
INTRODUCTION
Oligodendroglioma is the third most common glial neoplasm and the peak manifestation is during the 5th and 6th decades. Astrocytomas account for approximately 80% of all gliomas and are the most common supra-tentorial tumor in all age groups. For prognostic and treatment purposes they are further stratified into two groups, high grade gliomas (HGG), classified as WHO grade III–IV tumors, and low grade gliomas (LGG), classified as WHO grade I–II tumor. The purpose of this study was to determine the diagnostic accuracy between astrocytoma, oligodendroglioma and oligoastrocytoma (WHO 2007 classification of CNS tumors) using MR Texture Analysis (MRTA) on T1WI pre and post contrast and T2WI.MATERIALS AND METHODS
Retrospectively selected, 88 patients were included in our study: 53 Astrocytomas: 18 grade II and 35 grade III; 18 Oligodendrogliomas: 13 grade II and 5 grade III; and 17 Oligoastrocytomas: 6 grade II and 11 grade III. T1WI, T2WI, T1C+ MRI DICOM images performed with 1.5 Tesla machine, before surgery, were selected. The TA was performed with OMNIKINETICS GE Healthcare, China Software; under the guidance of well-experienced mentor, the ROI were delimited manually (freehand), on all axial slices where the tumor was present, avoiding large edema. 53 (first and second order) texture parameters were selected for statistical analysis on SPSS.24 software; Independent T-test and Mann-Whitney test were used; p﹤0.05 symbolized statistical significance. Receiver operating characteristics (ROC) were used to assess sensitivity and specificity. Binary logistic regression was used to derive the predicted probability by combining the parameters that recorded highest AUC values.RESULTS
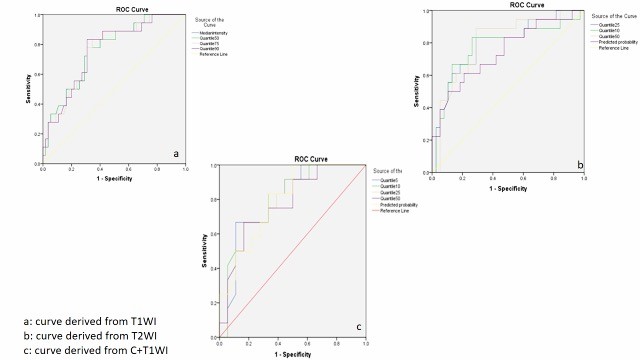
Grade II and III were significantly differentiated on T1WI by parameter Short Run Low Grey Level (p=0.024, AUC=0.641) that showed a specificity of 63% and sensitivity of 89%. Oligodendroglioma and oligoastrocytoma were differentiated on T2WI by Min-intensity (p=0.037, AUC=0.713), Inverse Difference Moment (p=0.039, AUC=0.711), with highest specificity of 87% and sensitivity of 74%. We recorded significant difference on all sequences while comparing astrocytoma and Oligodendroglioma. On T1WI more than 20 texture parameters gave significance with highest specificity and sensitivity equal to 73% and 83% respectively. The predicted probability (p=0.000039, AUC=0.774, sensitivity=83, specificity=68) derived from combination of parameters Median-intensity (p=0.001, AUC=0.761), Quantile75 (p=0.0001, AUC=0.761) and RMS (p=0.001, AUC=0.758). On T2WI, height (8) parameters recorded significance and the highest specificity and sensitivity estimated 89 and 71% respectively; the highest AUC= 0.732 corresponds to the predicted probability (p=0,004, specificity=71%, sensitivity=68%). On T1C+ Median-intensity (p=0.001, AUC=0.766), Quantile25 (p=0.001, AUC=0.764) and Quantile10 (p=0.002, AUC=0.749) were combined and the PP gave an AUC=0.726 with highest sensitivity of 83% and specificity of 85%. On T1WI: “cluster shade” (P= 0.023 AUC=0.693, specificity of 60% and sensitivity 69%) and Skewness (P= 0,042 AUC=0.672, specificity=60% and sensitivity=67%) were significant to differentiate astrocytoma and oligoastrocytoma; on T1WIC+ over 30 textural parameters were significant and more than 10 recorded the maximal value of AUC (=1) with specificity and sensitivity of 100%.DISCUSSION
For general consideration we recall satisfactory results with highest specificity and sensitivity around 95% and 90% respectively while differentiating astrocytoma and oligodendroglioma. T1WIC+ was more sensitive when comparing astrocytoma WHO II and oligodendroglioma WHO II (AUC=0.929, sensitivity=95% and specificity=89%), however T2WI and TIWI had recorded high values as well. Pathological enhancement following Gadolinium results from paramagnetic compound in the interstitium due to the non-specific increase of blood-brain barrier permeability; also low grade oligodendrogliomas are described with higher vasculature compared to low grade astrocytoma. Regarding the general comparison between “all grades” astrocytomas and “all grades” oligodendrogliomas, T1WI showed better results with sensitivity and specificity of 89% and AUC of 0.84. Many studies recalled same outcomes even using different, more heterogeneity sensitive, sequences [1,2,3] and also give the place and strength of conventional MRI sequences [4,5].CONCLUSION
Gliomas tissues are heterogeneous in nature, and during malignant transformation the histopathological features of the tumors change substantially, reflecting alterations in tumor microstructure. Texture Analysis, which determines tumor heterogeneity, shows usefulness in diagnostic accuracy between Astrocytoma, Oligoastrocytoma and Oligodendroglioma with conventional MR image sequences.Acknowledgements
Professor Miao, Ms Han Liang, Ms Bingbing, Salim Shesnia, all the persons who participated to this work.References
1. Tozer D.J, Jager H.R, Danchaivijitr N., et al. Apparent diffusion coefficient histograms may predict low-grade glioma subtype. NMR Biomed 2007;20:49–57.
2. Jenkinson M.D, Du Plessis D.G, Smith T.S, Joyce K.A, Warnke P.C, Walker C., Histological growth patterns and genotype in oligodendroglial tumours: correlation with MRI features. Brain 2006;129:1884–91. 3. Emblem K.E., et al, Histogram Analysis of MR Imaging–Derived Cerebral Blood Volume Maps: Combined Glioma Grading and Identification of Low-Grade Oligodendroglial Subtypes, AJNR Am J Neuroradiol 29 (Oct 2008) 1664–70.
4. UPADHYAY N, WALDMAN A. D., Conventional MRI evaluation of gliomas,The British Journal of Radiology, 84 (2011), S107–S111. Brown R., Zlatescu M., Sijben A., et al., The use of magnetic resonance imaging to noninvasively detect genetic signatures in oligodendroglioma. Clin Cancer Res 2008;14:2357–62
Figures