2640
Renal Relaxivity Mapping at 3.0 T for the Diagnosis of Chronic Kidney Disease – Initial Experience1Department of Physics, University of Colombo, Colombo 03, Sri Lanka, 2Department of Radiology and Neuroradiology, National Hospital of Sri Lanka, Colombo, Sri Lanka, 3Philips Health Systems, Philips India Ltd, Bangalore, Karnataka, India, 4Philips Health Systems, Philips India Ltd, Gurgaon, Haryana, India
Synopsis
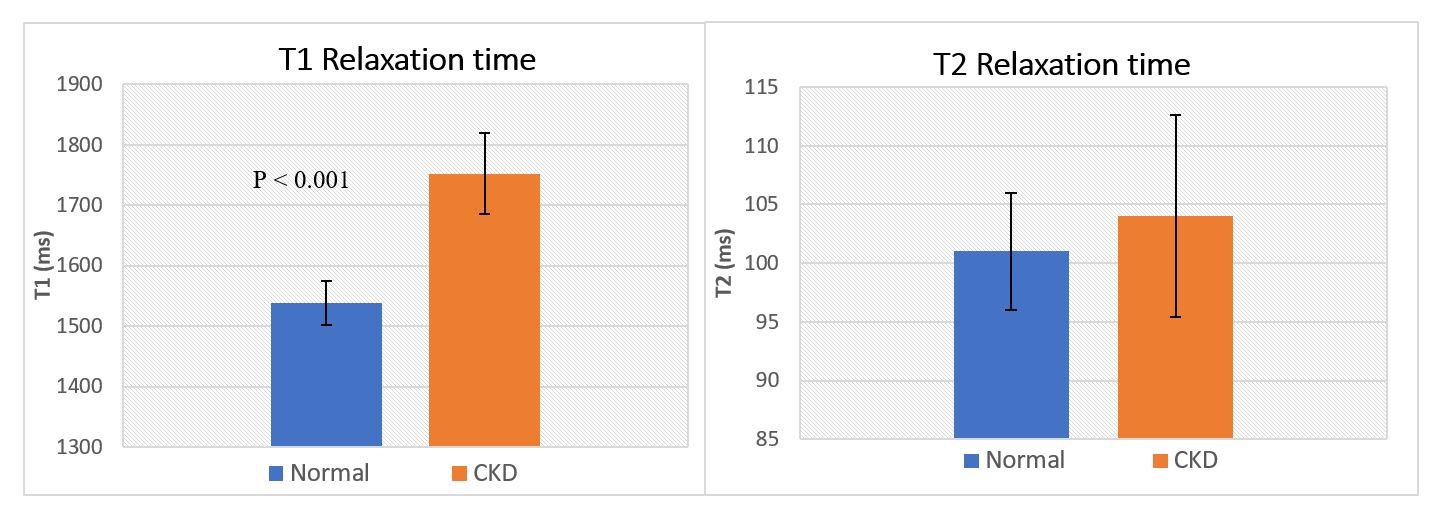
Detection of early stage Chronic Kidney Disease (CKD) is essential to improve patient outcome but remains a challenge. In this study we generated T1 and T2 maps of renal cortex at 3.0 T in CKD patients and healthy volunteers (n=16). Modified Look-Locker sequence with simulated ECG and a multi-echo Gradient and Spin-Echo sequence were used to generate T1 and T2 maps respectively. T1 of CKD kidney (1752 ± 45 ms) was significantly higher (P < 0.001) than that of healthy kidney (1538 ± 37 ms). There was no significant difference between the groups in T2, FWHM and skewness of T2.
Introduction
Chronic kidney disease (CKD) is the presence of kidney damage that has lasted for more than three months, with abnormal albumin excretion or decreased kidney function, quantified by measured or estimated Glomerular Filtration Rate (eGFR).1 CKD is recognized as a major public health challenge and a leading cause of morbidity and mortality.2 The standard biomarkers for diagnosis, classification and staging of renal disease are the estimated glomerular filtration rate (eGFR < 60 mL/min/1.73 m2 for 3 months or more) and albuminuria (albumin-to-creatinine ratio >30 mg/g).3,4 However, this classification inherently implies that renal impairment is likely to progress in these patients. Thus, the challenge is to find early markers of CKD. The purpose of this study was to investigate the feasibility of using MR relaxation maps (T1 and T2) to identify CKD kidneys.Methods
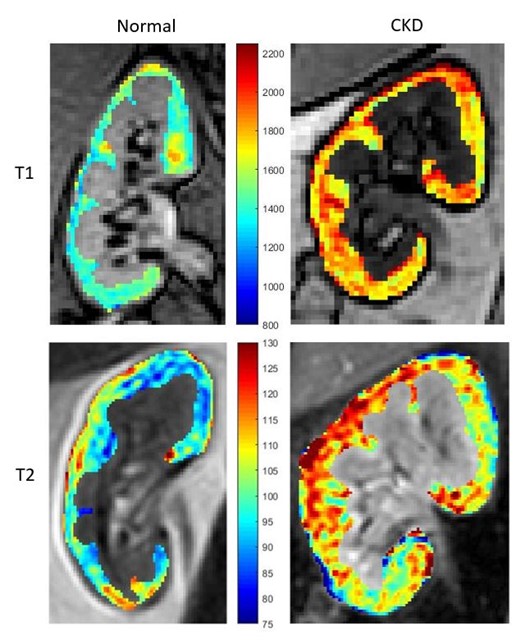
In this study, sixteen age matched (08 CKD patients and 08 healthy volunteers, age range 37 to 68 years) subjects were scanned at a multi-transmit RF enabled 3.0 T MRI system (Ingenia, Philips, The Netherlands) using a standard anterior coil. This study was approved by the institutional ethical committee. All CKD patients, included in this study were diagnosed with elevated serum-creatinine levels and were categorized as stage 2 and 3A depending on eGFR.5 Healthy volunteers had no clinical evidence of renal disease. All scans were acquired under breath-hold to reduce motion artifact. For T1 mapping in kidney, standard Modified Look-locker sequence (MOLLI) 6 available at the scanner with image parameters: TE/TR=1/3 ms, matrix size=160×160, number of echoes=9, slice thickness=5 mm, FOV=30×30 cm2 were used. Simulated ECG was used to trigger the MOLLI sequence. For T2, multi-echo Gradient and Spin-Echo (GraSE) sequence with the image parameters: TE/TR = 10/900 ms, number of echoes=9, matrix size=160×160, slice thickness=5 mm and FOV=30×30 cm2 were used. Kidney relaxivity maps were generated off-line using a home-written script in Matlab (The MathWorks, Inc., Natick, Massachusetts, United States). For T1 estimation, pixel wise nonlinear least squares fittings were performed using three parameter model equation $$$A + Be^\frac{-TI}{T1\star}$$$ where A and B are fitting constants, followed by the correction $$$T1 = T1^\star\times(\frac{B}{A}-1)$$$ where T1* is the apparent T1.6 T2 relaxivitiy of kidney cortex was derived using three parameter model equation $$$Ae^\frac{-TE}{T2}+C$$$.7 Full Width at Half Maximum (FWHM) and skewness were calculated for T2 distributions per subject. Kidney cortex was segmented manually on both right and left kidneys based on the T1 maps by an experienced radiologist. Two sample T test assuming unequal variance was performed.Results
T1 of CKD kidney cortexes (1752 ± 45 ms) were significantly higher than that of healthy kidney cortexes (1538 ± 37 ms) (P<0.001), while there was no significant difference between the groups in T2 values: CKD 104 ± 9 ms and Normal: 101 ± 5 ms. There was no significant difference in the FWHM values of T2, between CKD kidneys (14 ± 4 ms) and healthy kidneys (12 ± 2 ms). The mean skewness of T2 distribution for CKD kidneys (0.60 ± 0.75) was not significantly different to that of the healthy kidneys (0.16 ± 0.29).Discussion
The MOLLI sequence, originally used for cardiac T1 measurements proved to be a robust technique for the kidney reducing the breath-hold time to less than 12 seconds with a Sense factor of 2. Our results confirms the previous studies showing significant elevation of T1 in the kidney cortex of CKD patients.8,9 Increase in kidney T1 could be pointing to advance parenchymal fibrosis and architectural distortion similar to that found in liver fibrosis.10 Future kidney biopsy studies could use T1 maps to target biopsies for better diagnosis. Although cardiac MRI studies have shown decreasing T2 with increasing fibrosis,11 T2 results of this study were not significantly different between CKD and healthy subjects possibly due to the presence of confounding factors such as inflammation that tends to increase T2.Acknowledgements
No acknowledgement found.References
1. Thomas R, Kanso A, Sedor JR. Chronic Kidney Disease and Its Complications. Prim Care - Clin Off Pract. 2008;35(2):329-344.
2. Lozano R, Naghavi M, Foreman K, et al. Global and regional mortality from 235 causes of death for 20 age groups in 1990 and 2010: A systematic analysis for the Global Burden of Disease Study 2010. Lancet. 2012;380(9859):2095-2128.
3. Levey AS, de Jong PE, Coresh J, et al. The definition, classification, and prognosis of chronic kidney disease: a KDIGO Controversies Conference report. Kidney Int. 2011.
4. Levey AS, Eckardt KU, Tsukamoto Y, et al. Definition and classification of chronic kidney disease: a position statement from Kidney Disease: Improving Global Outcomes (KDIGO). Kidney Int. 2005;67(6):2089-2100.
5. National Institute for Health and Care Excellence (NICE). Chronic kidne kidney y disease in adults : assessment and management. 2015;(January):Available from https://www.nice.org.uk/guidance/cg.
6. Messroghli DR, Radjenovic A, Kozerke S, Higgins DM, Sivananthan MU, Ridgway JP. Modified look-locker inversion recovery (MOLLI) for high-resolution T 1 mapping of the heart. Magn Reson Med. 2004;52(1):141-146.
7. Akçakaya M, Basha TA, Weingärtner S, Roujol S, Berg S, Nezafat R. Improved quantitative myocardial T2 mapping: Impact of the fitting model. Magn Reson Med. 2015;74(1):93-105.
8. Gillis KA, McComb C, Patel RK, et al. Non-Contrast Renal Magnetic Resonance Imaging to Assess Perfusion and Corticomedullary Differentiation in Health and Chronic Kidney Disease. Nephron. 2016;133(3):183-192.
9. Cox EF, Buchanan CE, Bradley CR, et al. Multiparametric renal magnetic resonance imaging: Validation, interventions, and alterations in chronic kidney disease. Front Physiol. 2017;8(SEP):1-15.
10. Li Z, Sun J, Hu X, et al. Assessment of liver fibrosis by variable flip angle T1 mapping at 3.0T. J Magn Reson Imaging. 2016;43(3):698-703.
11. Loganathan R, Bilgen M, Al-Hafez B, Smirnova I V. Characterization of alterations in diabetic myocardial tissue using high resolution MRI. Int J Cardiovasc Imaging. 2006;22(1):81-90.
Figures