2639
Free-Breathing Motion Insensitive T1-Weighted Spine MRI in Children Using a Radial Acquisition at 3 Tesla1Radiology, Nationwide Children's Hospital, Columbus, OH, United States, 2Radiology, New York University Medical Center, New York, NY, United States
Synopsis
MRI methods that are insensitive to physiological motion are attractive in pediatric applications. In this work, we compare a 3D T1-weighted radial acquisition with conventional multi-slice TSE in post-contrast spine imaging at 3T in seven patients. Images were rated by three neuroradiologists. Radial data were perceived as more diagnostic than TSE and Cartesian TSE data were significantly more impacted by motion and pulsation. Qualitatively, radial images yielded improved spinal cord to CSF signal contrast and better conspicuity of nerve roots than TSE data. In evaluating secondary CSF tumor spread, radial spine MRI provides a confident "first-time-right" protocol than TSE scans.
INTRODUCTION
Free-breathing MRI scans are highly applicable in pediatric imaging as they reduce the need for unnecessary sedation and long breath-holds. The scans also negate the need for the patient to follow technologist instructions on breath-holding, and are helpful when patients have difficulty comprehending or do not speak the communication language. MRI methods that are inherently insensitive to physiological motion are also attractive as they remove the need for signal gating. We evaluate herein a radial "stack of stars" gradient echo acquisition called RAVE-RAdial Volumetric Encoding (e.g. Siemen’s radial VIBE) [1, 2] in post-contrast spine imaging. We compare RAVE results with conventional Cartesian multi-slice TSE, a commonly used sequence in spine MRI. The benefits of radial spine MRI in children was previously shown at 1.5T [3]. In this work, we assess whether RAVE can replace traditional T1-weighted TSE spine imaging at 3T, where physiological motion and pulsation frequently hamper diagnostic image quality in visualizing metastases along the spinal cord and cerebrospinal fluid (CSF).METHODS
Studies were performed on a 3T Siemens PRISMA using the posterior array. We retrospectively reviewed seven (4F, 3M) patients for this pilot study (age:15±3y) who were scheduled for routine non-sedated exams of their whole-spine with contrast for clinical indications and who had both TSE and RAVE scans performed. Parameters for axial TSE were: 0.6mm in-plane resolution, 5mm slices with 5-6mm gap, TR/TE 610/9.1ms, no parallel imaging, two signal averages, bandwidth 270Hz/pixel, 150o refocusing angle, echo train length 3, and anterior suppression slabs over the chest and abdomen. Typically, 30-40 slices are acquired per station, and multiple overlapping stations are prescribed to cover the cervical, thoracic, and lumbar spine. The RAVE stack-of-stars was a 3D spoiled GRE sequence with: 0.7mm in-plane resolution, 3mm contiguous slices, TR/TE 4.5/2.1ms, 600-700 spokes per slice, 10% slice oversampling, no parallel imaging, no suppression slabs, frequency-selective fat suppression, bandwidth 490Hz/pixel, and 50-70 slices per station. Consecutive radial spokes within each kz-encoded plane are rotated by the golden-angle. Both sequences were performed after Gadavist contrast administration, with TSE first. All data were acquired free-breathing and without triggering. RAVE data were reconstructed using the online Siemens ICE framework. Typical scan times for the TSE were 4-5min per station. The RAVE sequence yields 20-30% more slices in the same time period. Three attending pediatric neuroradiologists independently compared the two sequences and were asked the following questions: Are the TSE and RAVE images diagnostic? Are the TSE and RAVE images affected by motion, blurring, and CSF pulsation? Could the diagnosis have been made with RAVE only? For each of these questions, we utilized a simple 3-choice scale (No, Partial, Yes). Kappa statistic and Mann-Whitney U test were computed.RESULTS
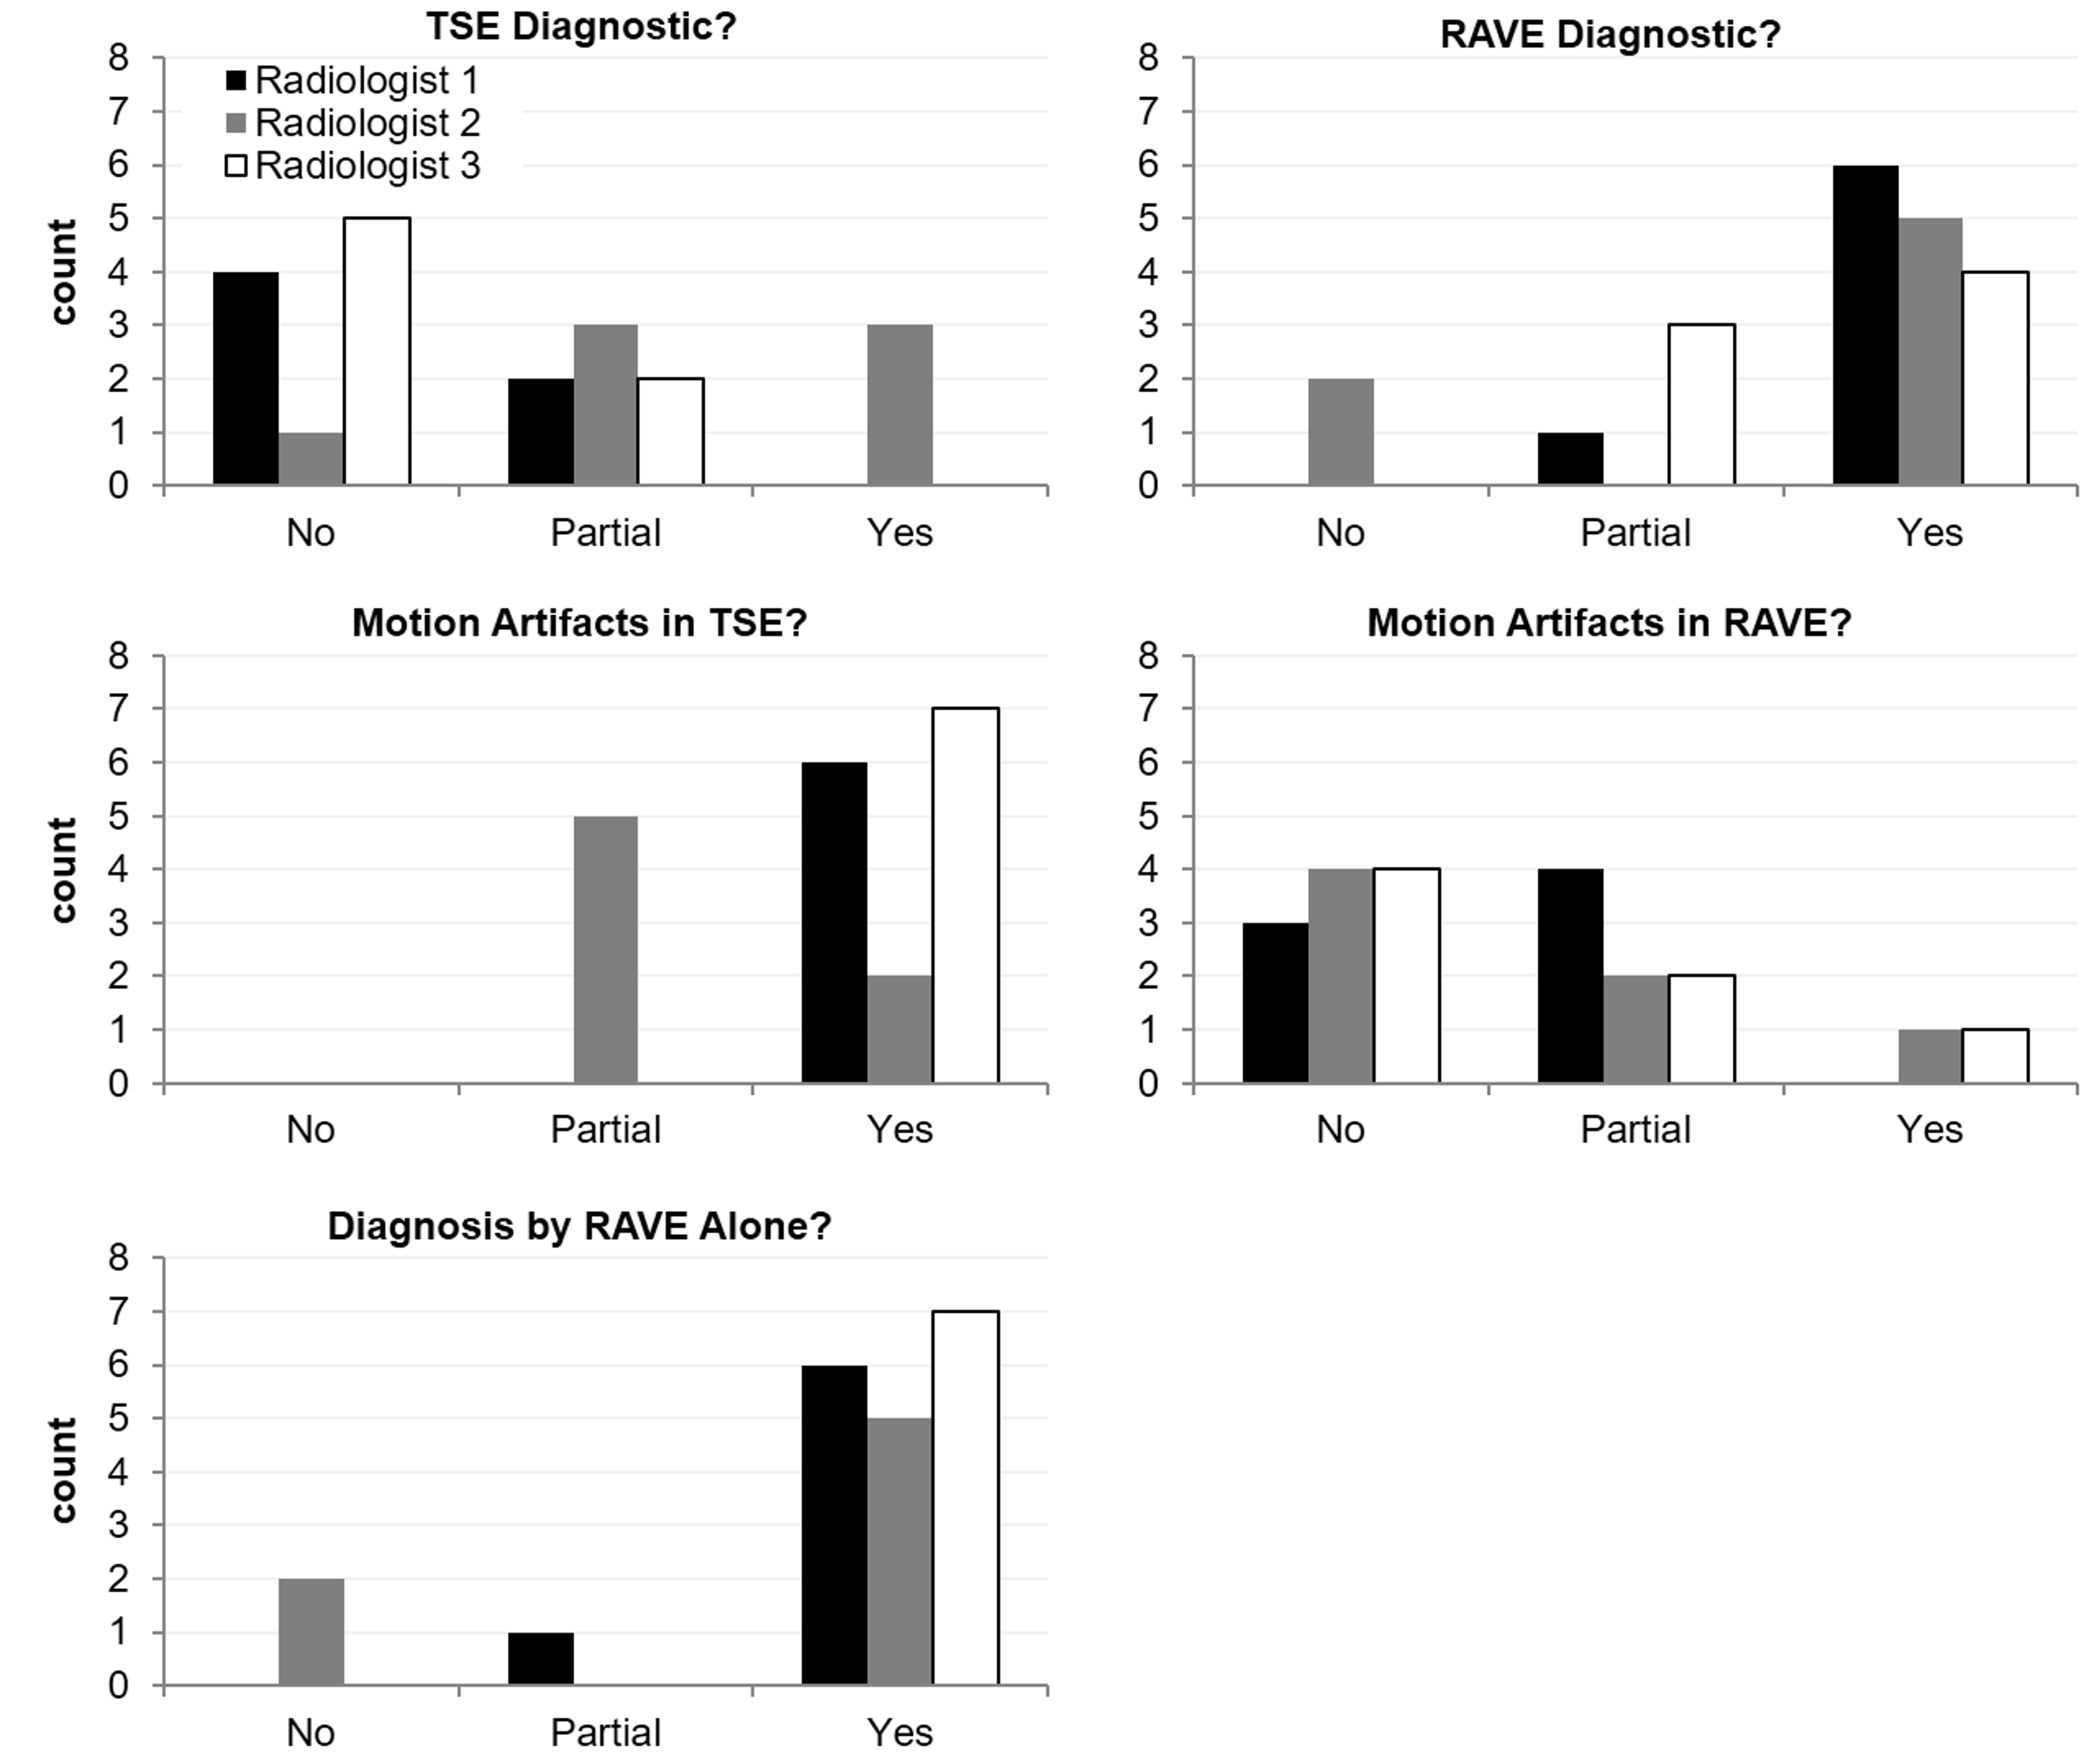
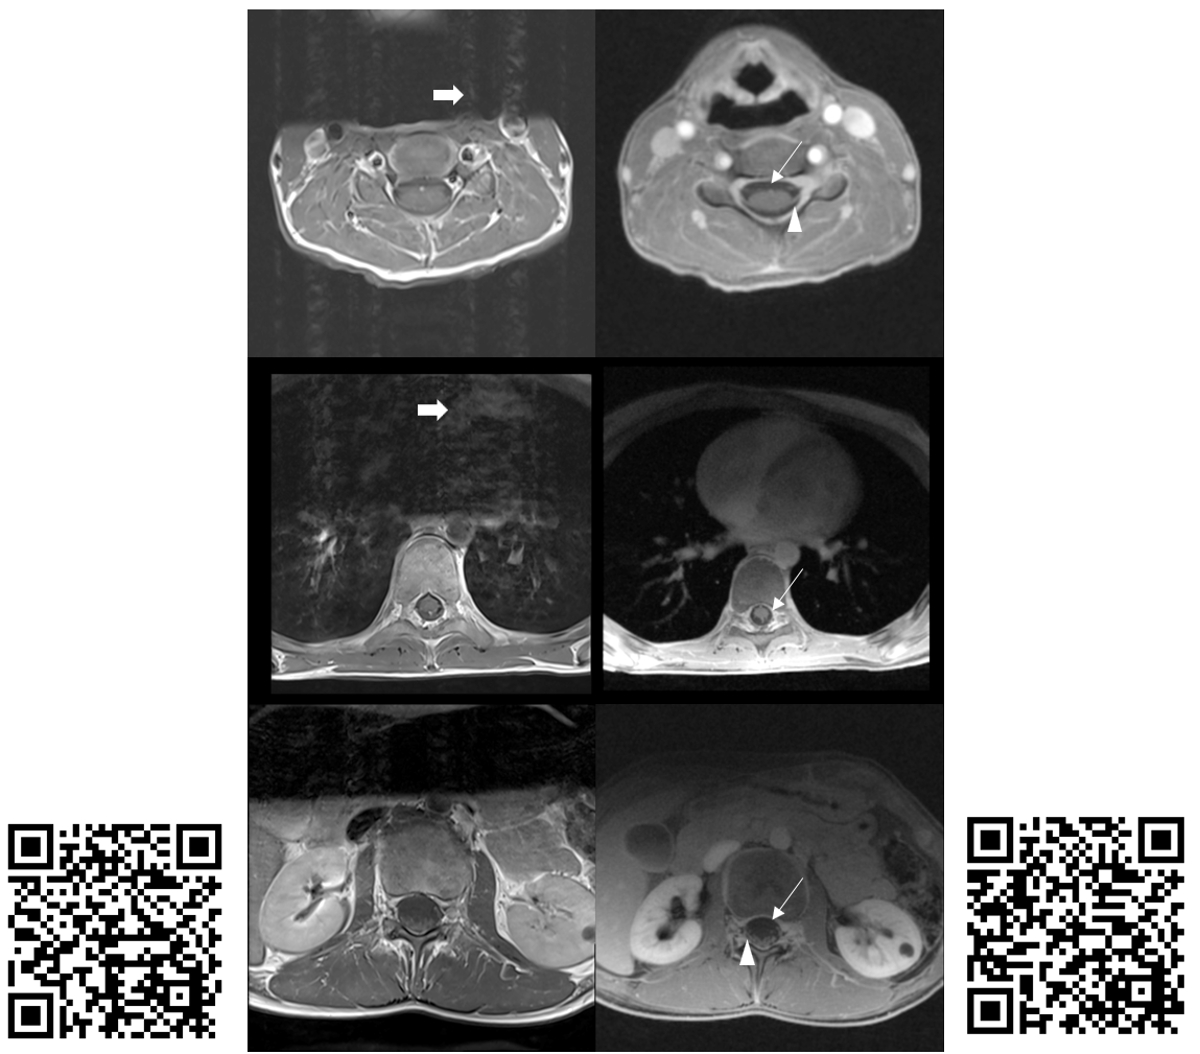
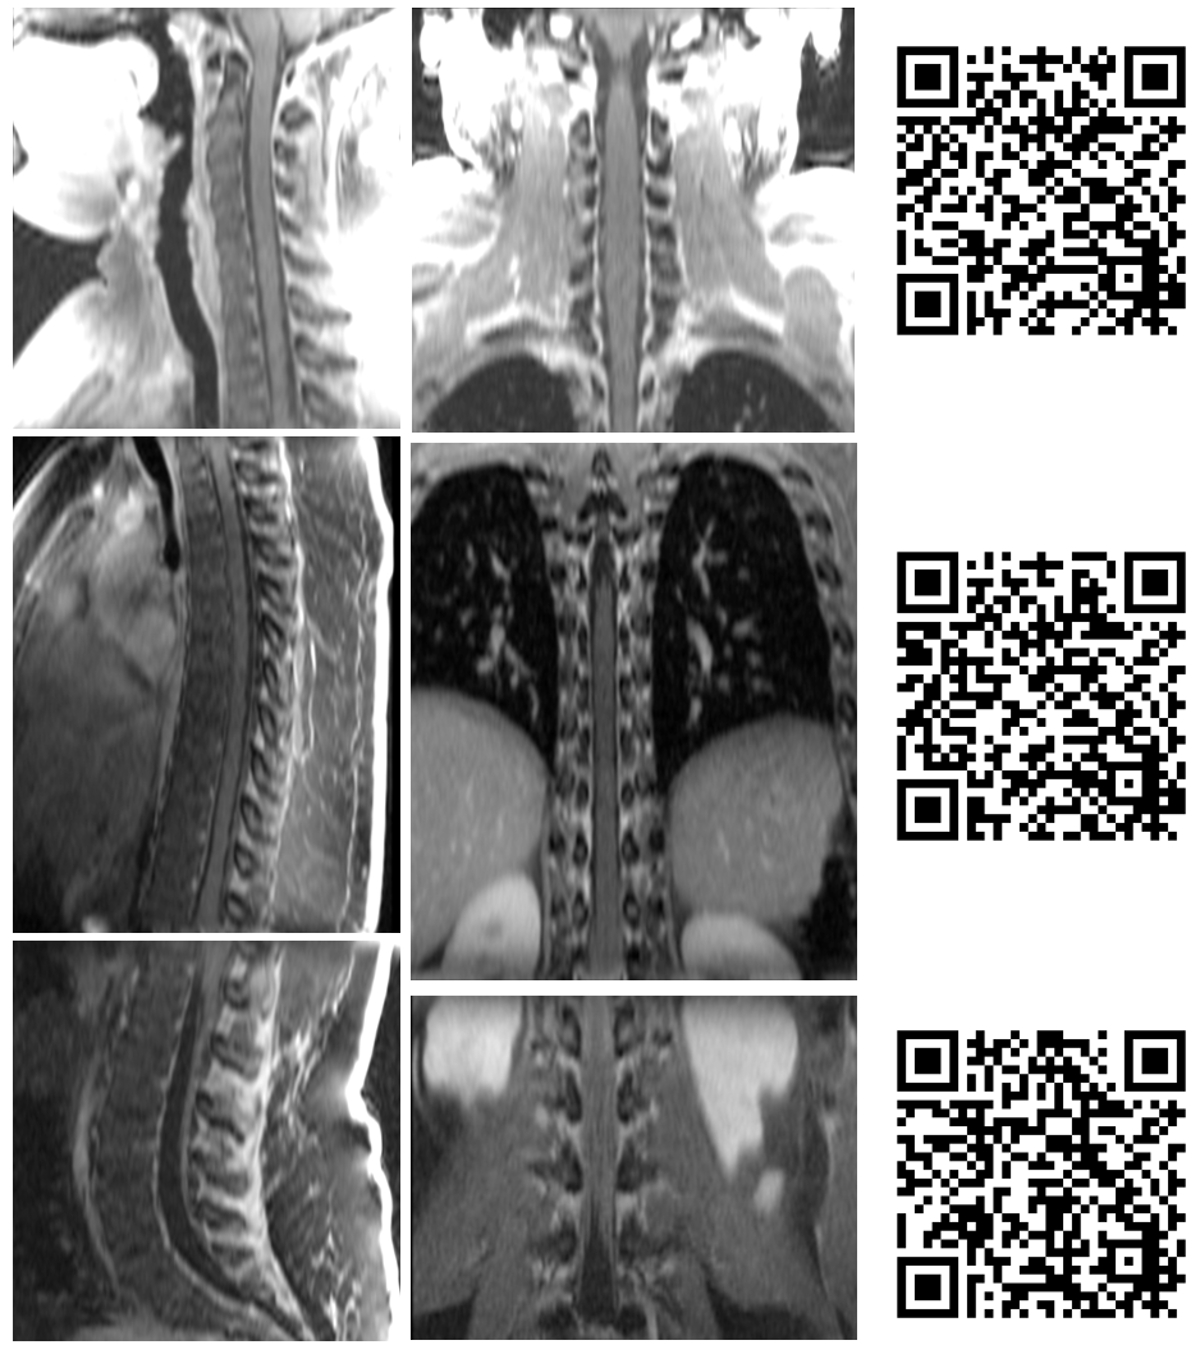
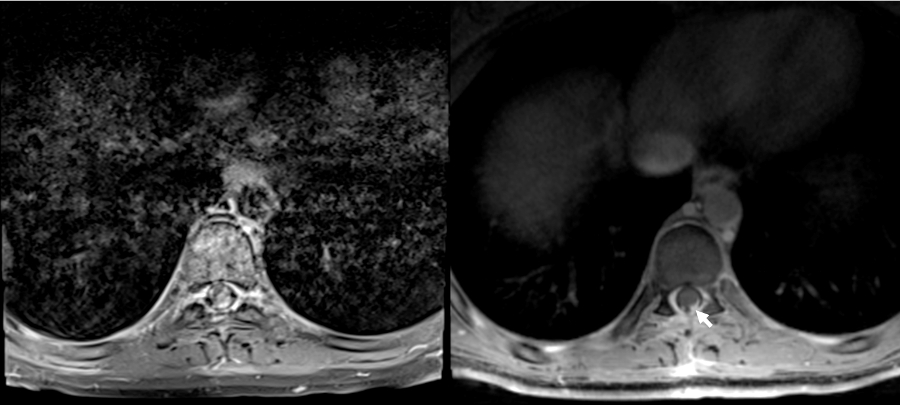
Figure 1 summarizes the evaluation scores. Despite some variability amongst the three raters, the data trend shows RAVE data to be perceived as more diagnostic than TSE (p<0.05), and relatedly that TSE data were significantly more impacted by motion and CSF pulsation than RAVE (p<0.05, Mann-Whitney U-test). Overall, the neuroradiologists found the RAVE images to yield improved spinal cord to CSF signal contrast and better conspicuity of nerve roots than TSE data. The Fleiss' Kappa coefficient was 0.38 for all three raters. Pair-wise Cohen's Kappa coefficients between radiologists 1 and 2, 2 and 3, and 1 and 3 were 0.28, 0.28, and 0.59, respectively. Pooling the results together, the maximum count per score category is 21 (7 patients x 3 radiologists). For determining whether each sequence's images were of diagnostic quality, 47.6% (10 counts) deemed TSE non-diagnostic, while 71.4% (15 counts) deemed RAVE diagnostic; conversely, 71.4% (15 counts) identified TSE to have motion-corrupted artifacts that impacted visualization of the spinal cord, while only 9.5% (2 counts) identified motion-related blurring in RAVE; finally, 85.7% (18 counts) determined RAVE to be adequate alone for patient diagnosis, rendering the TSE sequence unnecessary. Figures 2-4 illustrate representative examples from three patients.CONCLUSION
Our pilot data demonstrates the utility of a 3D T1-weighted radial technique in non-sedated pediatric post-contrast spine and spinal cord imaging. The technique affords pediatric patients greater comfort by allowing them to free-breathing while yielding diagnostically useful images nearly free of motion and CSF pulsation artifacts. In comparison to the 1.5T study by Cho, et al. [3], we were able to achieve slightly thinner slices with RAVE in this study at 3T. For patients with primary brain tumors, the presence of secondary CSF tumor spread is the single most critical outcome for the post-contrast spine exams, and RAVE provides neuroradiologists with a more robust and confident "first-time-right" protocol than conventional TSE scans.Acknowledgements
The authors thank Siemens for support, in particular Ning Jing, Chris Boyea, Stuart Schmeet, Christianne Leidecker, and Christian Eusemann.References
[1] Chandarana H, Block TK, Rosenkrantz AB, et al. Invest Radiol 2011; 46:648–653. PMID: 21577119.
[2] Chandarana H, Feng L, Ream J, et al. Invest Radiol. 2015 Nov;50(11):749-56. PMID: 26146869.
[3] Cho HH, Choi YH, Cheon JE, et al. AJR. 2016 Jul;207(1):177-182. PMID: 27070492.
Figures