2638
Mapping metabolic activation as FDG-PET/Amyloid-PET using Contrast-free MRI and Deep Learning1Electrical Engineering, Stanford University, Stanford, CA, United States, 2Radiology, Stanford University, Stanford, CA, United States
Synopsis
MRI has great clinical values to distinguish soft-tissues without contrast or radiation. By using the hybrid-modality information from MRI and PET, here we developed deep learning method to synthesize metabolic activity mapping from contrast-free multi-contrast MRI images. Trained on clinical datasets, we demonstrated the feasibility to estimate metabolic biomarker from contrast-free MRI and validated on both FDG-PET/MRI and Amyloid-PET/MRI in-vivo datasets. This technique can be used for more efficient, low-cost, multi-tracer functional imaging, exploring anatomy-function relationship, visualizing new bio-markers and improving the workflow for both MRI and PET/MRI.
Introduction
MRI and Positron Emission Tomography (PET) images complementary information. PET is a powerful functional imaging tool to quantify the metabolic activation, which can be used to detect pathology such as tumor and neurological diseases. Despite of the advantages, PET still suffers some disadvantages due to the radiation risk from radioactive tracers, complicated imaging preparation and high costs. MRI, on the other hand, has advantages to distinguish soft-tissues without contrast or radiation. Besides, contrast-free functional MRI techniques, such as Arterial Spin Labeling (ASL), also show indirect reflection of the metabolic activities that can potentially be used as biomarkers for pathology.
By using the hybrid modality information from PET/MRI, here we evaluated the possibility to accurately estimate metabolic activities, original measured using either FDG-PET or Amyloid-PET, from contrast-free MRI images, which will provide a new way for metabolic biomarker from MRI, highlight the function-anatomy relationship and optimize MRI protocol designs.
Method
1. Simultaneous PET/MRI Datasets
FDG-PET/MRI and Amyloid-PET/MRI images were acquired in neuro exams using simultaneous time-of-flight enabled 3.0 Tesla PET/MRI system (Signa, GE Healthcare, Waukesha, WI). The datasets are collected on 10 Glioblastomas (GBM) patients for FDG-PET/MRI and another 20 subjects (include both healthy-control and AD patients) for Amyoid-PET/MRI.
2. Prediction models
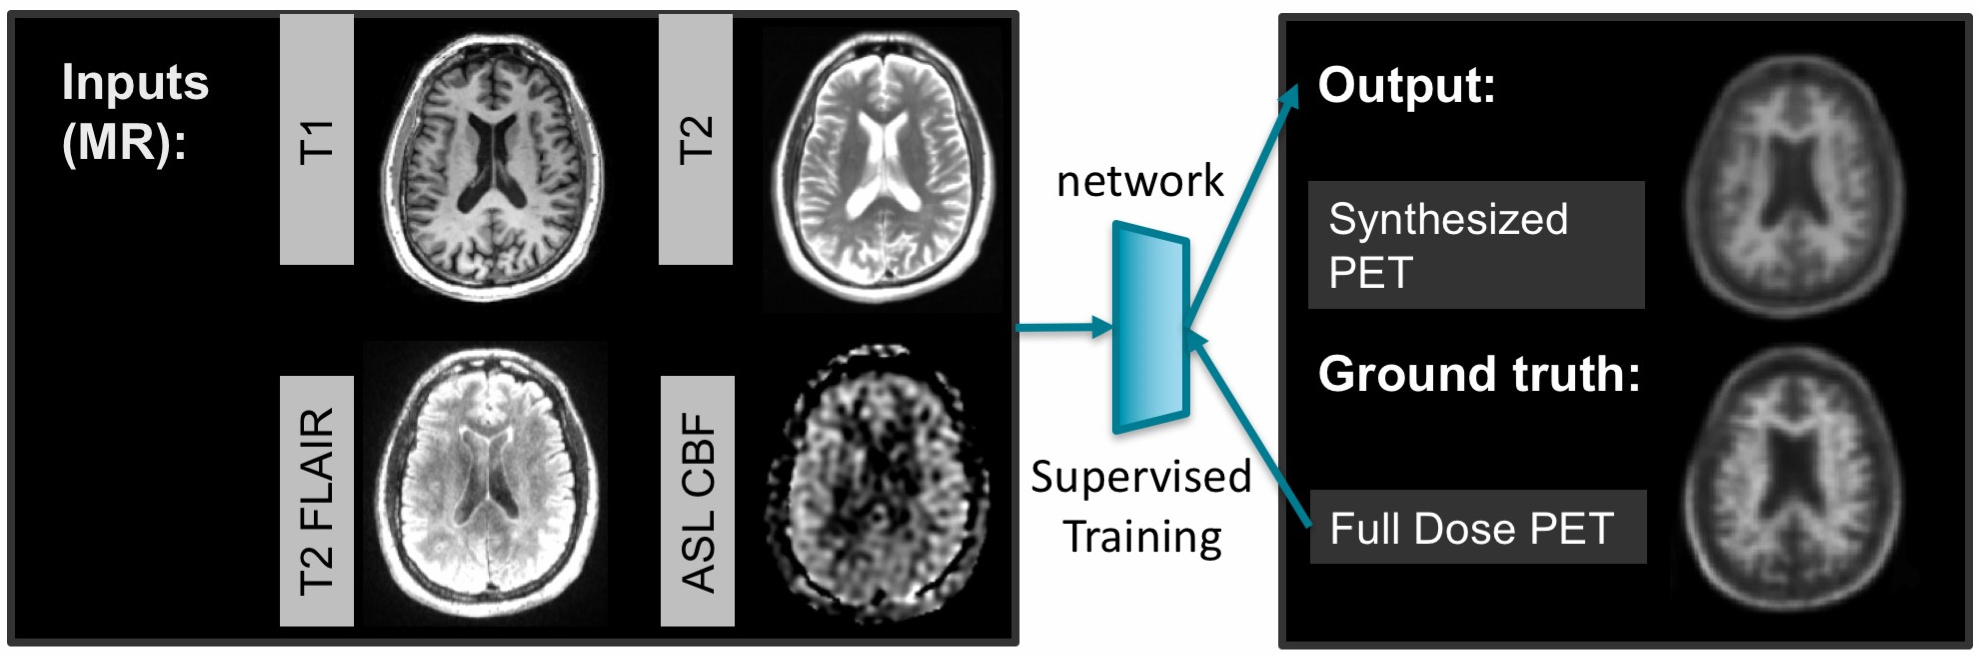
As shown in Figure 1, we propose to use a subset of images acquired in contrast-free MRI scans, including ASL, FLAIR, T1w and T2w MR images, to predict the metabolic information as in PET image.
By using ASL and other anatomical MRI scans as inputs, with normalized metabolic activities measured from PET as ground-truth reference, a U-Net deep network model[1, 2] was trained to output the approximated metabolic signals. This network structure is commonly used for medical imaging segmentation and regression.
3. Evaluation
5-fold cross-validation was used to evaluate the performance in which the model is trained on 80% subset of subjects and applied on the other 20% datasets. The performance was evaluated using quantitative similarity metrics: PSNR, SSIM and normalized Mutual Information(MI).
Results
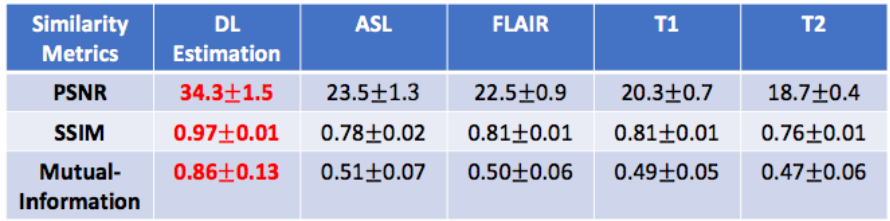
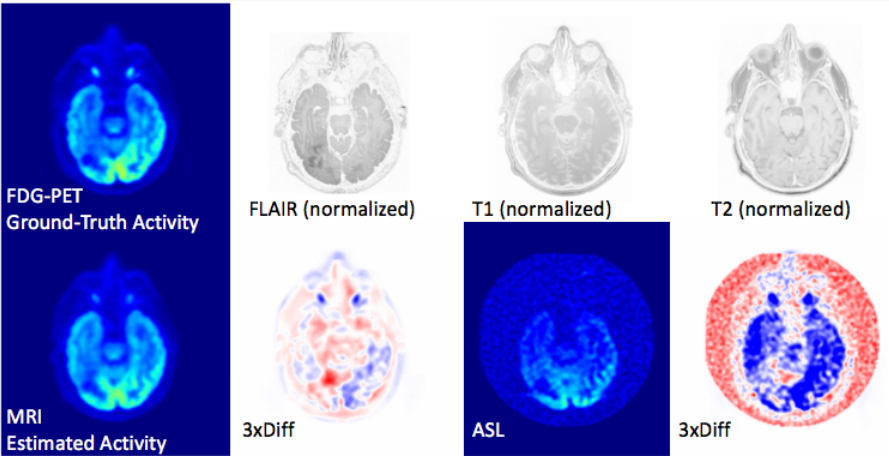
Evaluation on all testing slices and an example visualization was included here. Table 1 shows quantitative similarity metrics between the ground-truth metabolic activation originally measured using FDG-PET, with estimated metabolic map using the proposed method and with all raw MRI images. Figure 2 visualizes results of an axial slices with GBM cold-lesion and shows the proposed method can accurately predict the metabolic activation. On average, the estimated FDG-activation-liked metabolic achieves good approximation with $$$34.3\pm 1.5$$$ dB in PSNR, $$$0.97 \pm 0.01$$$ in SSIM and $$$ 0.86 \pm 0.13$$$ in Mutual Information. For comparison, the metrics from regression from ASL-MRI signal, which is the most similar MRI contrast to PET, is 23.5dB for PSNR, 0.78 for SSIM and 0.51 for MI.
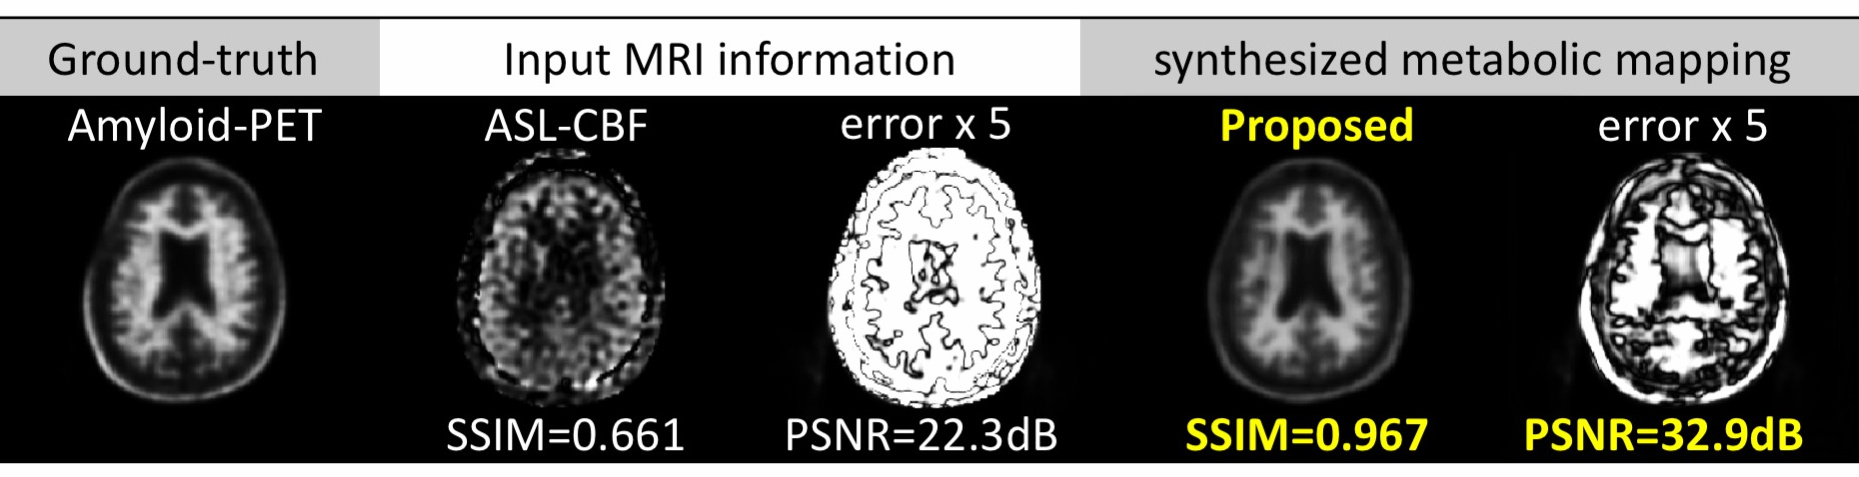
Similar results are shown for using MRI to map the information as in Amyloid-PET. Figure 3 shows example slices demonstrating accurate approximation for Amyloid-PET from MRI. With the proposed method, we can achieve over $$$10$$$dB gains in PSNR and more than $$$0.3$$$ SSIM improvements.
Discussion
Metabolic Mapping: Previous studies have shown the complementary values for diagnosis and volume definition by using hybrid modality of PET and MRI (ASL, FLAIR)[3, 4].The proposed method can extend this findings and further extrapolate values of PET/MRI. Quantitative analysis show the proposed method can accurately estimate metabolic activities using contrast-free radiation-free MRI.
Anatomy-function bio-marker: Also by estimating the PET based metabolic activities using MRI signals, we can also extract the necessary bio-markers that unavailable from either PET or MRI along. The residual differences between the MRI based estimation and the real PET signals can provide more insights to anatomy-function relationship.
Multi-tracer Imaging: In addition, with the proposed method, we can easily generate images visualizing the activity from multiple radioactive tracers, such as generating both FDG and Amyloid from a single PET/MRI scan or a MRI-only scan, which significantly improving imaging efficiency and values.
Conclusion
Using simultaneous PET/MRI, here we demonstrate the feasibility to estimate metabolic biomarker from contrast-free MRI images. This technique was validated on both FDG-PET/MRI and Amyloid-PET/MRI in-vivo datasets. It can be used for more efficient, low-cost, multi-tracer functional imaging, exploring anatomy-function relationship, and improving the workflow for both MRI and PET/MRI.Acknowledgements
No acknowledgement found.References
- Ronneberger, Olaf, Philipp Fischer, and Thomas Brox. "U-net: Convolutional networks for biomedical image segmentation." International Conference on Medical Image Computing and Computer-Assisted Intervention. Springer, Cham, 2015.
- Chen, Hu, et al. "Low-Dose CT with a Residual Encoder-Decoder Convolutional Neural Network (RED-CNN)." arXiv preprint arXiv:1702.00288 (2017).
- Chen, Y., et al. "Voxel-level comparison of arterial spin-labeled perfusion MRI and FDG-PET in Alzheimer disease." Neurology77.22 (2011): 1977-1985.
- Navarria, Pierina, et al. "Investigation on the role of integrated PET/MRI for target volume definition and radiotherapy planning in patients with high grade glioma." Radiotherapy and Oncology112.3 (2014): 425-429.
Figures