2637
Synthesis and analysis of low b value Diffusion Weighted Images at 10mT1Dayananda Sagar Institutes,Bangalore, Bangalore, India, 2Wipro-GE Healthcare, BANGALORE, India, 3Institute for Systems and Robotics /Department of Bioengineering, Instituto Superior Técnico, Universidade de Lisboa, Lisbon, Portugal, Lisbon, Portugal, 4BMS Institute of Technology and Management, BANGALORE, India, 5MIRC, Dayananda Sagar Institutes,Bangalore, BANGALORE, India, 6Dept. of Radiology, Columbia University Medical Center, New York, NY, New York, NY, United States
Synopsis
DWI MRI is a
Motivation and Clinical application:
Stroke can be a highly disabling disease and has severe impact on patient quality of life1. Diffusion-weighted (DW) Magnetic Resonance Imaging (MRI) is a well established method for stroke imaging within the critical operating window of approximately four to six hours. This requires an accessible, portable and cost effective MR solution typically achieved at very low magnetic fields. The goal of the current work is to evaluate the utility of low b value DWI at low field (10mT).Impact:
The evaluation of low b value diffusion imaging of the brain at 10mT would enable insights into acquisition and reconstruction methods required to deliver a head imager. This could be potentially sited in unconventional spaces such as ambulances, emergency response units, clinics, operation theatres and primary healthcare centres.Approach:
Generation of parametric maps at 1.5T and 10mT:
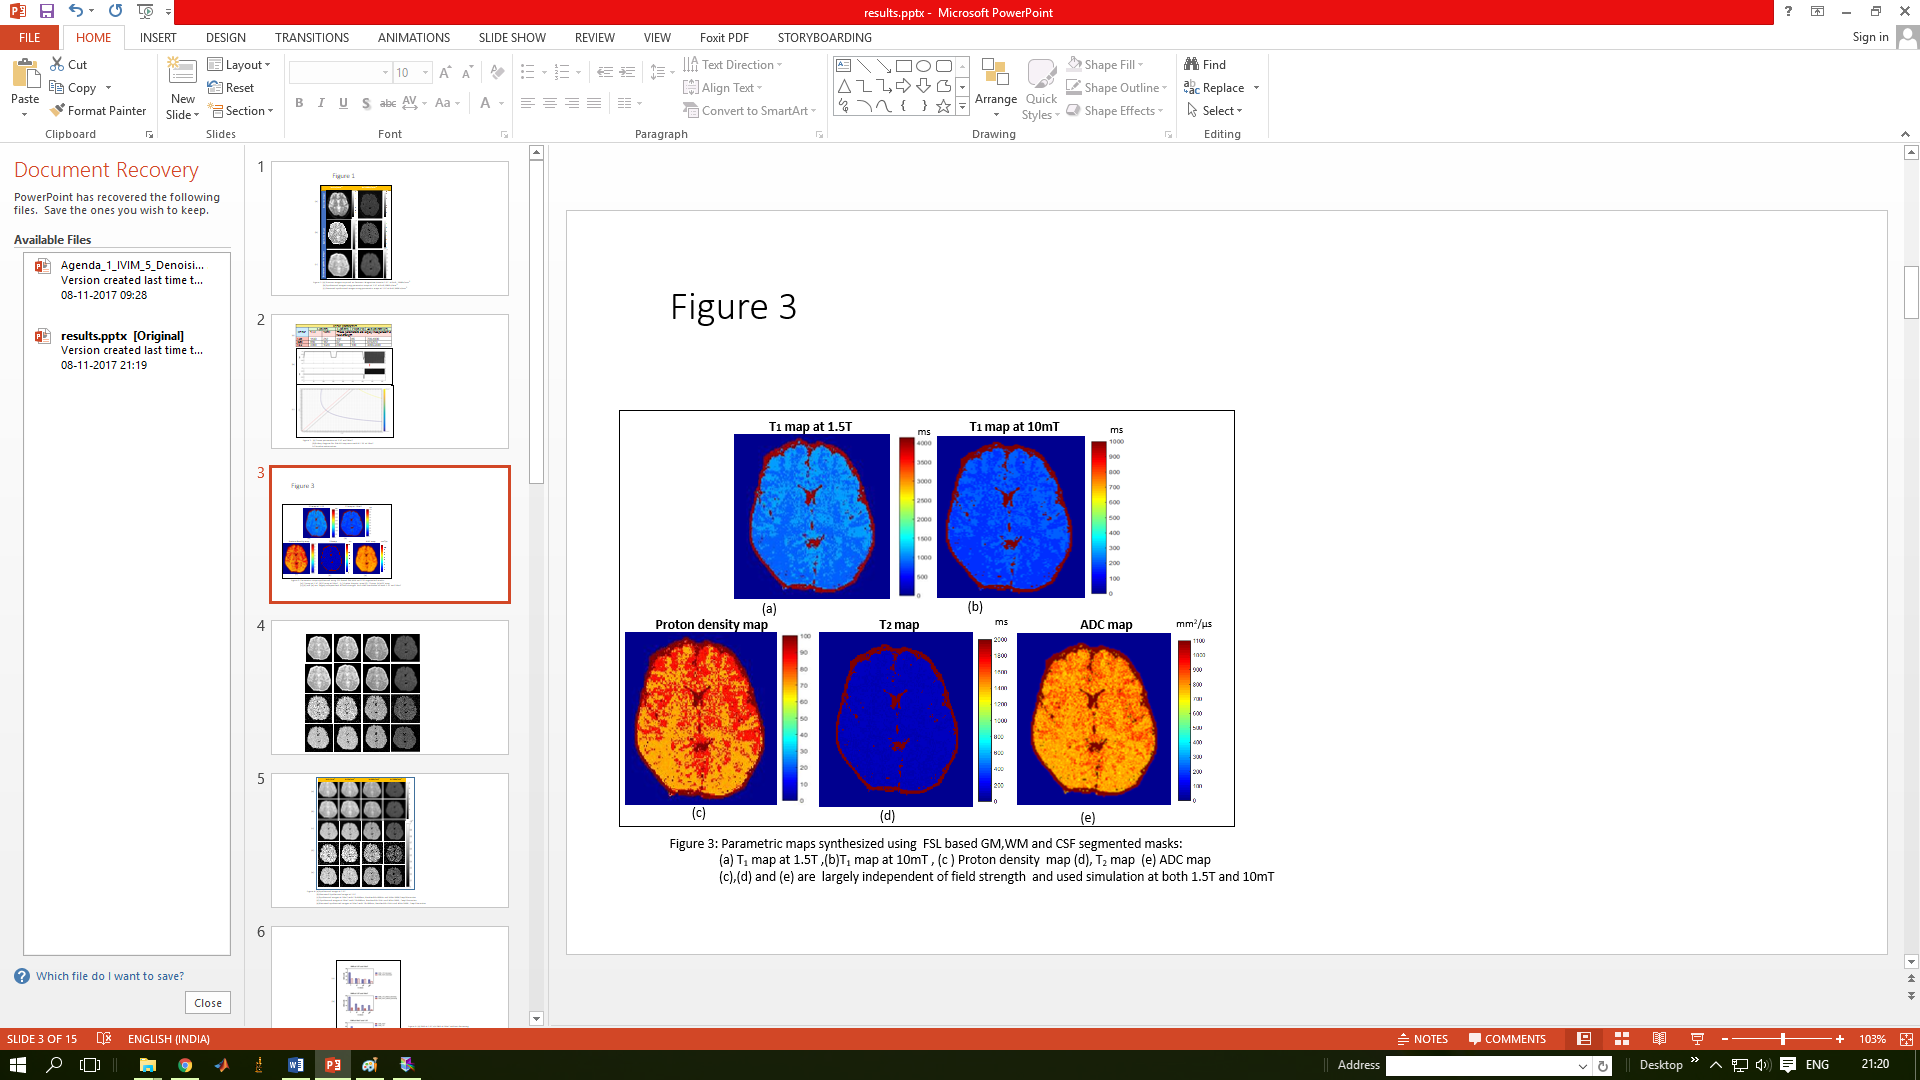
T1 weighted images of a human volunteer were acquired on Siemens Magnetom Avanto 1.5T clinical scanner in axial plane with a slice thickness of 5 mm, a matrix size of 256 × 256 and TR/TE: 15/5ms using a GRE-VFA sequence with 6 flip angles. Skull stripping was performed using FSL’s Brain Extraction tool 2. FSL's Automated Segmentation Tool was employed to generate gray matter (GM), white matter (WM) and cerebrospinal fluid (CSF) segmented mask by employing T1 weighted images. T1 values at 10mT were computed based on the field dependency (T1αB01/3 ). T1 values for the two fields were validated with literature3, 4. Proton density (PD), T2 and Apparent Diffusion Coefficient (ADC) are largely independent of field strength. A 10% of deviation in each of these cases was included to allow for signal variations.
Synthesizing low b value DWI at 1.5T:
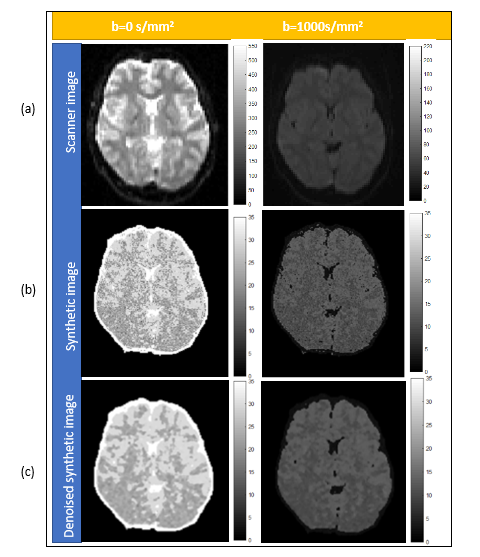
The signal equation including the diffusion term was employed to generate images with four different b values of 0, 20, 200, 1000s/mm2 and were validated with the images obtained from the scanner at b values of 0 and 1000s/mm2.
Conversion of 1.5T synthetic images to lower field and simulation parameters:
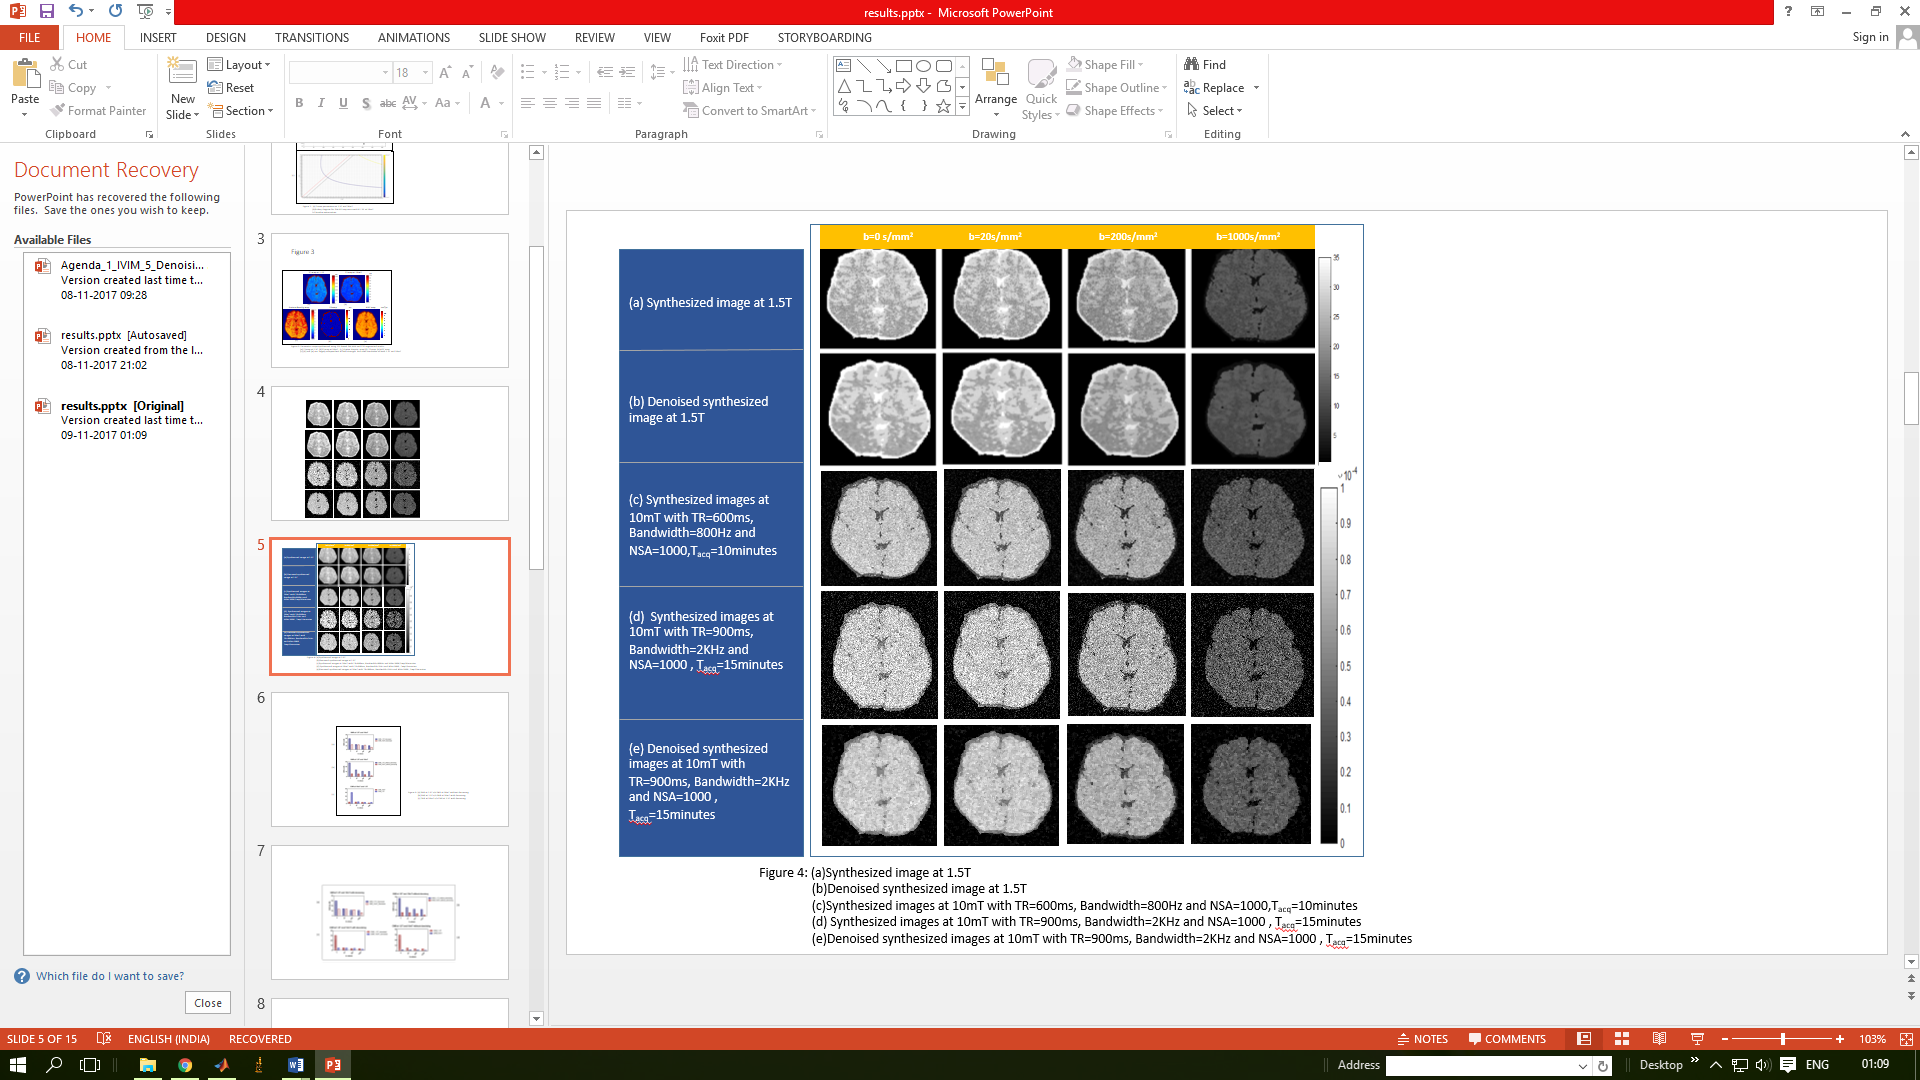
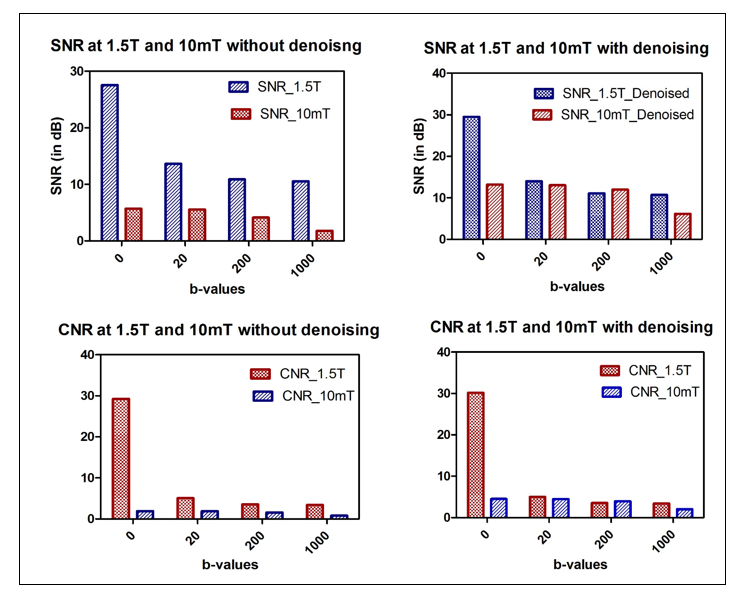
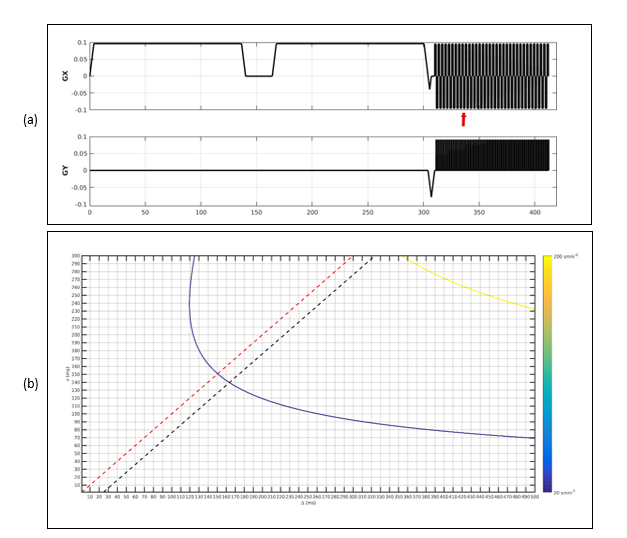
Simulation of 10mT data from 1.5 T synthetic data was performed in two phases: signal scaling and noise scaling as in ref5. In the signal scaling phase, the present work assumed that data has been acquired with uniform RF transmission, same geometry and a normalized noise covariance of the receiver coil at different field strengths. Hence a single global relaxation correction function f that represents the signal change due to different relaxation behaviors at different fields was employed as in ref5. Johnson noise of equal proportions to the body noise was included at 10mT6. Simulations were performed for specific total acquisition times of Tacq=10min and 15min with varying values of Repetition Time ranging from 600ms-9000ms, Bandwidth=800Hz, 1kHz and 2kHz, Number of Signal Averaging =100, 500 and1000.Further, synthesized images for TR = 600ms were denoised using a median filter to evaluate the effect of filtering. Signal to Noise Ratio and Contrast to Noise Ratios were computed for each b value at both the fields. A potential pulse sequence employing gradients with maximum amplitude of 1mT.m and a slew rate of 100T/m/s was utilized. b value contour plot was generated as a function of their duration δ and separation Δ
Preliminary data:
Parametric maps (PD, T1, T2 and ADC) were obtained from the method explained above and can be seen in Figure 1. It can be seen in figure 2 that the synthetically generated images and the scanner images at 1.5T are similarly scaled for the chosen b values. Figure 3 shows the affect of different acquisition parameters on the synthetic images at 10mT in comparison with the images at 1.5T. The scaling of intensities in these panels can be observed, with a marked loss in contrast between white and gray matter. These metrics are quantified in Figure 4 for both field strengths. Figures 5(a, b) depict the optimal simulation results that were obtained for a bandwidth of 800Hz. For a simulated matrix size N of 96 and partial Fourier factor of 0.7, the readout time before reaching the echo is 96´0.2´1.25=24ms. The optimal solution thus corresponded to the intersection between the desired contour plot and the black dashed line. For a gradient amplitude of 0.035mT/m, this resulted in d=140ms and D=164 ms for b=20 s/mm2, corresponding to TE=328ms.Conclusions:
The study demonstrates the use of synthetic parametric maps in simulating low b value images at 10mT for evaluating the role of diffusion imaging of the brain. The results indicate decrease of signal intensities with increased b values, as is expected with loss of contrast information. Current and future work involves application of deep learning methods to denoise and reconstruct low field images with 1.5T brain images as reference.Acknowledgements
- This work was supported by Department of Science and Technology under an Indo-Portugal Grant, Development of low field MRI scanner for stroke imaging, Int/Portugal/P-09 /2017
- Fundação para a Ciência e a Tecnologia
References
- Strong, Kathleen, Colin Mathers, and Ruth Bonita. "Preventing stroke: saving lives around the world." The Lancet Neurology 6, no. 2 (2007): 182-187
- https://www.fmrib.ox.ac.uk/fsl
- Nishimura, Dwight G. Principles of magnetic resonance imaging. Standford Univ., 2010
- Bernstein, Matt A., Kevin F. King, and Xiaohong Joe Zhou. Handbook of MRI pulse sequences. Elsevier, 2004.
- Wu, Ziyue, Weiyi Chen, and Krishna S. Nayak. "Minimum Field Strength Simulator for Proton Density Weighted MRI." PloS one11, no. 5 (2016): e0154711.
- Michal, Carl A. "A low-cost spectrometer for NMR measurements in the Earth's magnetic field." Measurement Science and Technology 21, no. 10 (2010): 105902.
Figures