2634
Added value of a management software tool for optimization of clinical MRI workflow1Radiology, Antwerp University Hospital, Antwerp, Belgium, 2GE Healthcare, Buc, France
Synopsis
MRI has important drawbacks like slow speed and high cost, which makes it a challenge to maintain cost-effectiveness in context of the changing healthcare economic environment. We show that a management software tool, giving easy access to operational and clinical data, can provide insights into everyday clinical workflow. Additionally, it has the potential to facilitate optimization of protocols, and improve patient safety.
Introduction
Despite its obvious and well-known advantages, MRI has important drawbacks. As compared to other imaging modalities, MRI’s cost-efficiency is hampered by its relatively low speed and high price. In order to ensure the place of MRI in the future of value-based healthcare, efforts need to be put in place that facilitate optimization of everyday clinical practice, and increase patient safety. Large variation in exam duration and inefficient machine use is unfavorable for cost-efficiency of MRI. Optimizing workflow and harmonizing protocols in clinical practice is a relatively straightforward way to add to the value of MRI. It has been shown in other imaging modalities, like computed tomography (CT), that accessible management software tools facilitate optimization of practices to a great extent1,2. This study aims to demonstrate the value of automatic collection of operational and clinical data, to understand and improve clinical workflow.Methods
DICOM data was automatically collected from 2 MR systems (3T, Siemens) on a central server, using a software system (GE Healthcare). Data was extracted in excel format. Descriptive statistics of our everyday MRI workflow were generated, and operational parameters were compared between scanners.Results
Data from 1338 MRI procedures was collected; 826 (61,73%) of them were performed without intravenous gadolinium (Gd) contrast media, 382 (28,55%) and 2 (0,01%) were performed with cyclic and linear Gd contrast media respectively. Unidentified contrast media was used in 19 (1,42%) procedures.
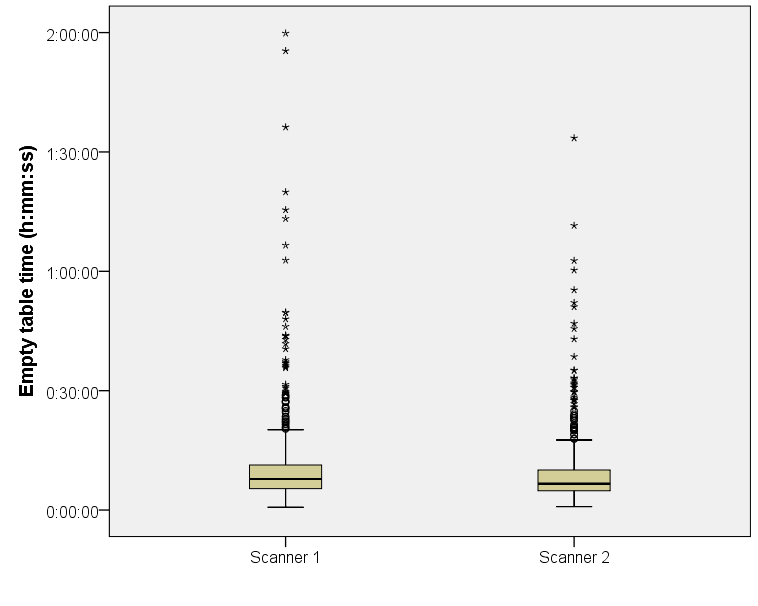
When excluding overnight stops, average empty-table time between patients was 10min 47s for scanner 1 and 9min 33s for scanner 2, which was statistically significant (t-test; p=0,050) (Figure 1).
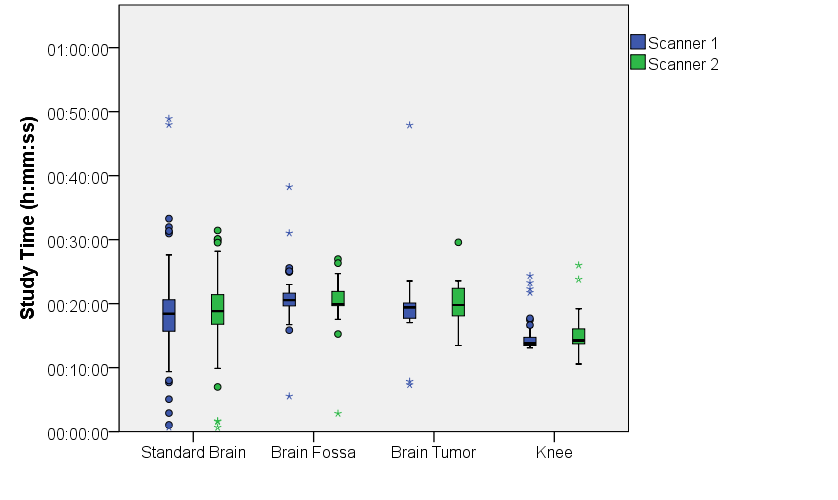
Study times of the most used protocols were assessed. Excellent standardization was found for contrast enhanced brain MRI of fossa posterior- and tumor-protocols; non-significant differences of only 11s (t-test; p=0,775) and 3s (t-test; p=0,982) were found respectively between scanners. The standard unenhanced brain MRI protocol showed a non-significant (t-test; p=0,299) difference of 1min 11s. For the standard knee protocols, the difference was 43s, which was non-significant (t-test; p=0,143). Boxplots of these 4 protocols are shown in Figure 2.
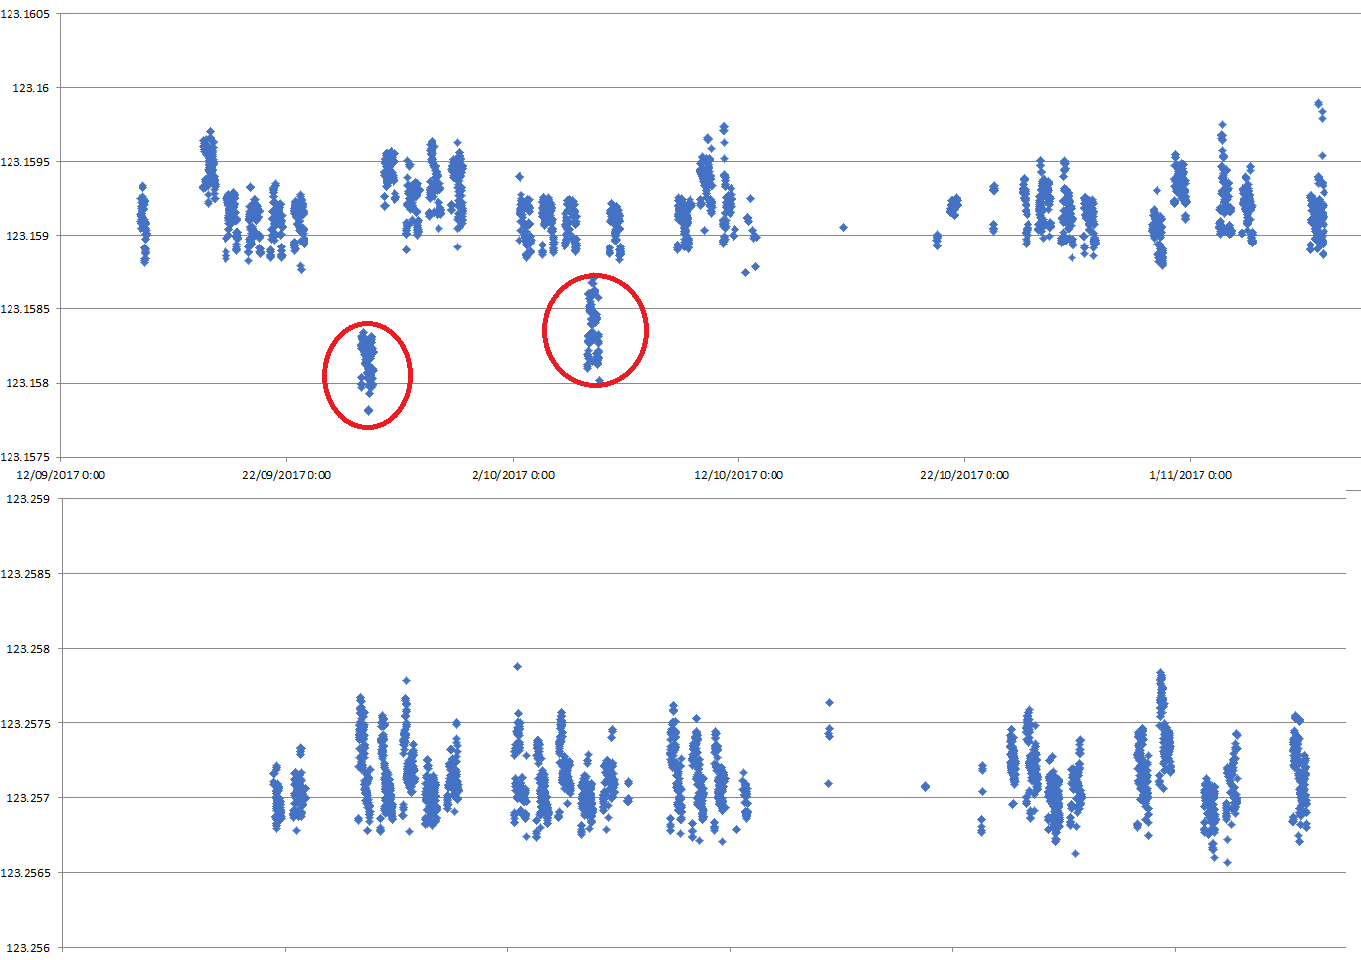
There was a significant difference between the measurement frequencies between the 2 scanners (t-test; p<0,001); the scanners measure at 123,159135 MHz (approximate field strength of 2,8926T), and 123,257136 MHz (approximate field strength of 2,8949T). An analysis of the measurement frequency in time identified a drop during 2 separate days in one of the 2 scanners, as shown in Figure 3.
Discussion
Easy access to data on Gd administration is of interest because of recent concerns about their safety3. Our data shows that use of linear contrast agents, which are known to result in Gd deposition, is limited only to liver exams and is almost out of use in our institution.
Empty-table time is relatively low during working hours (Figure 1). Scanner 1 has a slightly higher average empty-table time, which was not expected. The scanning of anesthetized patients, who require more extensive preparation, is done on scanner 2. This is why we anticipated the difference in the opposite direction. Understanding the observed difference will require a more in depth investigation of the workflow.
In terms of protocol standardization we identified no relevant significant differences in scan time between our 2 scanners, as illustrated by Figure 2. The only (spurious) statistically significant differences were found in little used protocols, and are a consequence of wrong protocol selection.
A plot of measurement frequency versus time (Figure 3) can identify possible issues with the system, showing that the use of management software systems can have an additional role in daily quality control routines. The cause of this frequency drop is yet to be explored.
Future work will be focused on building a patient database with information on contrast allergies, and implant safety. With this information, the software is able to raise pre-exam notifications of possible issues to occur during the measurements. Additionally, SAR levels are tracked and matched to the patient’s body habitus. Finally, a feedback-tool for radiologists can be introduced, to acquire information on image quality and usefulness of every sequence. The latter can enable efficient implementation of abbreviated MRI (aMRI) protocols.
Conclusion
The use of a management software tool will provide insights in everyday clinical workflow and can show opportunities to increase productivity. Additionally, it will enable an improved patient safety culture in radiology departments.Acknowledgements
No acknowledgement found.References
1: Fitousi N. Patient dose monitoring systems: A new way of managing patient dose and quality in the radiology department. Phys Med 2017, in press.
2: Grimes J, Leng S, Zhang Y, et al. Implementation and evaluation of a protocol management system for automated review of CT protocols. J App Clin Med Phys 2016;7(5).
3: Ramalho J and Ramalho M. Gadolinium deposition and chronic toxicity. Magn Reson Imaging Clin N Am 2017, in press.
Figures