2632
Quantitative validation of the image contrast generated by MAgnetic Resonance image Compilation (MAGiC) technique1Department of Radiology, Wan Fang Hospital, Taipei Medical University, Taipei, Taiwan, 2GE Healthcare, Taipei, Taiwan, 3Graduate Institude of Biomedical Electronics and Bioinformatics, National Taiwan University, Taipei, Taiwan, 4Department of Radiology, School of Medicine, College of Medicine, Taipei, Taiwan
Synopsis
MAGiC scan could provide several different clinical relevant weighted images and quantitative tissue relaxation time with use of a multi-slice, multi-echo, and multi-delay acquisition in the single scan. In this study, a homemade phantom containing 7 tubes with various concentrations of aqueous CuSO4 was used to quantitatively validate the image quality of a MAGiC scan. Results show that overall diagnostic image quality using MAGiC is comparable to that using conventional scanning, but a slight contrast difference is seen where T1 values are low (outside the range of brain T1 values, less than 500 ms)
INTRODUCTION
Magnetic resonance image compilation (MAGiC) is a synthetic MR technique that allows the simultaneous acquisition of images with various image contrasts. In a single MAGiC scan, T1, T2, STIR, T1-FLAIR, T2-FLAIR, PD-weighted, and quantitative maps (such as T1) can be generated. Tanenbaum et al. recently reported comparing subjective diagnostic scores from images acquired using conventional sequences and MAGiC scanning, the latter exhibiting similar legibility and image quality [1]. However, quantitative validation of image contrast has not been reported. In this study, we developed and used a phantom with 7 substructures, each containing a different concentration of aqueous CuSO4, to compare the image quality of the two techniques.
METHODS
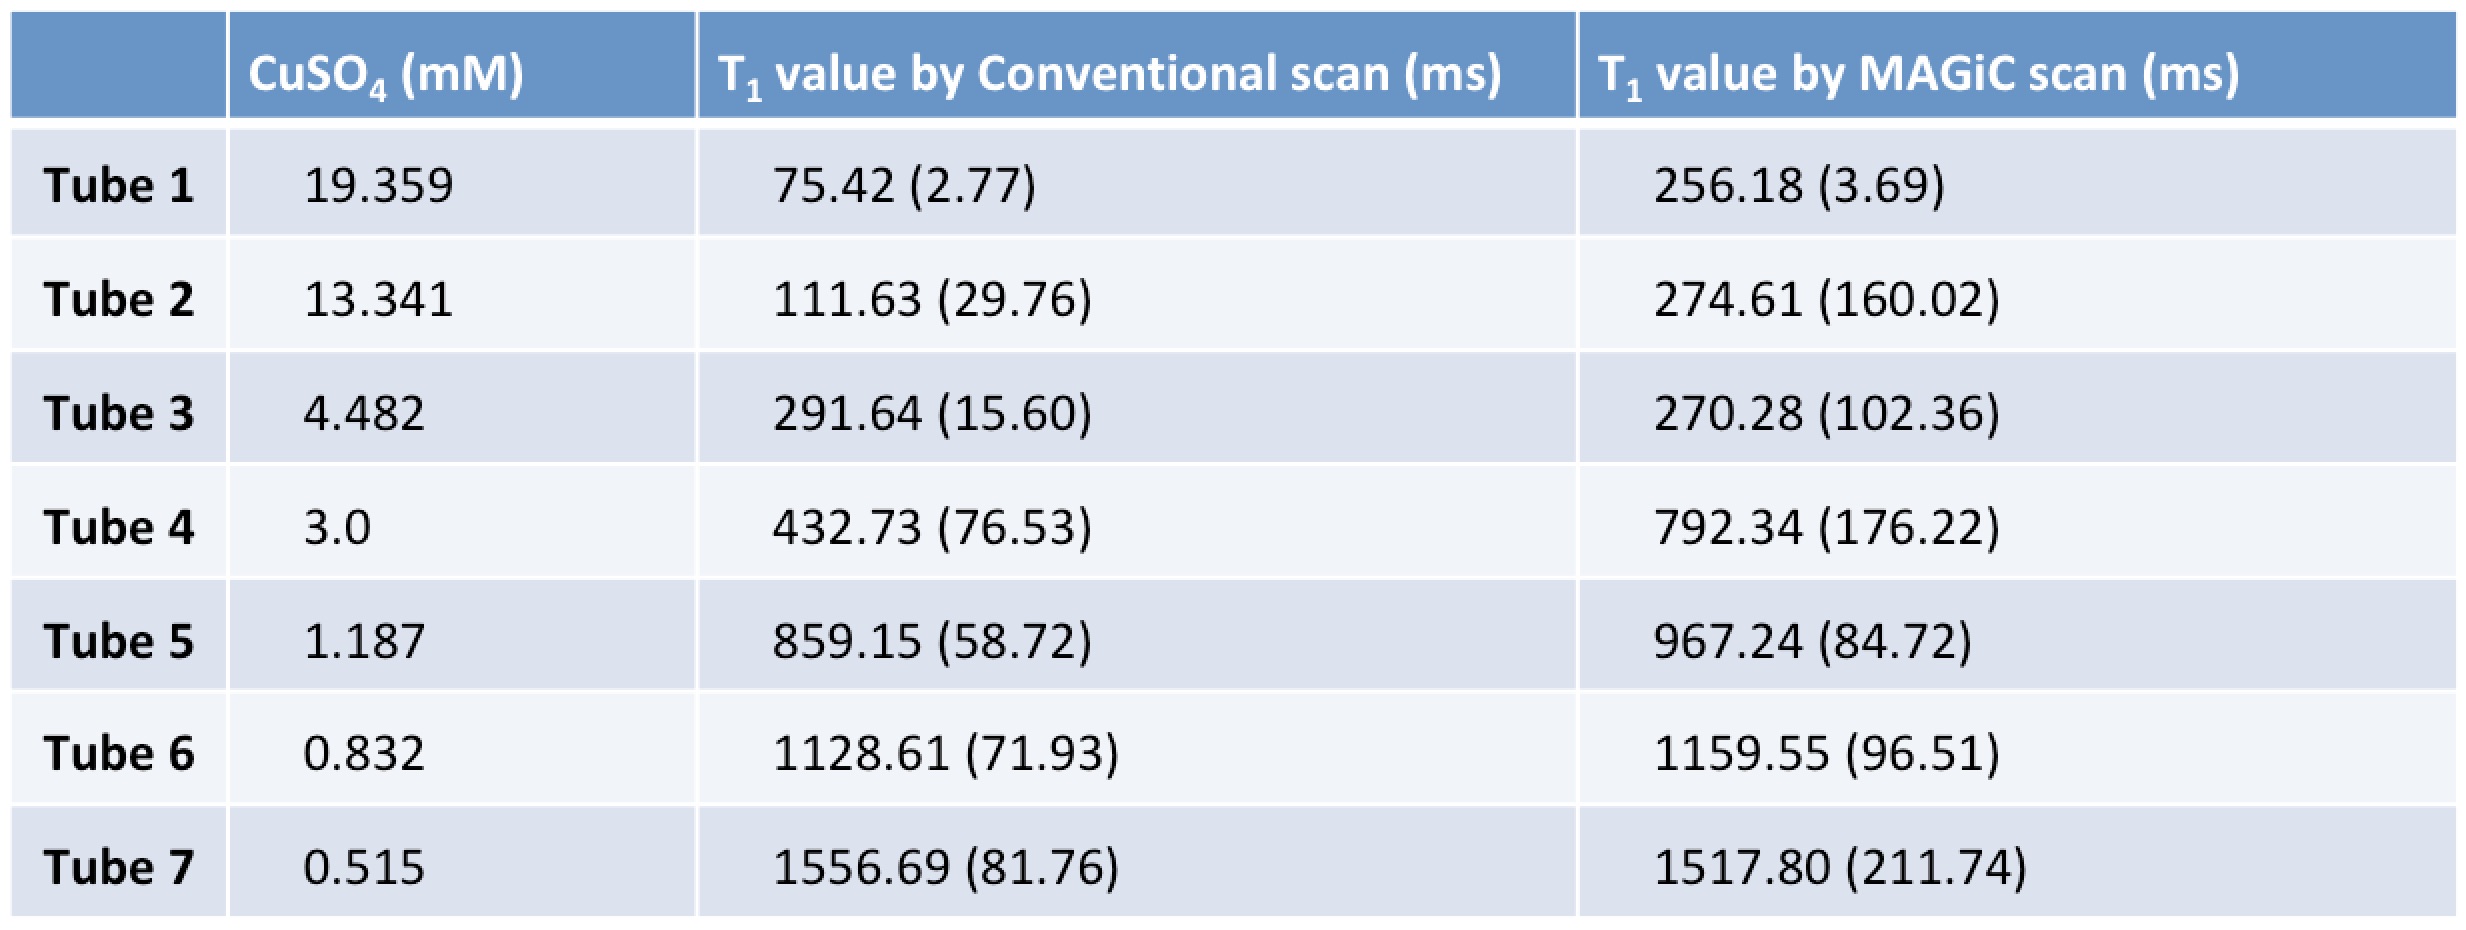
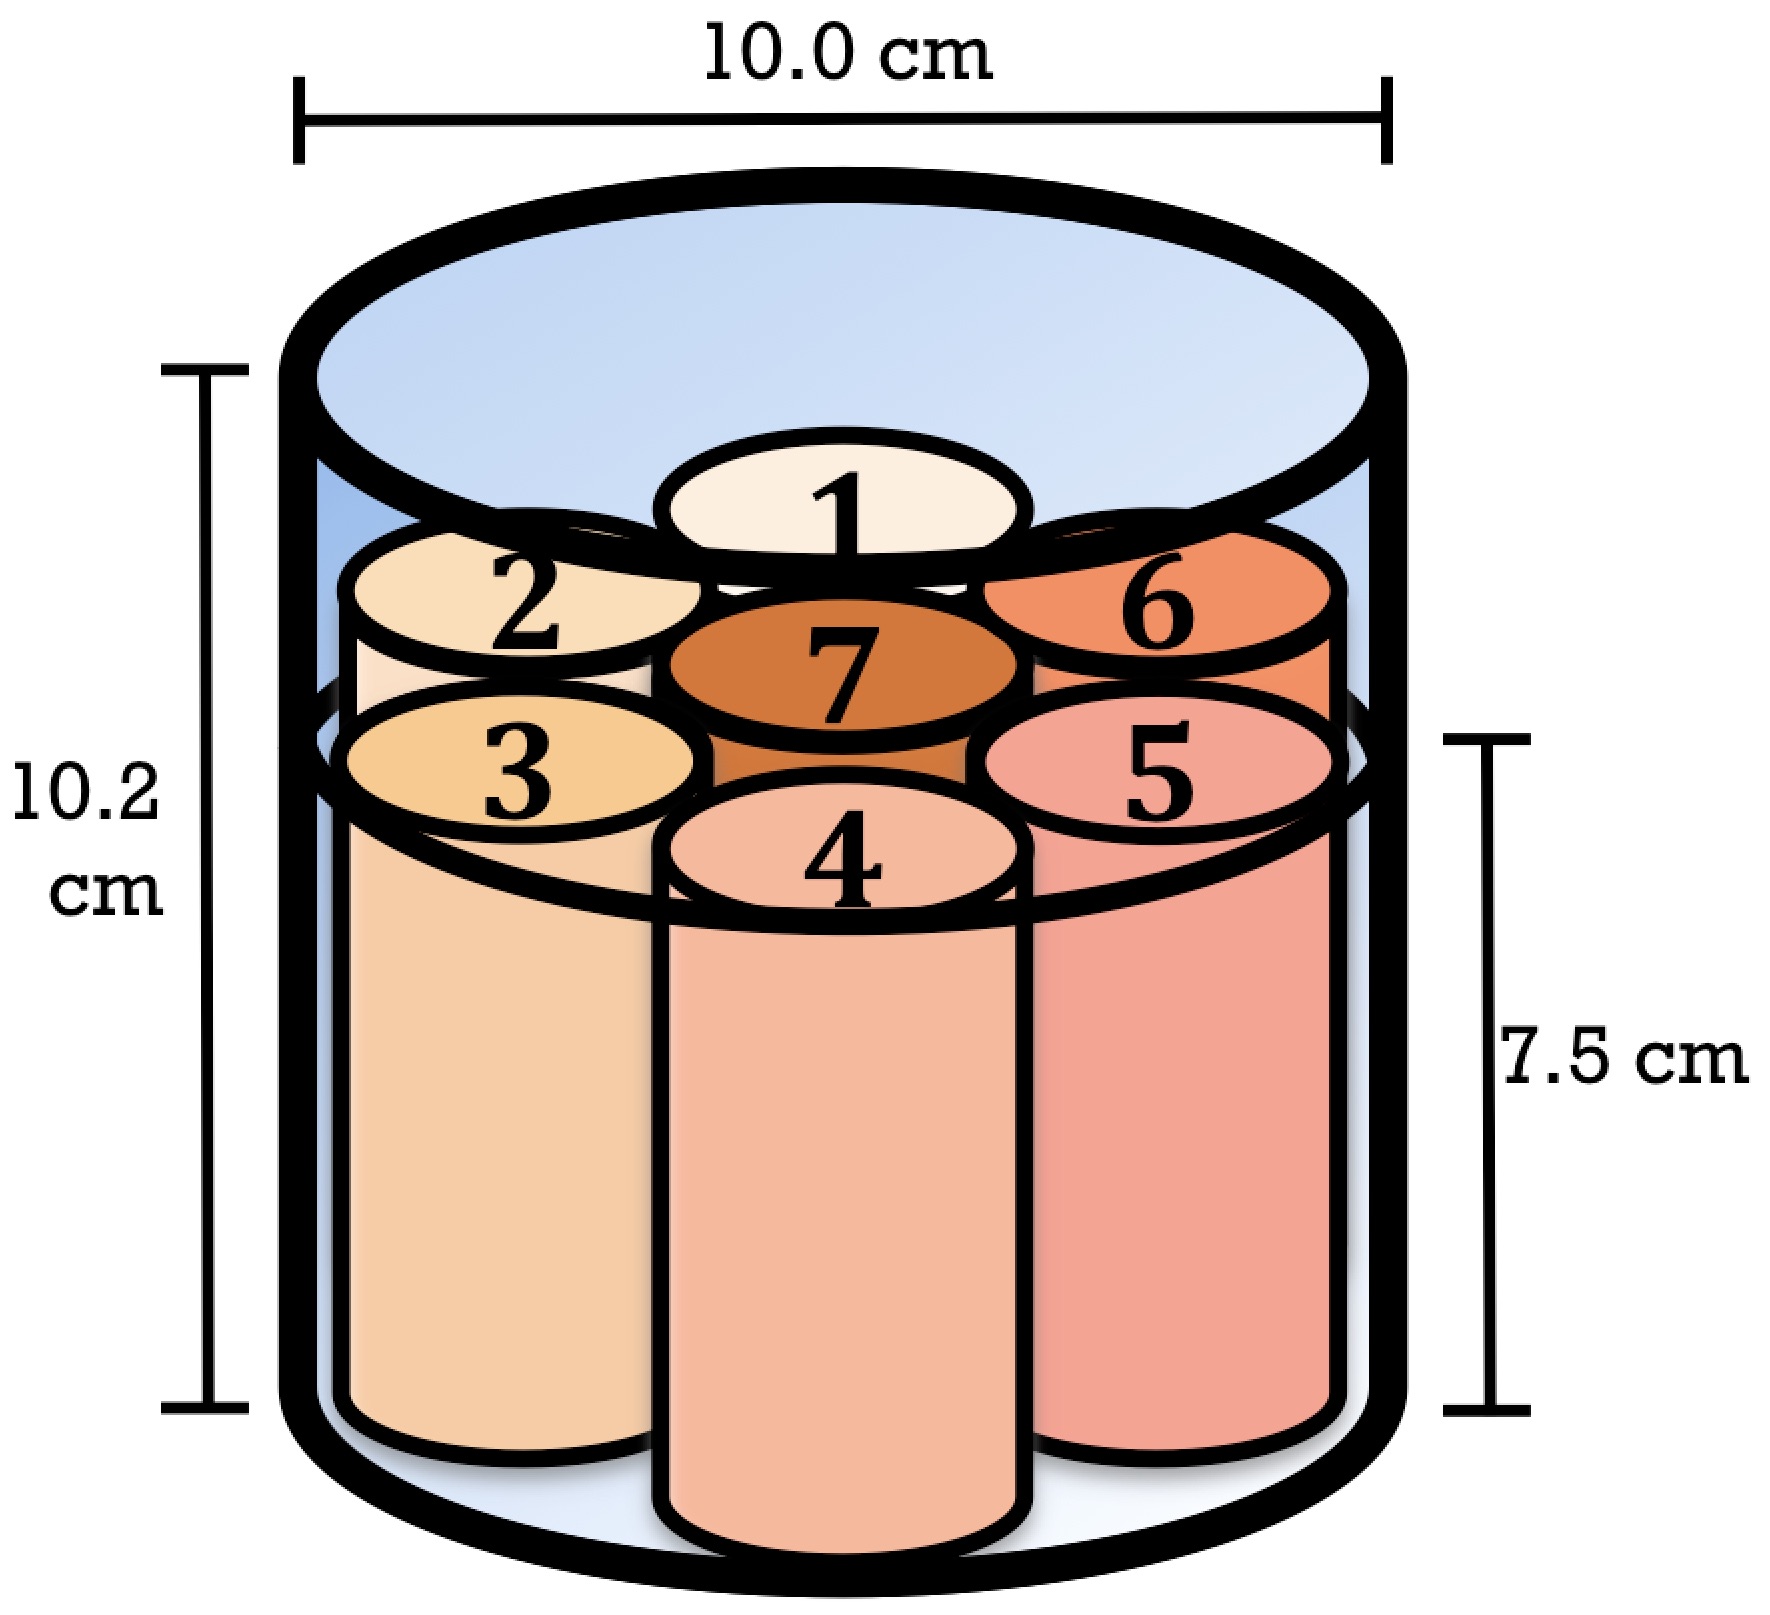
All MRI acquisitions were performed using a 3T MRI scanner (Discovery MR750w; GE Healthcare, Milwaukee, USA) using a geometry-embracing method (GEM) head-and-neck unit for signal detection and a whole-body coil for radio-frequency excitation. The homemade phantom contained 7 tubes, each with a different concentration of aqueous CuSO4, for generating various T1 values [2], and normal saline was used to fill the remaining space within the phantom to minimize the susceptibility phenomenon (Figure 1, Table 1). Imaging parameters were as follows: 16 mm x 16 mm FOV, 256 x 256 matrix size, 5-mm slice thickness, and 20 slices per scan. In addition, a conventional T1 measurement of spin echo with 10 different values of the inversion-recovery time was used for quantitative validation of the T1 values in the MAGiC scans.
RESULTS and DISCUSSION
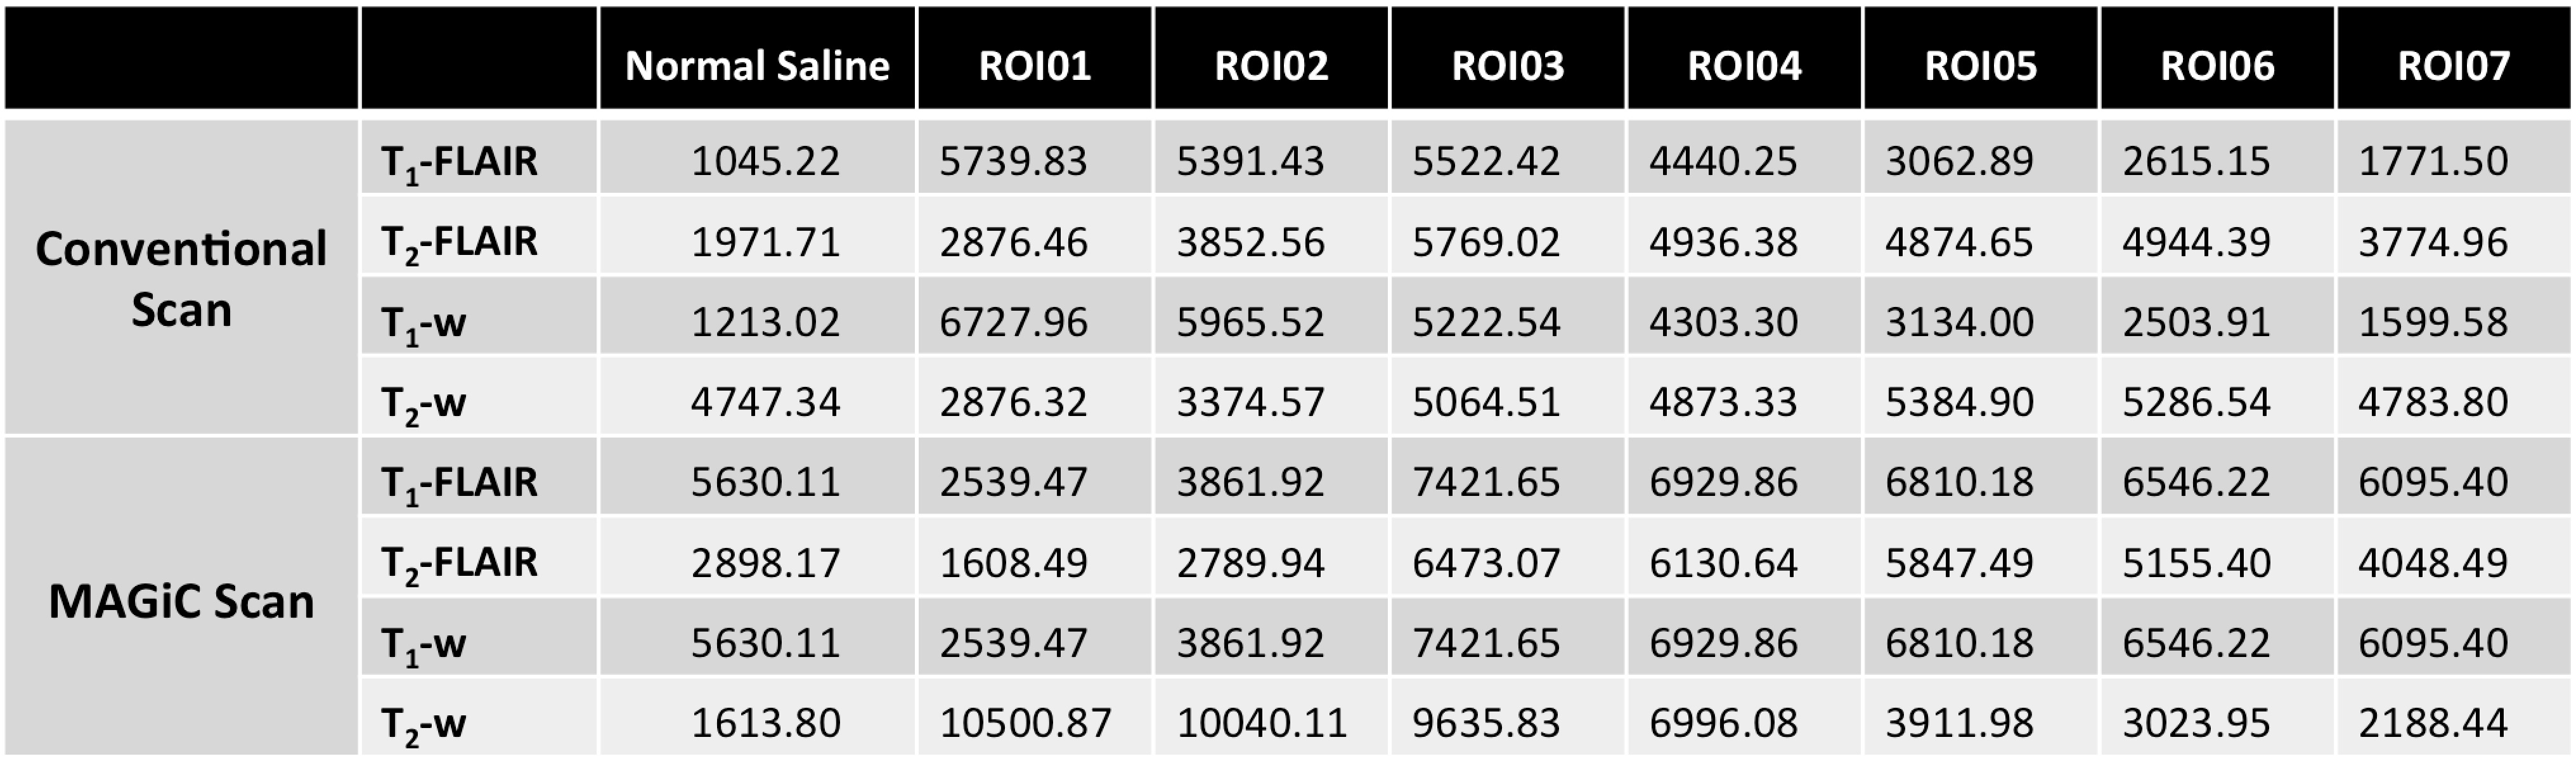
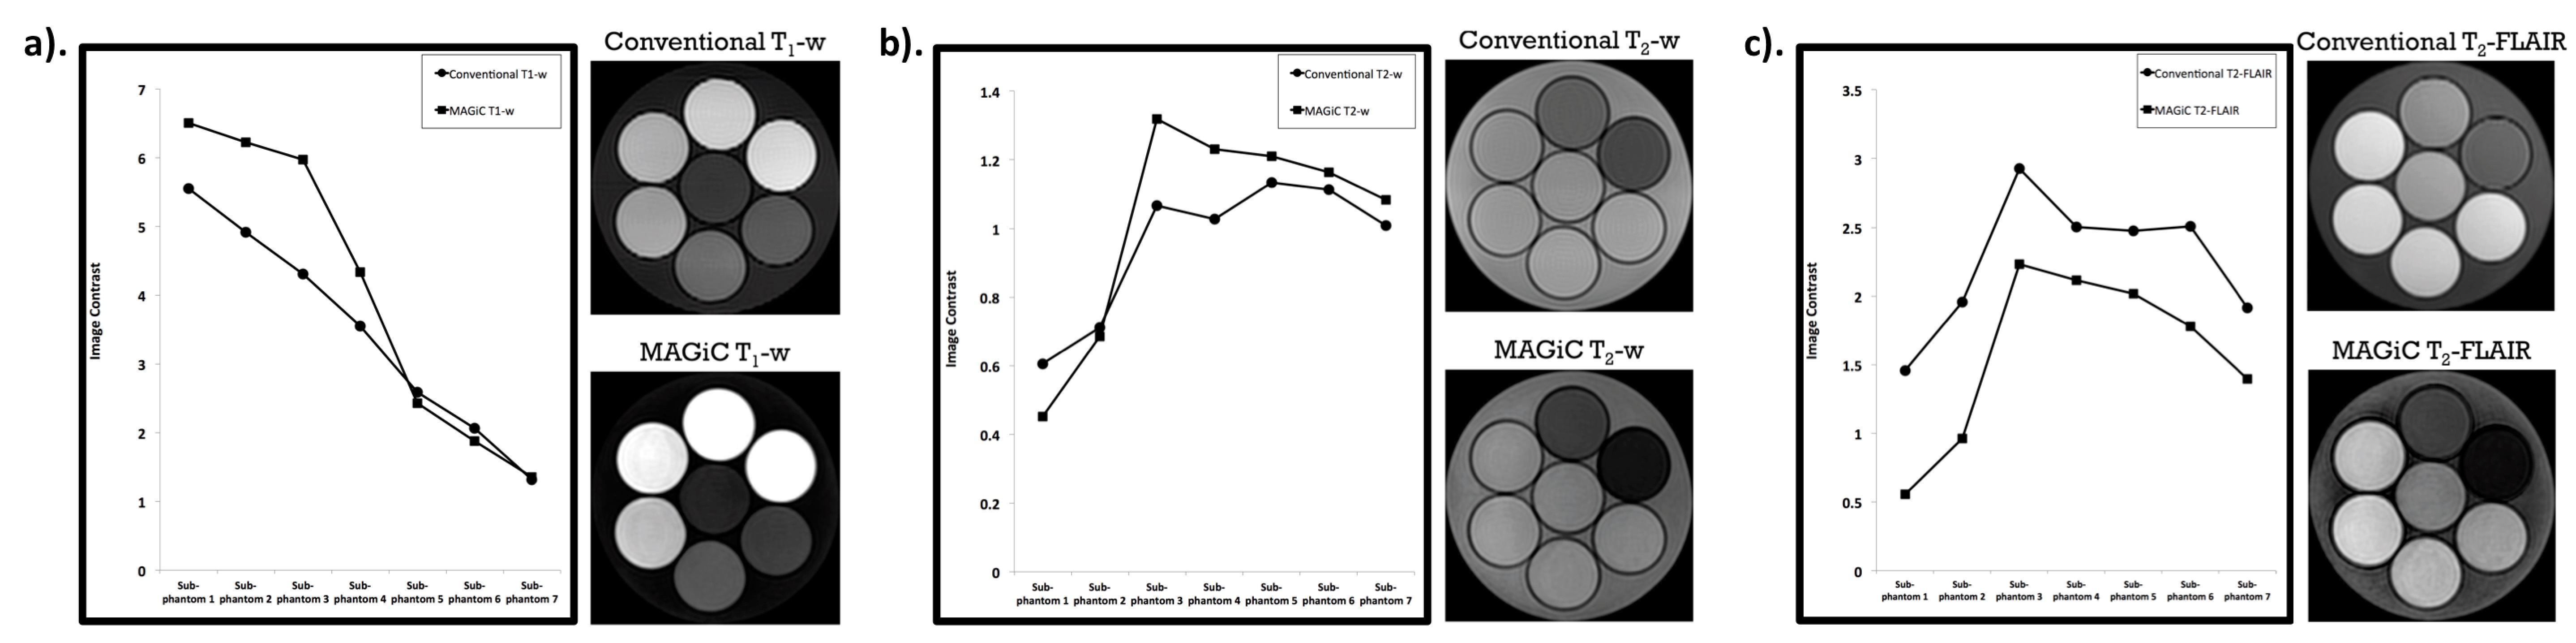
In T2-weighted images, the quantitative signal trend was the same as the change in T1 value (i.e., in a different phantom) in the MAGiC scan, and it nearly agreed with that acquired using conventional scanning. In T1-weighted images, a signal difference of 30% was observed in regions of interest (ROIs) with low T1 values (< 500 ms). In T2-FLAIR images, the MAGiC scan showed lower contrast than the conventional scan (Figure 2). In the quantitative T1 map, T1 values acquired using the MAGiC scan were nearly the same as those acquired using a conventional T1-fitting scan (Table 1) in ROIs where T1 was greater than 1000 ms (the T1 value of normal brain tissue). This suggests that the MAGiC sequence was probably optimized for efficiency in brain scanning, agreeing with the finding of different T1-weighted contrasts in ROIs with low T1 values.
CONCLUSION
A MAGiC scan can provide several clinically-relevant weighted images in a single scan, shortening total imaging acquisition time and potentially providing additional imaging parameters with ease in adjusting contrast after the scan. In this study, we quantitatively validated the image contrast and T1 values provided by a MAGiC scan against a conventional scan. The image sets provided by a MAGiC scan exhibit similar legibility and quality compared to conventional scans, and image contrasts in ROIs with the same T1 range as brain tissue highly agreed with those obtained using conventional scans.
Acknowledgements
No acknowledgement found.References
- Tanenbaum, LN et al., Synthetic MRI for clinical neuroimaging: results of the magnetic resonance image compilation (MAGiC) prospective, multicenter, multireader trial, AJNR Am J Neuroradiol. 2017 Jun;38(6):1103-1110.
- Thangavel, K and Saritas, UE ̧ Aqueous paramagnetic solutions for MRI phantoms at 3 T: A detailed study on relaxivities, Turk J Elec Eng & Comp Sci (2017) 25: 2108 – 2121.
Figures