2629
An optimised, MRI-PET based clinical protocol for improving the differential diagnosis of Late-life Depression and Alzheimer's Disease1Translational MRI, Department of Imaging & Pathology, KU Leuven, Leuven, Belgium, 2Old Age Psychiatry, UPC KU Leuven, Leuven, Belgium, 3Radiology, UZ Leuven, Leuven, Belgium, 4Laboratory for Translational Neuropsychiatry, Dept Neurosciences, KU Leuven, Leuven, Belgium, 5Academisch Centrum voor ECT en Neuromodulatie (AcCENT), UPC KU Leuven, Kortenberg, Belgium, 6Laboratory for Cognitive Neurology, KU Leuven, Leuven, Belgium
Synopsis
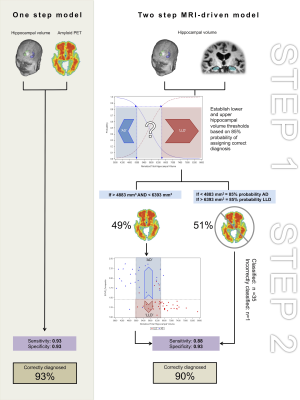
Owing to overlapping symptomatology, differentiating between late-life depression (LLD) and Alzheimer’s Disease (AD), is clinically challenging. Amyloid PET may be used to improve AD diagnosis, however it is expensive and not widely available. Here we apply a two-step MRI driven approach exploiting the different degree of hippocampal volume loss that is present in both disorders to derive hippocampal volume thresholds for identifying patients who could be diagnosed without a PET exam. Using the more cost-effective hippocampal volumetry approach, we could correctly classify half of the patient sample. This increased to 90% when adding 18F-flutametamol PET for the remaining patients.
Purpose
Subjects with late-life depression (LLD) and Alzheimer’s Disease (AD) often share common psychopathology, risk factors and neurobiology, yet require substantially different clinical management strategies. Differentiating between the two disorders is one of the foremost challenges of geriatric psychiatry1, and there is a pressing need to identify useful clinical biomarkers for this purpose. Amyloid PET may be used to improve AD diagnosis2, however it is expensive, not widely available and involves ionising radiation. Here we exploit the different degree of hippocampal volume loss present in both disorders to derive hippocampal volume thresholds for identifying patients who could be diagnosed without a PET exam. We investigate the relative benefits of using a single model incorporating hippocampal volume and amyloid PET to classify patients, and a sequential two-step procedure which aims to first diagnose patients with MRI-based hippocampal volumetry alone, before adding amyloid PET to improve diagnosis in unclassified patients.Methods
Data: Following QA, 18F-Flutametamol PET3 and 3 Tesla 3D T1-weighted MRI data (voxel size: 0.9 mm x 0.9 mm x 1.2mm) for 68 patients were included: n=41 with LLD (mean age=72.3 yrs), and n=27 with AD (mean age = 69.6 yrs). Total normalised hippocampal volume* (*from hereon ‘hippocampal volume’) was obtained by summing left and right manually segmented hippocampi following the Harmonized (HarP) protocol4 and normalisation using total cerebral volume5 (obtained by summing grey matter and white matter tissue segmentations from SPM126). Following data quality assurance and corrective pre-processing (e.g. attenuation, scatter, motion etc.) standardized uptake value ratio (SUVR) images were calculated from an MRI-based normalized PET summed image using cerebellar grey matter as reference region. Amyloid load (SUVRcomp) was calculated by averaging the SUVR in five bilateral volumes of interest (lateral frontal, parietal, and temporal cortex and anterior and posterior cingulate cortex) derived from the AAL atlas7.
Single Model: Logistic regression with hippocampal volume and amyloid load (SUVRcomp) as predictors. Sequential Model: Step 1: Logistic regression using (total normalised) hippocampal) to predict AD diagnosis. Identification of cut-off hippocampal volume for 85% probability to classify AD and LLD patients correctly. Step 2: In patients unclassified based on hippocampal volume (Step 1), we used logistic regression using amyloid load (SUVRcomp) and hippocampal volume to predict AD diagnosis.
Results
Single Model: Both hippocampal volume (Wald χ2 = 6.46: p= 0.011) and amyloid load (Wald χ2 =11.03 : p=0.0009 ) were significant predictors of diagnosis, with decreasing hippocampal volume increasing the probability of having AD, and higher amyloid load, increasing the probability of having AD. The sensitivity to detect AD was 0.93 and the specificity was 0.93. Two subjects with AD were incorrectly classified as having AD whereas 3 subjects with LLD were incorrectly classified as having AD. In total 93 % patients were correctly classified.
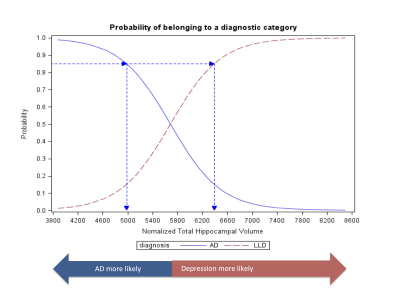
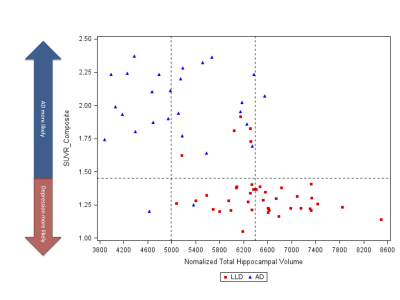
Sequential model: Step 1: hippocampal volume alone was a significant predictor of diagnosis (Wald χ2 =18.40 p<0.0001). A lower threshold of 4983 mm3 and higher threshold of 6393 mm3 could be used to classify 51% of patients as having AD or LLD respectively with a probability of 0.85 (figure 1). Step 2: In the remaining 49% of patients (n=33), amyloid load was a significant predictor of diagnosis (Wald χ2 = 9.7254 p =0.0018). Based on this model, subjects with an SUVRcomp below 1.45 could be classified as having LLD with a probability of 0.85. The sensitivity to detect AD was 0.93 and the specificity was 0.88. Two subjects with AD were incorrectly classified as having LLD, and 5 subjects with LLD were incorrectly classified as having AD (figure 2). In total, 90 % of the patients were correctly classified.
Discussion / Conclusion
In this proof-of-principle study we demonstrate the potential for using two imaging biomarkers to improve the differential diagnosis of LLD and AD, and a means to reduce the number of PET exams required by using MRI based hippocampal volumetry. Based on these results, we defined hippocampal volume thresholds of <4883 mm3 and >6393.01 mm3 to assign 85% probability of AD and LLD diagnoses in 51% of the sample using MRI alone. This approach misclassified only 3% fewer patients than using both MRI and PET in one model, and is more cost-effective than assessing all patients with amyloid PET as only 49 % would require further imaging. Due to the small sample size and variability in hippocampal volumetry techniques (e.g. manual v automated) the precise thresholds calculated are only indicative. The proposed two-step model should be cross-validated in a new, larger sample, using more clinically feasible automated hippocampal volume measurements to confirm its clinical utility for the differential diagnosis of AD and late-life depression.Acknowledgements
No acknowledgement found.References
1. Steffens, D.C., 2017. Late-Life Depression and the Prodromes of Dementia. JAMA Psychiatry 74, 673-674.
2. Johnson, K.A., et al., Appropriate use criteria for amyloid PET: a report of the Amyloid Imaging Task Force, the Society of Nuclear Medicine and Molecular Imaging, and the Alzheimer's Association. Alzheimers Dement, 2013. 9(1): p. e-1-16.
3. Vandenberghe R, Van Laere K, Ivanoiu A, et al: 18F-Flutemetamol amyloid imaging in Alzheimer disease and mild cognitive impairment: a phase 2 trial. Ann Neurol 2010; 68:319–329
4. Boccardi M, Bocchetta M, Apostolova LG, et al: Delphi definition of the EADC-ADNI Harmonized Protocol for hippocampal segmentation on magnetic resonance. Alzheimers Dement 2015; 11:126–138
5.Jack CR, Twomey CK, Zinsmeister AR, Sharborough FW, Petersen R, Cascino GD. Anterior temporal lobes and hippocampal formations: normative volumetric measurements from MR images in young adults. Radiology 1989;172:549–554
6. Statistical Parametric Mapping, Wellcome Trust Centre for Neuroimaging, University College London, http://www.fil.ion.ucl.ac.uk/spm/ (Accessed Nov 3 2018)
7. De Winter, F.L., et al., No Association of Lower Hippocampal Volume With Alzheimer's Disease Pathology in Late-Life Depression. Am J Psychiatry, 2017. 174(3): p. 237-245.Figures


