2626
Quantifying hepatic fibrosis using a 3D radial golden angle stack-of stars acquisition and a dual-input two compartment model1Medical Imaging, University of Arizona, Tucson, AZ, United States, 2Electrical and Computer Engineering, University of Arizona, Tucson, AZ, United States, 3Biomedical Engineering, University of Arizona, Tucson, AZ, United States, 4Siemens Medical Solutions USA, Inc, Tucson, AZ, United States
Synopsis
Chronic liver disease (CLD) is known to affect 3.9 million of Americans. Collagen deposition in CLD affects the perfusion of the liver parenchyma and dynamic contrast enhanced MRI (DCE-MRI) can be used for the non-invasive diagnosis of CLD. Here we present a liver perfusion technique based on a free-breathing 3D radial golden-angle stack-of-stars acquisition along with a compressed sensing reconstruction to generate DCE data with 4-sec temporal resolution. Perfusion parameters are estimated by fitting the DCE data to a dual-input two compartment pharmacokinetic model and used to evaluate hepatic fibrosis in CLD.
Introduction
Chronic liver disease (CLD) is the most common liver disorder with more than 3.9 million cases diagnosed in the USA. CLD can be diagnosed using liver biopsy but the procedure is invasive and suffers from sampling errors. One characteristic of CLD is the deposit of collagen associated with hepatic fibrosis (HF). Collagen deposition affects the hepatic sinusoids and in turn, the perfusion of the liver parenchyma [1]. Measuring liver perfusion with dynamic contrast enhanced MRI (DCE-MRI) requires high spatial and temporal resolution along with mathematical modeling of the dual input hepatic perfusion. In an animal model, it has been reported that kinetic parameters like ktrans derived from a dual-input, two compartment pharmacokinetic model are predictive of HF [2, 3]. Here, we present a liver perfusion technique based on a free-breathing 3D radial golden angle stack-of-stars acquisition along with a compressed sensing (CS) reconstruction to generate DCE data with a 4-sec temporal resolution. The technique is evaluated in patients with known CLD.Pharmacokinetic Modelling
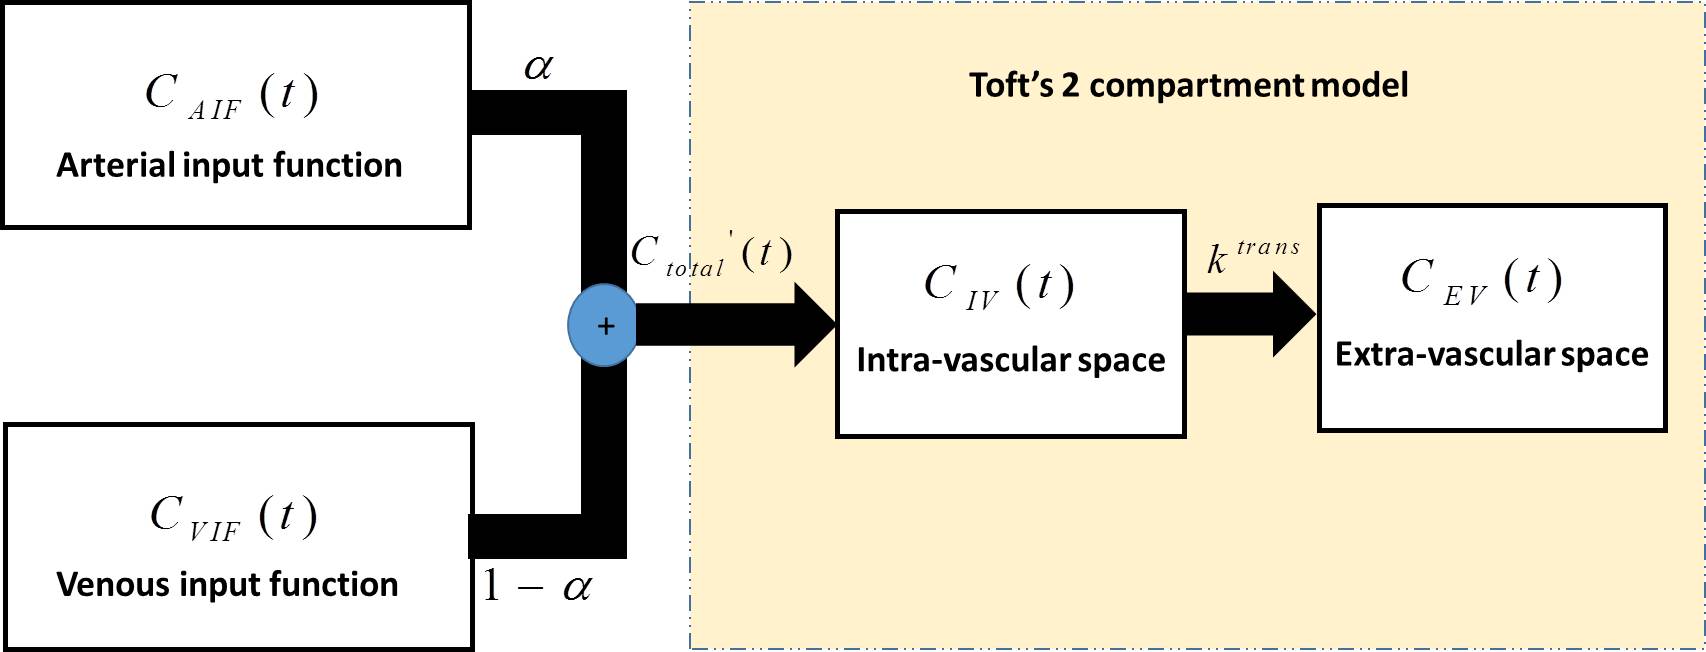
Toft’s two compartment model [5, 6] was modified according to the hepatic dual circulation by including terms for the arterial input function (AIF) and portal venous input function (VIF) [3] (Figure 1). This is shown in eq. (1) where the total concentration of gadolinium (Ctotal’(t)) entering the two compartments (hepatic vasculature and extravascular space) is modelled using a parameter α, which is defined as the fractional concentration of gadolinium entering the liver through the arterial flow (CAIF(t)) (Figure 1).
$$C_{total}'(t) = \alpha\times{C_{AIF}(t)}{+}(1-\alpha)\times{C_{VIF}(t)} $$ (1)
Ctotal’(t) is used in eq. (2) along with the concentration of the hepatic parenchyma (Cparenchyma(t)) to extract kinetic parameters, such as ktrans, as described in Toft’s two compartment model [5] (Figure 2).
$$C_{parenchyma}(t) = v_b\times{C_{total}'(t)}{+}k^{trans}\int_{0}^{t} {C_{total}'(y)dy}$$ (2)
Method
Imaging was performed on a 1.5T MRI scanner (Aera, Siemens Healthcare, Malvern, PA) using a 3D radial golden angle stack-of-stars spoiled gradient-echo pulse sequence on 14 patients referred for abdominal imaging, after informed consent. The acquisition parameters were:TR=3.67 ms; TE=1.5 ms; FOV=38 cm; flip angle=12°; acquisition matrix=256x256x54; 6 mm slice thickness. Free breathing 3D radial data were acquired continuously starting ~20 sec before contrast injection of gadobenate dimeglumine (Multihance) and continuing for 90-sec after injection. Radial k-space data was temporally grouped retrospectively to yield 4-sec temporal resolution volumes. Data were reconstructed using a compressed sensing (CS) iterative algorithm with sparsity enforced across the temporal dimension using a total variation constraint [4]. For data analysis, ROIs were drawn to extract the arterial AIF, VIF and liver parenchymal signal intensity-time curves; these were then converted to concentration-time curves for pharmacokinetic analysis.
Results
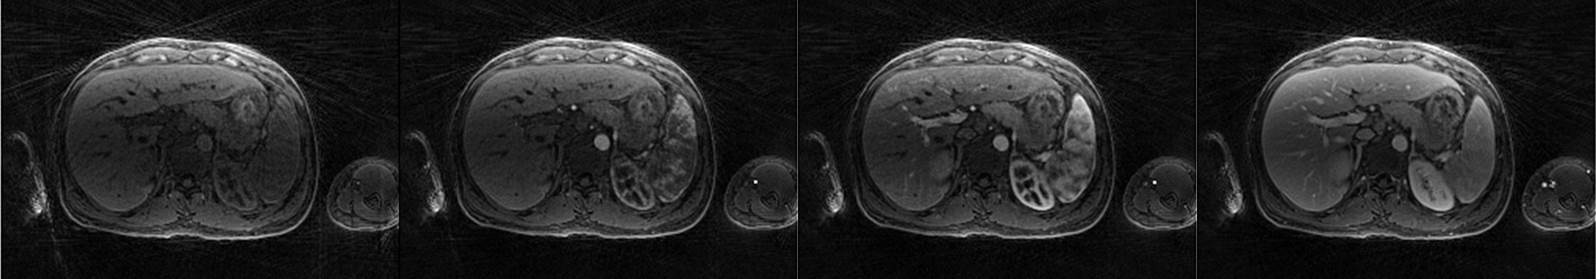
Figure 2 shows representative images of the perfusion phases (pre-contrast, early arterial, late arterial and venous) generated using data acquired with the continuous acquisition technique and the CS reconstruction. The visualization of small branching vessels and the absence of venous signal in the arterial phase attest to the high spatio-temporal resolution achieved by the 3D radial golden angle stack-of-stars technique for continuous data acquisition.
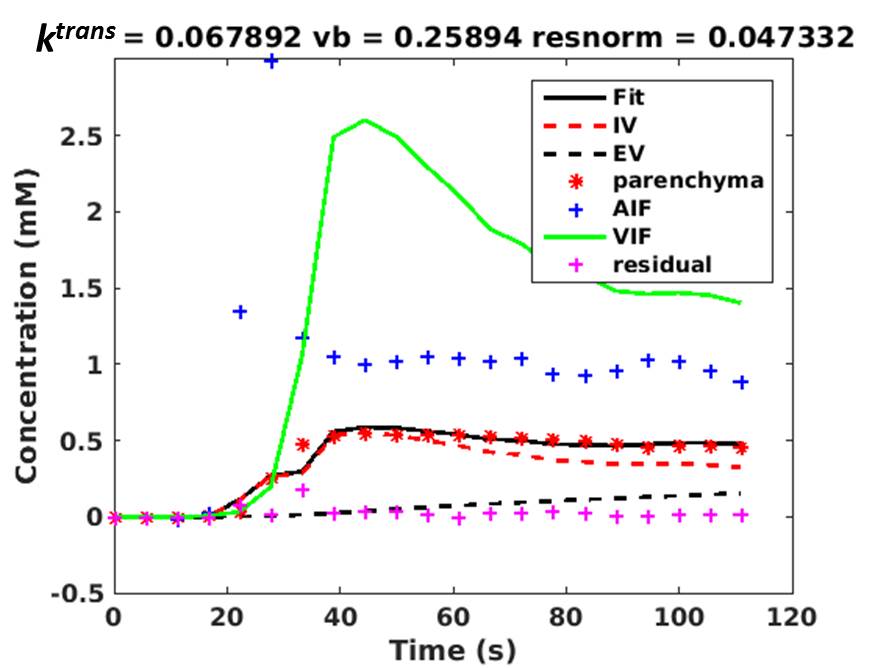
Figure 3 shows typical concentration-time curves obtained from a non-linear fitting of the dual-input two compartment model (eq. (2)). The non-linear fit provides an estimate for ktrans, which is a measure of hepatic perfusion.
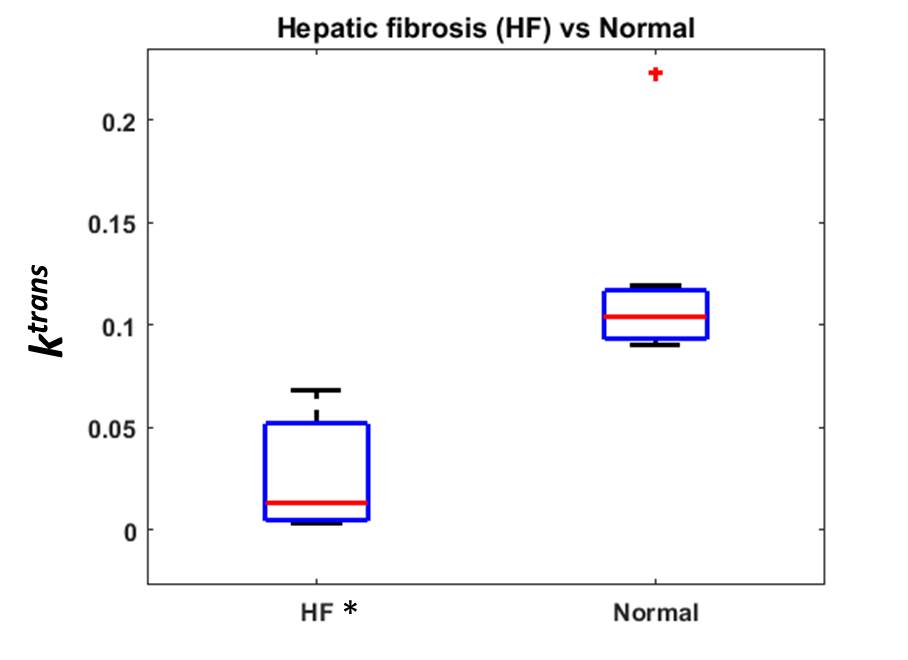
Figure 4 shows the box plot of ktrans estimates of 7 patients with HF and 7 subjects with normal livers. Note that the mean ktrans is reduced in the subjects with HF relative to the normal subjects (p <0.05), highlighting the diagnostic potential of the method. The ktrans standard deviation in the subject group with HF is larger than in the normal group. This is expected due to higher heterogeneity of liver perfusion in the disease group.
Conclusion
We demonstrated the feasibility of continuous DCE imaging using a 3D radial stack-of-stars scheme combined with a CS reconstruction and dual-input two compartment pharmacokinetic model to estimate hepatic kinetic parameters in vivo. ktrans was found to be statistically significantly lower in subjects with HF compared to normals. The acquisition of data involves a comfortable free breathing fast scan and can be easily incorporated as part of a routine clinical examination for assessing liver perfusion in CLD subjects.Acknowledgements
The authors would like to acknowledge support from the Arizona Biomedical Research Commission (Grant ADHS14-082996) and the Technology and Research Initiative Fund (TRIF) Improving Health Initiative.References
[1] Chen BB, Hsu CY, Yu CW, Wei SY, Kao JH, Lee HS, Shih TT: Dynamic contrast-enhanced magnetic resonance imaging with Gd-EOB-DTPA for the evaluation of liver fibrosis in chronic hepatitis patients. Eur Radiol 2012;22:171–180.
[2] Zhou, L., Chen, T.-w., Zhang, X.-m., Yang, Z., Tang, H.-j., Deng, D., Zeng, N.-l., Wang, L.-y., Chen, X.-l., Li, H., Li, C.-p., Li, L., Xie, X.-y. and Hu, J. (2014), Liver dynamic contrast-enhanced MRI for staging liver fibrosis in a piglet model. J. Magn. Reson. Imaging, 39: 872–878. doi:10.1002/jmri.24248.
[3] Li, Z., Sun, J., Chen, L., Huang, N., Hu, P., Hu, X., Han, G., Zhou, Y., Bai, W., Niu, T. and Yang, X. (2016), Assessment of liver fibrosis using pharmacokinetic parameters of dynamic contrast-enhanced magnetic resonance imaging. J. Magn. Reson. Imaging, 44: 98–104. doi:10.1002/jmri.25132.
[4] Feng, L., Grimm, R., Block, K. T., Chandarana, H., Kim, S., Xu, J., Axel, L., Sodickson, D. K. and Otazo, R. (2014), Golden-angle radial sparse parallel MRI: Combination of compressed sensing, parallel imaging, and golden-angle radial sampling for fast and flexible dynamic volumetric MRI. Magn Reson Med, 72: 707–717. doi: 10.1002/mrm.24980.
[5] Tofts PS, Cutajar M, Mendichovszky IA, Peters AM, Gordon I (2012) Precise measurement of renal filtration and vascular parameters using a two-compartment model for dynamic contrast-enhanced MRI of the kidney gives realistic normal values. Eur Radiol 22:1320–1330.
[6] Pandey, A., Yoruk, U., Keerthivasan, M., Galons, J.-P., Sharma, P., Johnson, K., Martin, D. R., Altbach, M. I., Bilgin, A. and Saranathan, M. (2017), Multiresolution imaging using golden angle stack-of-stars and compressed sensing for dynamic MR urography. J. Magn. Reson. Imaging, 46: 303–311. doi:10.1002/jmri.25576.
Figures