2624
Dynamic contrast-enhanced MRI and intravoxel incoherent motion diffusion-weighted imaging for the evaluation of HCC response to 90Yttrium radioembolization1Translational and Molecular Imaging Institute, Icahn School of Medicine at Mount Sinai, New York, NY, United States, 2Department of Radiology, Icahn School of Medicine at Mount Sinai, New York, NY, United States, 3Recanati/Miller Transplantation Institute, Icahn School of Medicine at Mount Sinai, New York, NY, United States
Synopsis
The goal of this study is to assess whether DCE-MRI and IVIM-DWI can be used to predict response of hepatocellular carcinoma (HCC) to 90Yttrium radioembolization (RE). In a preliminary cohort, significant changes were observed in both DCE-MRI and IVIM-DWI parameters at 6 weeks after treatment, which suggest that both techniques are sensitive to treatment effects of RE to HCC tissue. The exact utility of the DCE-MRI and IVIM-DWI parameters will be tested in a larger cohort.
Purpose
90Yttrium radioembolization (RE) is a locoregional therapy that can be employed to downstage or bridge HCC patients to liver transplantation, or to treat patients with advanced HCC 1. Evaluation of tumor response to RE is critical for clinical management and further treatment decision in these patients. A recent study has shown that ADC measurements and standard clinical imaging assessment of tumor response using mRECIST measurements at 1 month after treatment cannot predict complete pathological necrosis after RE 2. Therefore, there is a need for more accurate imaging techniques to evaluate RE of HCC. The objective of our study was to assess the predictive value of diffusion and perfusion/flow parameters for subsequent HCC response to RE, using DCE-MRI and intravoxel incoherent motion (IVIM)-DWI.Methods
In this preliminary prospective study, 10 enrolled HCC patients (M/F 7/3, mean age 69y) underwent multiparametric MRI (1.5T, Siemens Aera), including IVIM-DWI (b-values 0, 15, 30, 45, 60, 75, 90, 105, 400, 600, 800 s/mm2) and DCE-MRI after injection of gadoxetic acid (0.025 mmol/kg) before and 6 w after RE. The DCE-MRI acquisition consisted of a fat-suppressed 3D VIBE dynamic acquisition with a temporal resolution of 4-5 s. Contrast uptake in the lesion was followed for 10 minutes with DCE-MRI, with a short interruption (~10 s) of the DCE-MRI scan for acquisition of a clinical VIBE post-contrast scan at 1 minute after injection. Gadoxetic acid was chosen as contrast agent to allow for advanced modeling of hepatic uptake of the contrast agent in the lesion 3. DCE-MRI parameter maps were quantified in each voxel within a 3D ROI in the index lesion. The following DCE-MRI parameters were quantified: arterial flow Fa, portal venous flow Fp, total flow Ft, arterial fraction ART, mean transit time MTT, interstitial volume fraction ve, intracellular uptake rate Ki, uptake fraction fi 3. IVIM-DWI mapping in a 3D ROI in the lesion, matched as closely as possible to the DCE-MRI ROI, was performed using a Bayesian fitting algorithm 4 to estimate diffusion coefficient D, pseudodiffusion coefficient D* and perfusion fraction PF. ADC was also quantified with a monoexponential fit using b-values >100 s/mm2. Parameter changes were tested using Wilcoxon signed-rank tests. In addition, percentage changes in parameter values were calculated and correlated between IVIM-DWI and DCE-MRI parameters using Spearman correlation tests.Results
Mean lesion size at baseline was 3.0±1.9 cm (range 1.4-8 cm). A representative example of changes in DCE-MRI and IVIM-DWI parameters after RE is shown in Figure 1. RE induced significant changes in DCE-MRI parameters Fa, Ft, ART and ve and in IVIM-DWI parameters D* and ADC (Table 1). Box plots of DCE-MRI and IVIM-DWI parameter values before and at 6w after RE are shown in Figure 2 and 3, respectively. Percentage changes in IVIM-DWI and DCE-MRI parameters did not show a significant correlation (p>0.178).Discussion and Conclusions
These preliminary results of our ongoing study show that DCE-MRI and IVIM-DWI are sensitive to RE treatment effects in HCC. The drop in tumor perfusion, as measured by the DCE-MRI flow parameters was mirrored by a significant decrease in IVIM blood-flow related parameter D*. While it has previously been shown that IVIM-DWI and DCE-MRI parameters do not correlate in untreated HCC and thus provide nonredundant information on tumor characteristics 5, our current results suggest that IVIM-DWI may be an alternative method to contrast-enhanced imaging for assessment of treatment response in HCC. However, percentage changes in IVIM-DWI and DCE-MRI parameters did not show a significant correlation. In addition, D* has previously shown low repeatability in HCC, which may affect the accuracy of IVIM-DWI measurements for longitudinal assessment of treatment-induced changes in HCC 5. The exact utility of DCE-MRI and IVIM-DWI parameters for prediction of HCC response to RE will be tested in a larger cohort, in which we will assess the diagnostic performance of each of the parameters for prediction of treatment response at 6 months after treatment.Acknowledgements
This research was supported by NCI grant U01 CA172320.References
1. Semaan S, Makkar J, Lewis S, Chatterji M, Kim E, Taouli B. Imaging of Hepatocellular Carcinoma Response After 90Y Radioembolization. AJR American journal of roentgenology 2017;209(5):W263-W276.
2. Vouche M, Salem R, Lewandowski RJ, Miller FH. Can volumetric ADC measurement help predict response to Y90 radioembolization in HCC? Abdominal imaging 2015;40(6):1471-1480.
3. Sourbron S, Sommer WH, Reiser MF, Zech CJ. Combined quantification of liver perfusion and function with dynamic gadoxetic acid-enhanced MR imaging. Radiology 2012;263(3):874-883.
4. Orton MR, Collins DJ, Koh DM, Leach MO. Improved intravoxel incoherent motion analysis of diffusion weighted imaging by data driven Bayesian modeling. Magnetic resonance in medicine 2014;71(1):411-420.
5. Hectors SJ, Wagner M, Besa C, et al. Intravoxel incoherent motion diffusion-weighted imaging of hepatocellular carcinoma: Is there a correlation with flow and perfusion metrics obtained with dynamic contrast-enhanced MRI? Journal of magnetic resonance imaging : JMRI 2016;44(4):856-864.
Figures
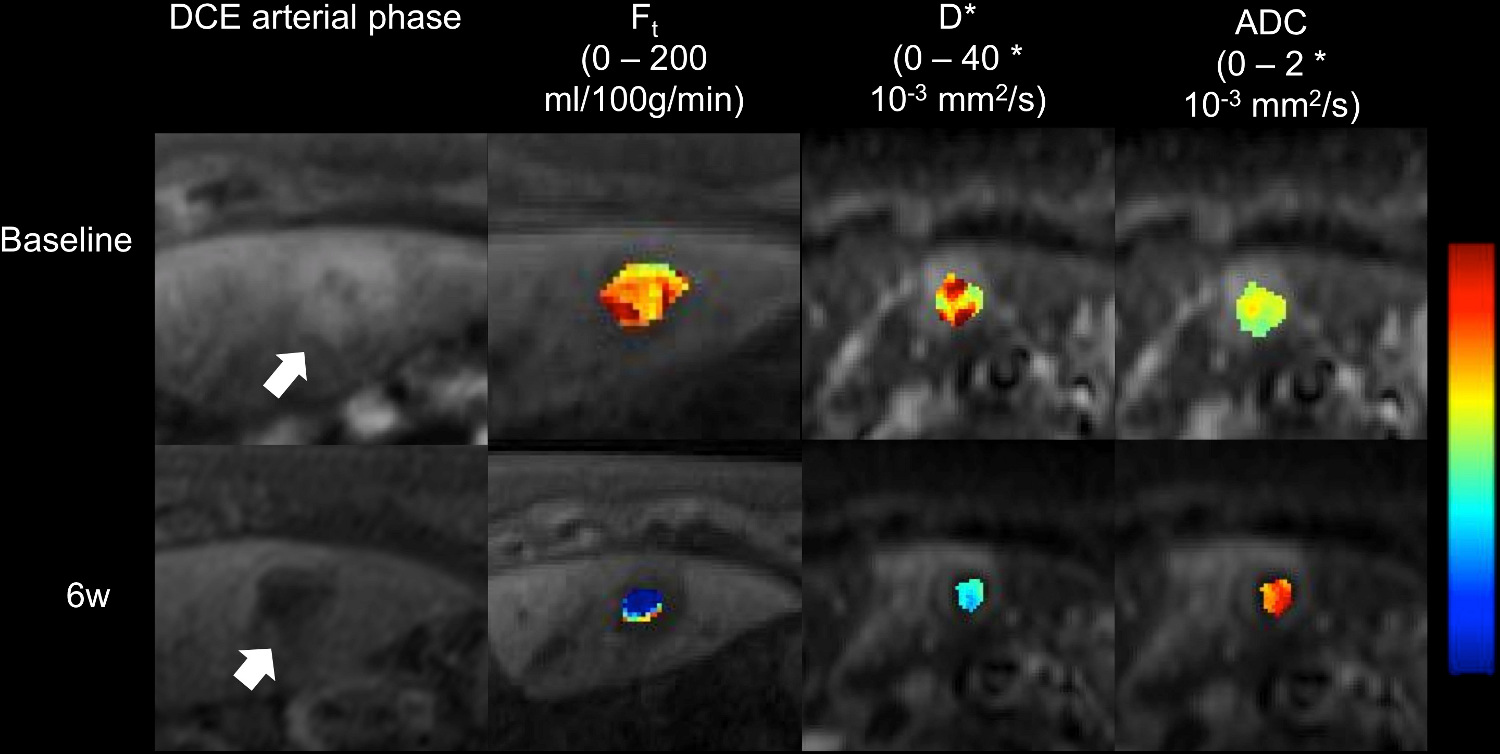
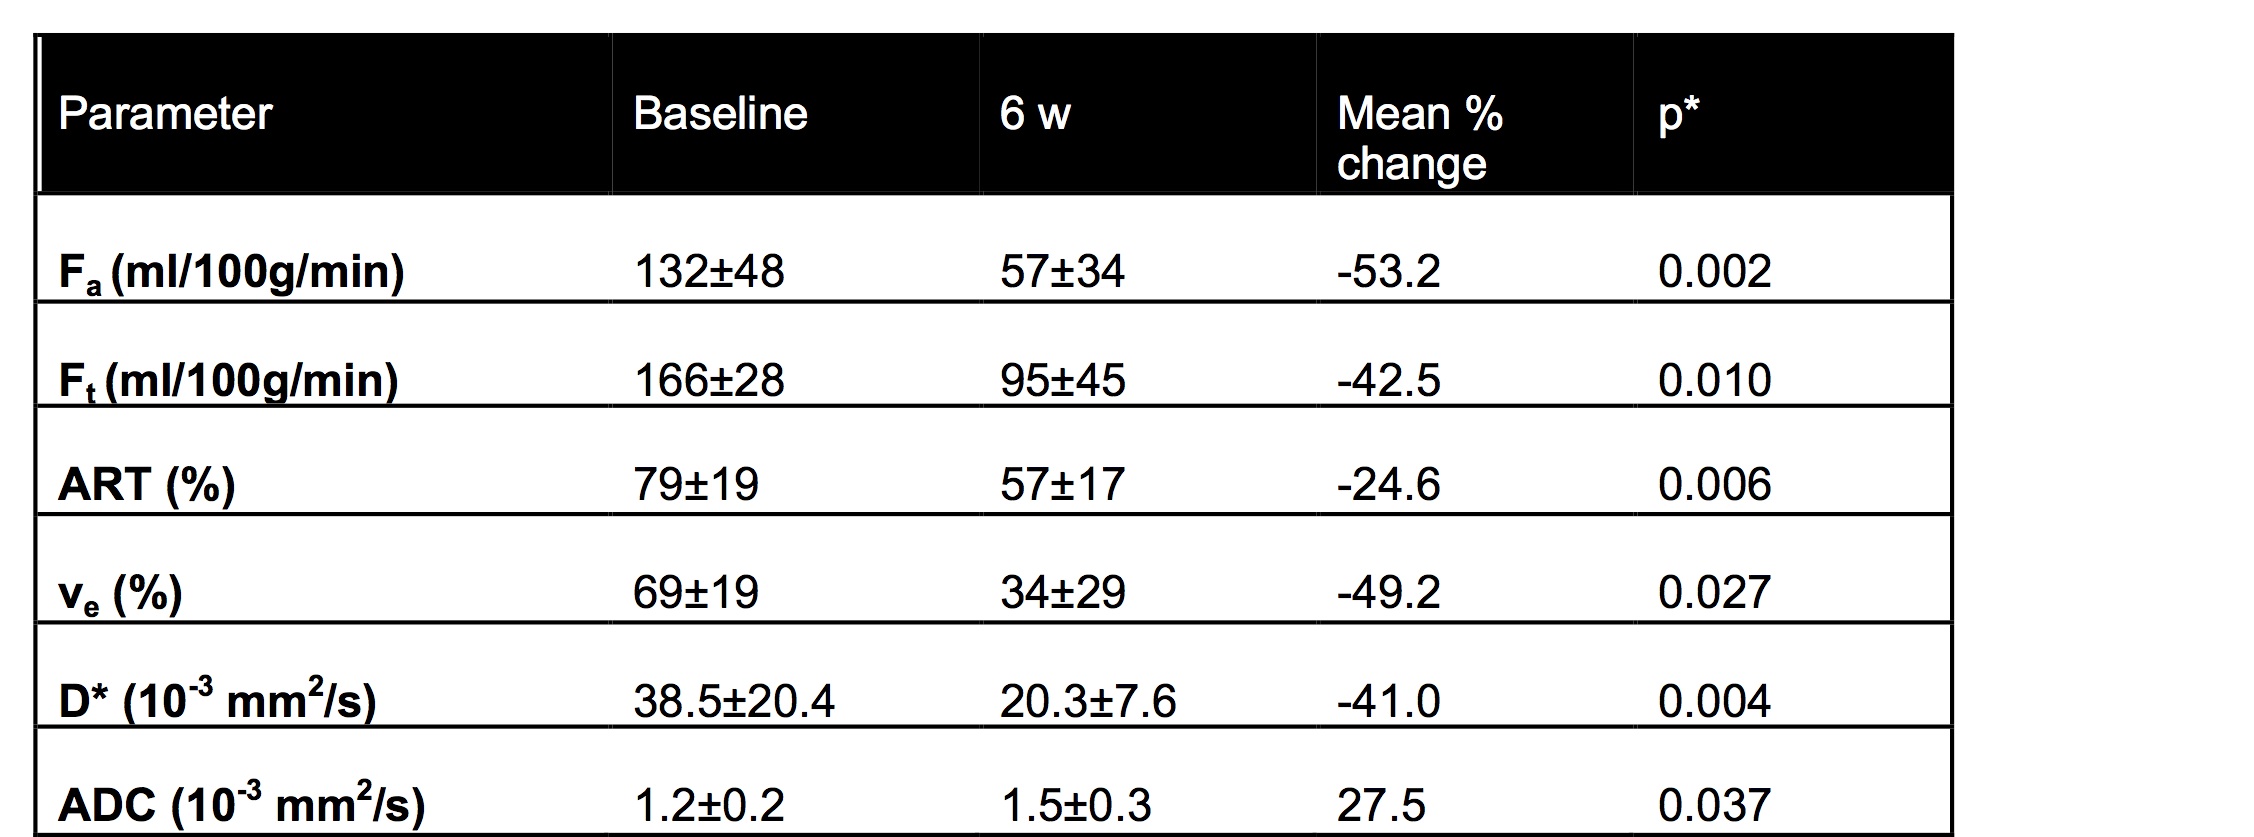
Table 1: Mean ± SD parameter values at baseline and at 6w post radioembolization for DCE-MRI and IVIM-DWI parameters that showed significant changes after treatment. The mean percentage change [100*(6w value-baseline value)/baseline value] is also shown
* Wilcoxon signed-rank test between baseline and 6w parameter values.

Figure 2: Boxplots of DCE-MRI parameters in HCC lesions before and at 6w after radioembolization. The p-value between before and after treatment is shown on top of each plot.
ART = arterial fraction; Fa = arterial flow; fi = uptake fraction; Fp = portal venous flow; Ft = total flow; Ki = intracellular uptake rate; MTT = mean transit time; ve = interstitial volume fraction
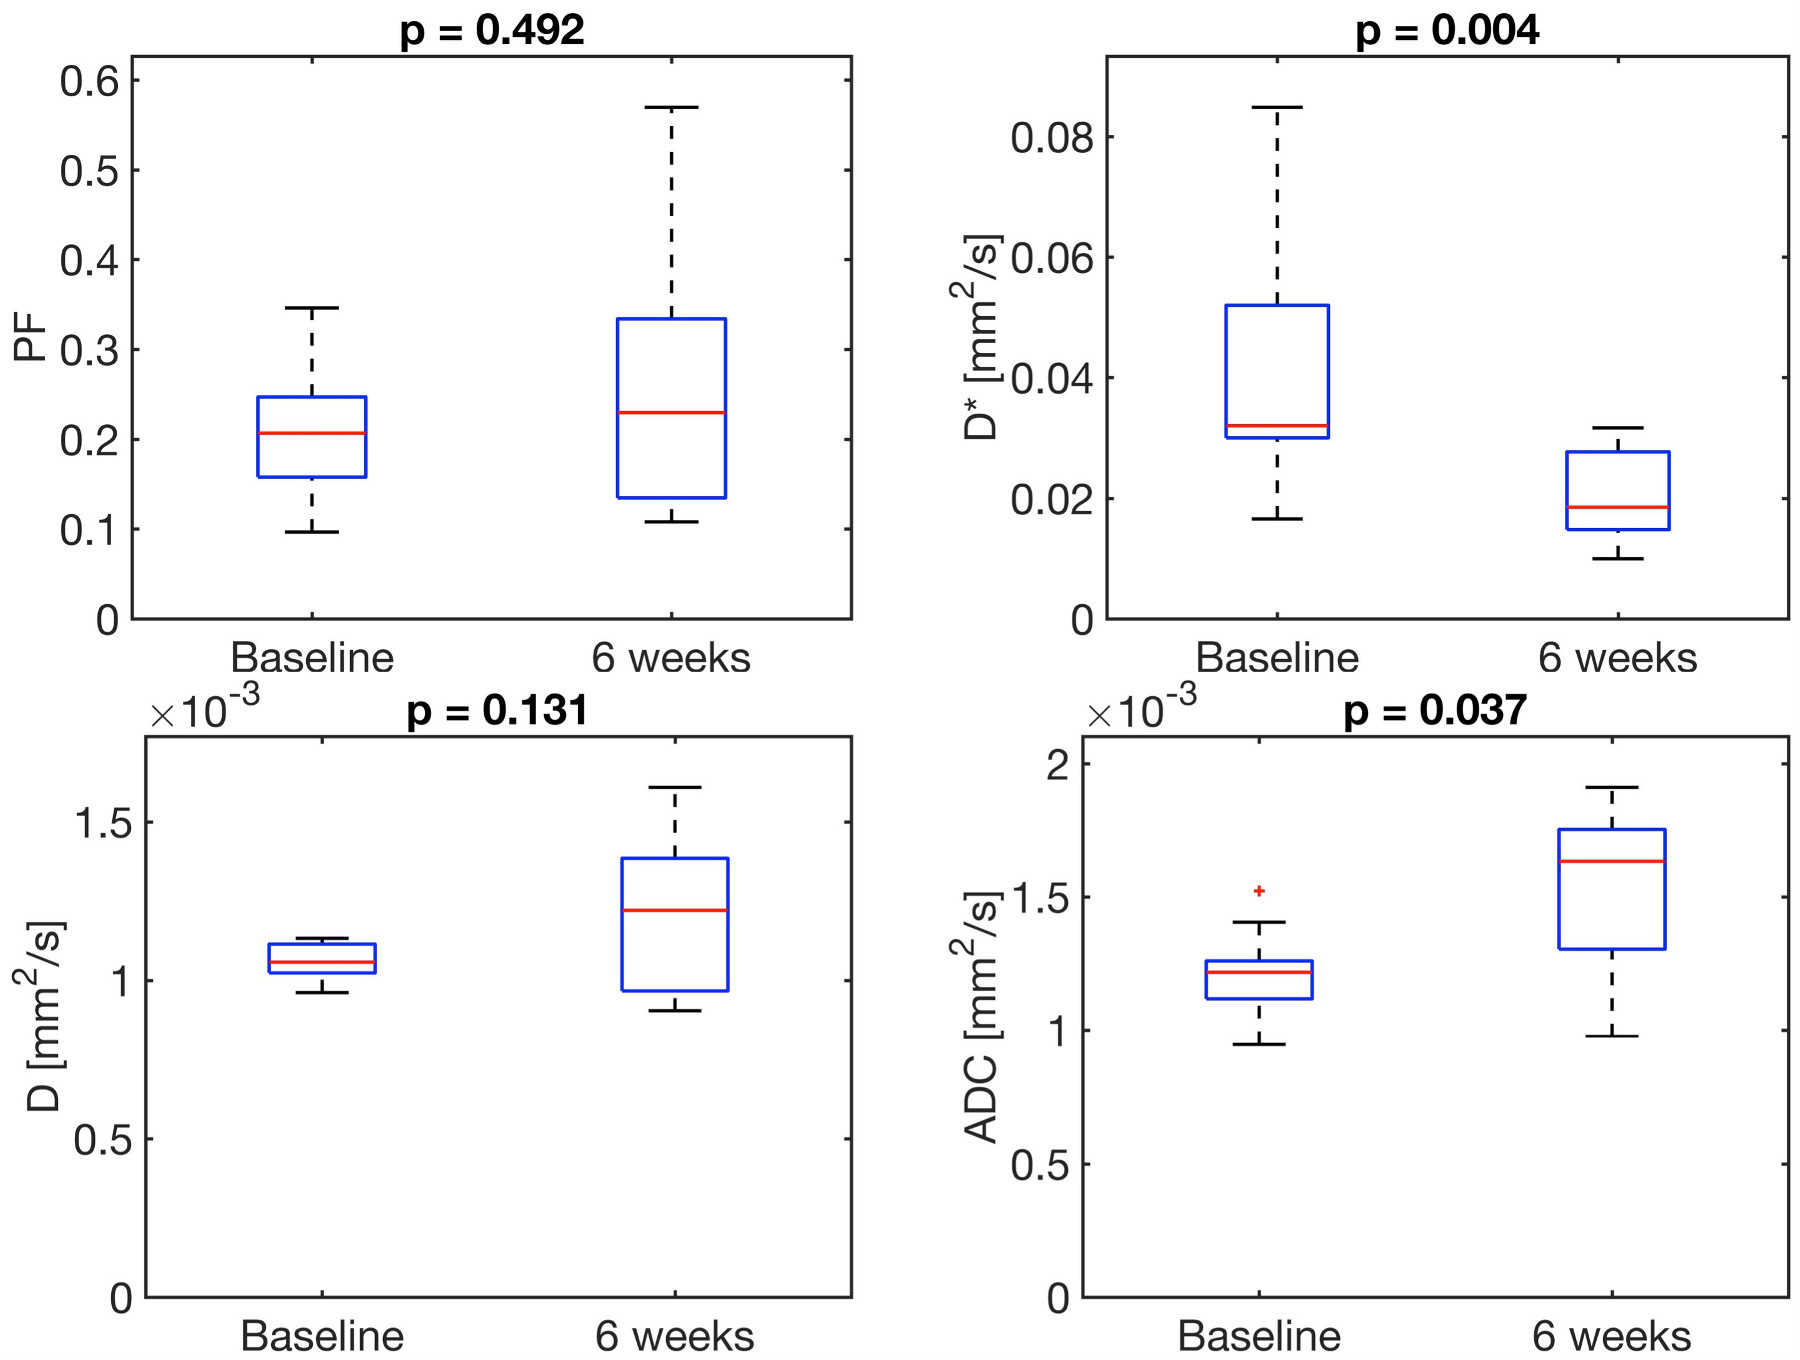
Figure 3: Boxplots of IVIM-DWI parameters in HCC lesions before and at 6 weeks after radioembolization. The p-value between before and after treatment is shown on top of each plot.
ADC = apparent diffusion coefficient; D = diffusion coefficient; D* = pseudodiffusion coefficient; PF = perfusion fraction