2623
Dynamic Contrast-Enhanced MRI to Assess Hepatocellular Carcinoma Response to Transarterial Chemoembolization: a Pilot Study.1Centre de Recherche du Centre Hospitalier de l'Université de Montréal, Montreal, QC, Canada, 2Radiology, Centre Hospitalier de l'Université de Montréal, Montreal, QC, Canada, 3Philips Healthcare Canada, Markham, ON, Canada, 4Gastroentology and Hepatology, Centre Hospitalier de l'Université de Montréal, Montreal, QC, Canada, 5Surgery, Hepatopancreatobiliary and Liver Transplantation Division, Centre Hospitalier de l'Université de Montréal, Montreal, QC, Canada, 6Polytechnique Montréal, Montreal, QC, Canada
Synopsis
Hepatocellular carcinoma response to transarterial chemo-embolization is traditionally assessed by qualitative interpretation of imaging features and enhancement dynamics. However, quantitative parameters derived by fitting a dual-input single-compartment model on dynamic contrast-enhanced-MRI data show promise, as they may help discriminate non-viable from viable tumors after treatment. Peak enhancement ratio significantly decreased after transarterial chemo-embolization in tumors with complete response (i.e. non-viable tumor group). This pilot study suggests that quantitative dynamic contrast-enhanced-MRI parameters may be used to assess treatment response.
Intended audience
Physicians (radiologists, interventional radiologists, hepatologists, oncologists), image analysts, and physicists with an interest in dynamic contrast-enhanced MRI.Background
Hepatocellular carcinoma (HCC) is the 6th most common cancer and the 2nd leading cause of cancer mortality worldwide.1 Transarterial chemo-embolization (TACE) is the first-line of treatment recommended for intermediate stage HCC, defined as multinodular tumor and reasonable liver function (Child-Pugh score of A or B) in asymptomatic patients.2 The traditional approach to diagnosis and assesssment of the treatment response of HCC is to perform contrast-enhanced (DCE)-MRI with higher spatial resolution, but low temporal resolution (i.e. 4-5 time points spaced 30 seconds apart) for qualitative interpretation of active HCC tumor. Alternatively, DCE-MRI using higher temporal resolution may be used to derive objective quantitative metrics of active HCC tumor3.
Purpose
The purpose of this study was to evaluate the diagnostic performance of quantitative DCE-MRI perfusion parameters for assessing tumor response of HCC to TACE.Method
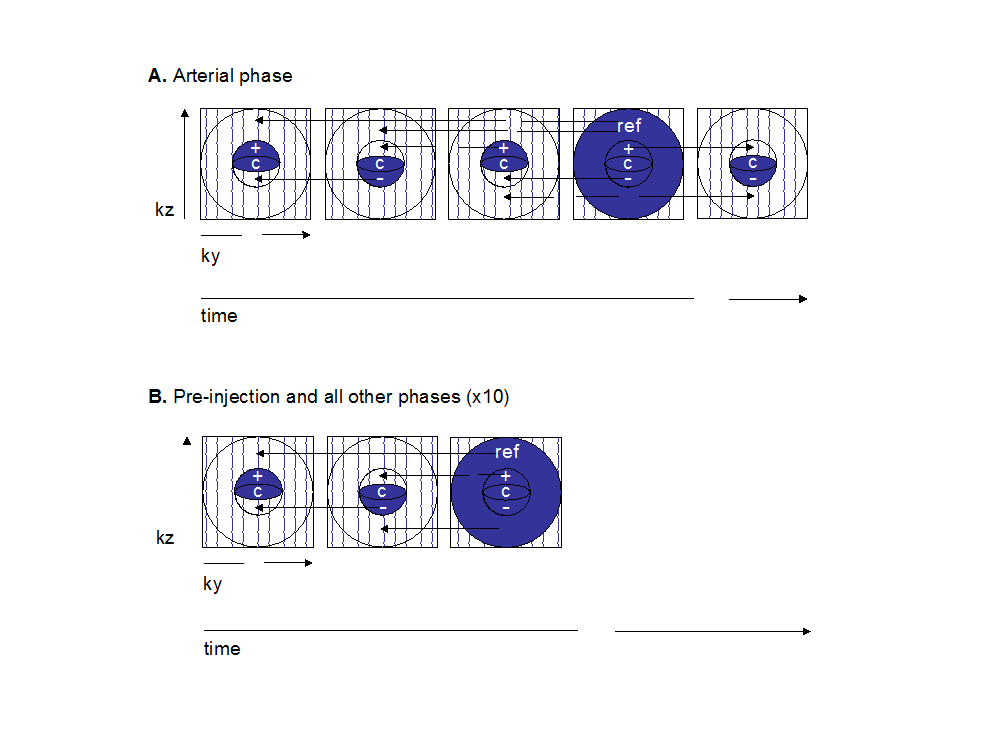
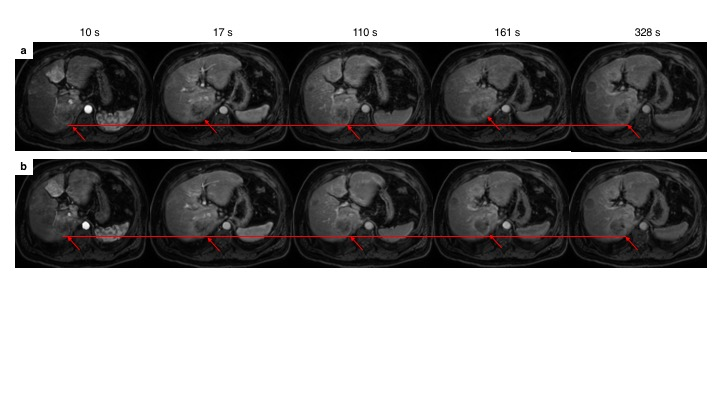
This single-site prospective study was approved by our institutional review board. All subjects provided written and informed consent. Patients scheduled for TACE treatment according to their clinical standard of care were eligible in this study. They underwent a pre-treatment MRI within 2 weeks prior to TACE and a follow-up examination 6 to 8 weeks after TACE. Imaging was performed on a 3.0 T MRI system (Achieva TX, Philips Healthcare, Best, The Netherlands). Prior to contrast injection, T1 mapping was performed using the multiple flip-angle method with 3D mDixon acquisitions with flip angles of 4, 10 and 20 degrees. After injection of gadobenate dimeglumine (MultiHance®, Gd-BOPTA, Bracco Imaging SpA, Milan, Italy), a dynamic 4D mDixon imaging scheme was used. Images were acquired over 10 consecutive breath-holds at end-expiration extending up to approximately 5 minutes after injection. All but the first breath-holds consisted of two keyhole acquisitions as well as an acquisition of the entire k-space. Two extra keyhole acquisitions were performed for the first breath-hold, to ensure a better evaluation of the arterial phase. Imaging parameters are listed in Figure 1. A motion compensation software (MoCo, Corstem, Montreal, Canada) was used to register all images using nonrigid, subpixel deformation maps (Figure 2).4 After motion correction, four regions of interest (ROI) were drawn on multiple slices on the abdominal aorta, portal vein, liver parenchyma and liver tumors (annotated by fellowship-trained abdominal radiologists) to create time-intensity curves. A nonparametric analysis was performed on experimental data of signal intensity to extract empirical parameters: time-to-peak, peak enhancement ratio, normalized maximum intensity time ratio, wash-in and wash-out slopes. Signal intensity for ROIs described above was converted to concentration of contrast agent using a linear conversion with T1 mapping. A dual-input single-compartment model was fitted to data to calculate the transfer constants from the blood vessels to the surrounding tissue, and the transfer constant from the liver tissue to the central vein5, from which it is possible to deduce the tissue blood flow as well as the arterial fraction.6 The reference standard for response to TACE was the interpretation by radiologists of individual tumor response according to LI-RADS v2017 treatment response criteria. Radiologists were blinded to the results of the DCE-MRI analysis and the research assistant performing DCE-MRI was blinded to the interpretation of radiologists. The comparisons within groups (before vs. after treatment) and between groups (non-viable vs. viable tumor) were performed with paired and unpaired Wilcoxon rank tests respectively. Diagnostic performance of parameters was explored by receiver operating characteristic (ROC) analysis.Results
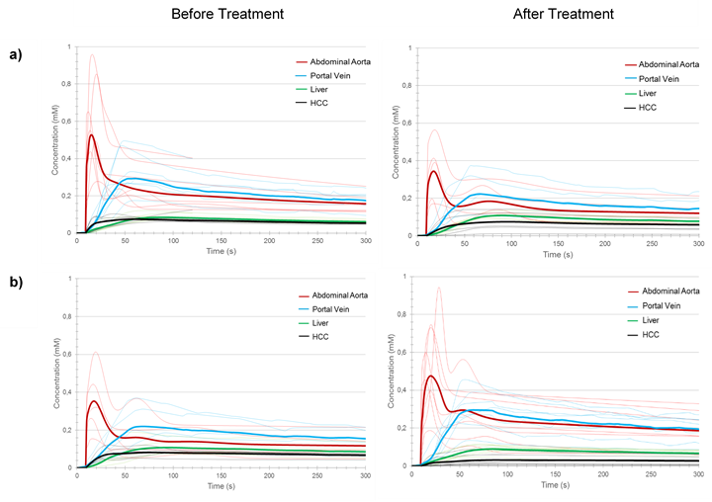
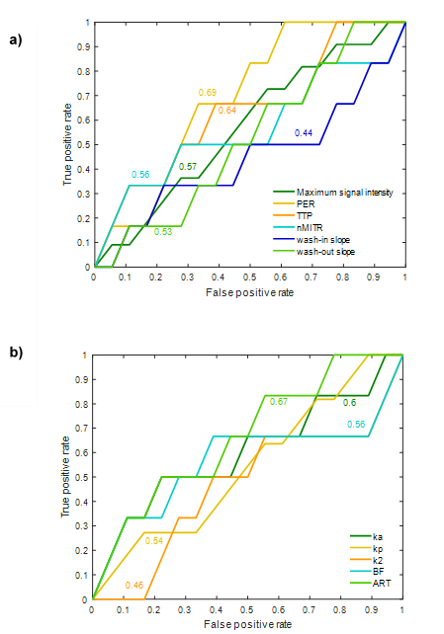
Twelve patients totaling 18 HCC with size ranging from 12 to 87 mm were included in this pilot study. Figure 3 shows concentration curves for individual tumors and averaged for all tumors. Table 1 summarizes nonparametric and parametric analyses for the two groups (non-viable vs. viable tumors) at baseline and after treatment. Peak enhancement ratio, normalized maximum intensity time ratio, wash-in, ka, blood flow and arterial fraction significantly decreased (P < 0.05) and time to peak significantly increased (P = < 0.01) after treatment for non-viable tumors. Time to peak also significantly increased after treatment for viable tumors (P = 0.03). Change in peak enhancement ratio was significantly different between groups (P = 0.05). Figure 4 shows the ROC curves of non-parametric and parametric analyses for differentiation of non-viable vs. viable tumors. The peak enhancement ratio provided the highest area under the ROC curve (AUC = 0.69).Conclusion
This study shows that several perfusion parameters measured by DCE-MRI may vary after TACE treatment for HCC.6, 7 In particular, the peak enhancement ratio may be used for objective assessment of tumor response. Further prospective validation is required.Acknowledgements
This work has been supported by an Operating Grant from the Canadian Institutes of Health Research (CIHR)-Operating Grant (CIHR #340909). An Tang is supported by a Career Award from the Fonds de recherche du Québec en Santé and Association des Radiologistes du Québec (FRQS-ARQ #34939) and a New Researcher Startup Grant from the Centre de Recherche du Centre Hospitalier de l'Université de Montréal (CRCHUM).References
1. Tang A, Hallouch O, Chernyak V, et al. Epidemiology of hepatocellular carcinoma: target population for surveillance and diagnosis. Abdom Radiol (NY). 2017 Jun 24. [Epub]
2. Bruix J, Sherman M, American Association for the Study of Liver D. Management of hepatocellular carcinoma: an update. Hepatology. 2011;53(3):1020-1022.
3. Thng CH, Koh TS, Collins D, et al. Perfusion imaging in liver MRI. Magn Reson Imaging Clin N Am. 2014;22(3):417-432.
4. Benovoy, M., Jacobs, M., Dahdah, N., Arai, A. E., & Hsu, L. Y. Robust universal nonrigid motion correction framework for first‐pass cardiac MR perfusion imaging. J Magn Reson Imaging. 2017 Oct;46(4):1060-1072.
5. Wang H, Cao Y. Correction of arterial input function in dynamic contrast-enhanced MRI of the liver. J Magn Reson Imaging. 2012;36(2):411-421.
6. Materne R, Smith AM, Peeters F, et al. Assessment of hepatic perfusion parameters with dynamic MRI. Magn Reson Med. 2002;47(1):135-142.
7. Taouli B, Johnson RS, Hajdu CH, et al. Hepatocellular carcinoma: perfusion quantification with dynamic contrast-enhanced MRI. AJR Am J Roentgenol. 2013;201(4):795-800.
8. Hirashima Y, Yamada Y, Tateishi U, et al. Pharmacokinetic parameters from 3-Tesla DCE-MRI as surrogate biomarkers of antitumor effects of bevacizumab plus FOLFIRI in colorectal cancer with liver metastasis. Int J Cancer. 2012;130(10):2359-2365.
Figures