2622
In primary sclerosing cholangitis, diffusion weighted magnetic resonance imaging correlates better with liver stiffness than Gadoxetate disodium enhanced MR imaging1Diagnostic and Interventional Radiology, University Medical Center Hamburg-Eppendorf, Hamburg, Germany, 2Neuroradiology, University Medical Center Hamburg-Eppendorf, Hamburg, Germany, 3Nuclear Medicine, University Medical Center Hamburg-Eppendorf, Hamburg, Germany, 4MRI, Philips Medical Systems, Hamburg, Germany, 5Internal Medicine, University Medical Center Hamburg-Eppendorf, Hamburg, Germany
Synopsis
Several disadvantages of DCE-MRI, such as long examination time, application of intravenous contrast agents and elaborative postprocessing and the higher sensitivity of the ADC to differentiate several stages of fibrosis, favorites DWI over DCE-MRI for diagnosis and staging of fibrosis in routine clinical MRI of PSC patients.
Introduction
The initial diagnosis of PSC is based on clinical, biochemical, and cholangiographic findings. According to newest guidelines of the European Association of the Study of the Liver (EASL), magnetic-resonance cholangiopancreaticography (MRCP) is proposed as first line diagnostic measure for investigating bile duct abnormalities on initial presentation and follow up examinations [1,2]. Fibroscan is a novel, non-invasive and rapid method to measure liver stiffness [3] and has been classified according to histopathological fibrosis staging system (METAVIR [4]) [5]. The aim of this study was to compare the diagnostic effectiveness of dynamic contrast-enhanced (DCE) and diffusion-weighted (DWI) magnetic resonance imaging (MRI) for diagnosis and staging of hepatic fibrosis in primary sclerosing cholangitis (PSC).Material and Methods
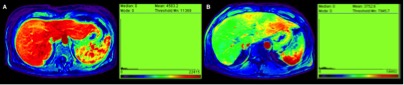
47 patients (male:female 31:16 mean age 43.9 ± 14.3 years) with diagnosed PSC according to EASL guidelines were examined on a 3.0 T scanner with an 24-channel body coil. The volume was imaged with a dynamic contrast-enhanced MRI with 140 dynamic scans over the whole liver volume with a scan time of 3 sec after intravenous administration of gadoxetic acid using a T1-weighted three-dimensional (3D) FFE (TR/ TE/flip angle 3.9 ms/1.15 ms/20°, field of view (FOV) 400 (RL), 300 (AP) and 175 (FH) mm, acquisition matrix 160 x 107, reconstruction matrix 320 x 320 (Reconstruction voxel size 1.25 mm), 70 slices, slice thickness 3 mm with slice oversampling factor of 1.6 and SENSE factor 2.5 (AP)/2 (FH)). Diffusion weighted (DWI) spin echo echo-planar sequence (ssEPI) was generated in transversal orientation covering the whole liver with following parameters: TR 1985 ms; TE 69 ms; FOV 400 x 400 mm; voxel size 1.79 x 1.79 x 3.0 mm; slice thickness 5.0 mm; intersection gap 0 mm; with consecutive b-factors of 0, 50, 100, 200, 400, 800 s/mm2; average 35 slices. Number of excitations (NEX) 2. Hepatic fibrosis was diagnosed using FibroScan performed within an interval of ± 6 month to DCE-MRI. ADC and DCE parameters were analyzed for correlation with the METAVIR fibrosis score using Pearson’s correlation test. Partial correlation analysis was used to correct for potential effects of age and gender. In addition, univariate analysis of variance was used to test quantitative ADC and DCE parameters for differences between the fibrosis stages (F0/F1, F2, F3, F4).Results
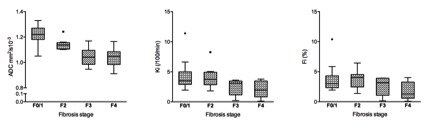
The mean ADC was 1.149 ± 0.127 mm2/s x10-3. The ADC correlated significantly with fibrosis (correlation coefficient -0.614 (95% confidence interval -0.76, -0.39); p < 0.001). Multiple comparison testing showed significant differences in discrimination of significant (F2; ADC = 1.14 ± 0.05 mm2/s x10-3; p = 0.016), severe (F3; ADC = 1.044 ± 0.08 mm2/s x10-3; p = 0.008) and cirrhosis (F4; ADC = 1.037 ± 0.08 mm2/s x10-3; p = 0.001) to healthy/mild (F0/1; ADC = 1.217 ± 0.07 mm2/s x10-3) fibrosis and cirrhosis (F4; p = .041) to significant fibrosis (F2). No statistical significance was achieved for discrimination of significant (F2) to severe fibrosis (F3; p = .149) and severe fibrosis (F3) to cirrhosis (F4; p = 1.0). Out of all parameters analyzed, the hepatic uptake rate Ki significantly both correlated to fibrosis stage (R = -0.368; (95% confidence interval -0.60,-0.08); p = 0.01) and to the ADC (R = 0.444; p = 0.003). This effect was stable after multiple comparison testing. Average Ki values demonstrated statistically significant differences between fibrosis stages F0/1 (Ki = 4.141 ± 2.02/100/min) versus F4 (Ki = 2.09 ± 1.40/100/min; p = 0.034; 95% confidence interval 0.012,0.397). The AUC of Ki for discrimination of F0/1 from F3 was 0.714 (95% CI 0.497, 0.931) with a cut-off value of Ki = 0.353 /100/min reaching a sensitivity of 0.857 and a specificity of 0.50. The AUC for discrimination of F0/1 from F4 was 0.795 (95% CI 0.599, 0.992), with a cut-off value Ki = 0.355 /100/min reaching a sensitivity of 0.875 and a specificity of 0.50Discussion
This study is the first to analyze the diagnostic efficacy of Gd-EOB-DTPA-enhanced magnetic resonance tomography in comparison to diffusion-weighted imaging (DWI) for differentiation of Fibroscan derived stages of liver fibrosis in PSC patients. Applying an already validated dual-input, two-compartment model, the quantitative parameter hepatocellular uptake rate Ki correlated inversely to hepatic fibrosis stage, with values that significantly differed between cirrhosis and non- to mild fibrosis (F1/0). Taken into account the long examination time, possible adverse effects of contrast-agent administration and elaborative postprocessing of DCE-MRI, the ADC is considered to be the superior measure of hepatic fibrosis.Conclusion
Diffusion-weighted imaging and Gd-EOB-DTPA-enhanced MRI are reliable techniques to diagnose late stages of hepatic fibrosis. Several disadvantages of DCE-MRI and the higher sensitivity of the ADC to differentiate several stages of fibrosis, favorites DWI over DCE-MRI for diagnosis and staging of fibrosis.Acknowledgements
No acknowledgement found.References
1. Chapman, R., et al., Diagnosis and management of primary sclerosing cholangitis. Hepatology, 2010. 51(2): p. 660-78.
2. Schramm, C., et al., Recommendations on the use of MRI in PSC-A position statement from the International PSC study group. Hepatology, 2017.
3. Saito, H., et al., Efficacy of non-invasive elastometry on staging of hepatic fibrosis. Hepatol Res, 2004. 29(2): p. 97-103.
4. Bedossa, P. and T. Poynard, An algorithm for the grading of activity in chronic hepatitis C. The METAVIR Cooperative Study Group. Hepatology, 1996. 24(2): p. 289-93.
5. Castera, L., et al., Prospective comparison of transient elastography, Fibrotest, APRI, and liver biopsy for the assessment of fibrosis in chronic hepatitis C. Gastroenterology, 2005. 128(2): p. 343-50.
Figures