2621
Comparison of the diagnostic performances of three methods of ROI placement for the measurements of Intravoxel incoherent motion diffusion-weighted MR imaging parameters in hepatocellular carcinoma1Radiology, West China Hospital, Sichuan University, Chengdu, China, 2Radiology, West Chian Hospital, Sichuan University, Chengdu, China, 3GE Healthcare, China, Beijing, China
Synopsis
The pathological differentiated grade is heavily associated with the hepatocellular carcinoma prognosis. Through a prospectively research, we sought to determine the diagnostic performances of three methods of ROI placement for measurements of IVIM parameters in the grading of hepatocellular carcinoma. According to the results, we found that different ROI positioning methods used significantly affects the IVIM and ADC parameters measurements. Measurements of ADCslow value derived from whole tumor volume method entailed the highest diagnostic performance in grading hepatocellular carcinoma. These results suggested that ADCslow value derived from whole tumor volume method might be useful in assessing the differentiated grade of carcinoma, and which might be helpful in predicting the patients’ prognosis.
Introduction
Hepatocellular carcinoma (HCC) is the fifth most common cancer worldwide, and the second leading cause of cancer related to death [1]. However, the overall prognosis still remains poor due to the diagnosis at late stage and high recurrence [2]. Pathological differentiated grade is one of the most important factor for the recurrence and prognosis of HCC, as poorly differentiated HCC often associated with worse survival compared with well and moderately differentiated HCC. Recently, investigators have demonstrated that Intravoxel incoherent motion (IVIM) can be useful in the grading of HCC but literatures on the use of IVIM for the grading of HCC is inconsistent. While some investigators demonstrated strong correlation between apparent diffusion coefficient (ADC) values and pathological differentiated grade [3-7], others reported no correlation was obtained [8]. Several studies demonstrated significantly higher ADC values in well differentiated HCC compared with moderately differentiated HCC [3-5], whereas others reported no difference [5]. These conflicting results may be attributed to several factors, including field strength and the heterogeneous of the tumor tissue as whether the representative part of tumor tissue or the whole tumor volume should be included in the region of interest (ROI). To our knowledge, few studies have compared the diagnostic performance of IVIM parameters and DWI on their capabilities to evaluate the pathological differentiated grade of HCC by using different methods of ROI positioning strategies. The purpose of this study was to prospectively determine the diagnostic performance of IVIM parameter and ADC in differentiating the pathological differentiated grade of HCC, and to subsequently evaluate the effect of different ROI positioning methods for the IVIM parameters and ADC measurements.Methods
Between January 2016 and April 2017, eighty-seven patients (63 men and 24 women; mean age, 53.20±10.66 years; range, 30-74 years) with newly diagnosed 91 HCCs were studied by using IVIM imaging. MR imaging was performed by using a 3.0 T MR system (Discovery MR750, GE Healthcare, Milwaukee, USA). An eight-channel phased-array torsor coil (GE Medical System) was used for all measurements. IVIM was performed by using an echo-planner imaging in the axial plane with respiratory gating. The parallel imaging was used and the parameters were: TR/TE, 3158/61.3 ms; field of view, 38 ×28.5 cm2; matrix size, 128×128. Thirteen b values from 0 to 1200 s/mm2 (0, 10, 20, 40, 80, 100, 150, 200, 400, 600, 800, 1000, 1200) were used and the NEX for each b was 1, 6, 4, 2, 2, 2, 1, 1, 2, 4, 6, 6, 8. IVIM was calculated by using bi-exponential with the equation:
S(b)/S(0)=fexp(-b×ADCfast)+(1-f)exp(-b×ADCslow)
Two attending radiologists identified the selection of the representative sections and tumor tissue for ROI positioning. Three different kinds of ROI positioning methods including the whole tumor volume (WTV) method, three-ROIs method (placement of three ROIs on three different sections) and one-section method (placement of single ROI on one section) were used for the measurement. Kruskal-Wallis rank test was used to compare the difference of the ROI positioning methods in each parameter. Receiver operating characteristics (ROC) curves analyses were performed to evaluate the diagnostic performance and the cutoff point was selected by using the maximized values of Youden index.
Results
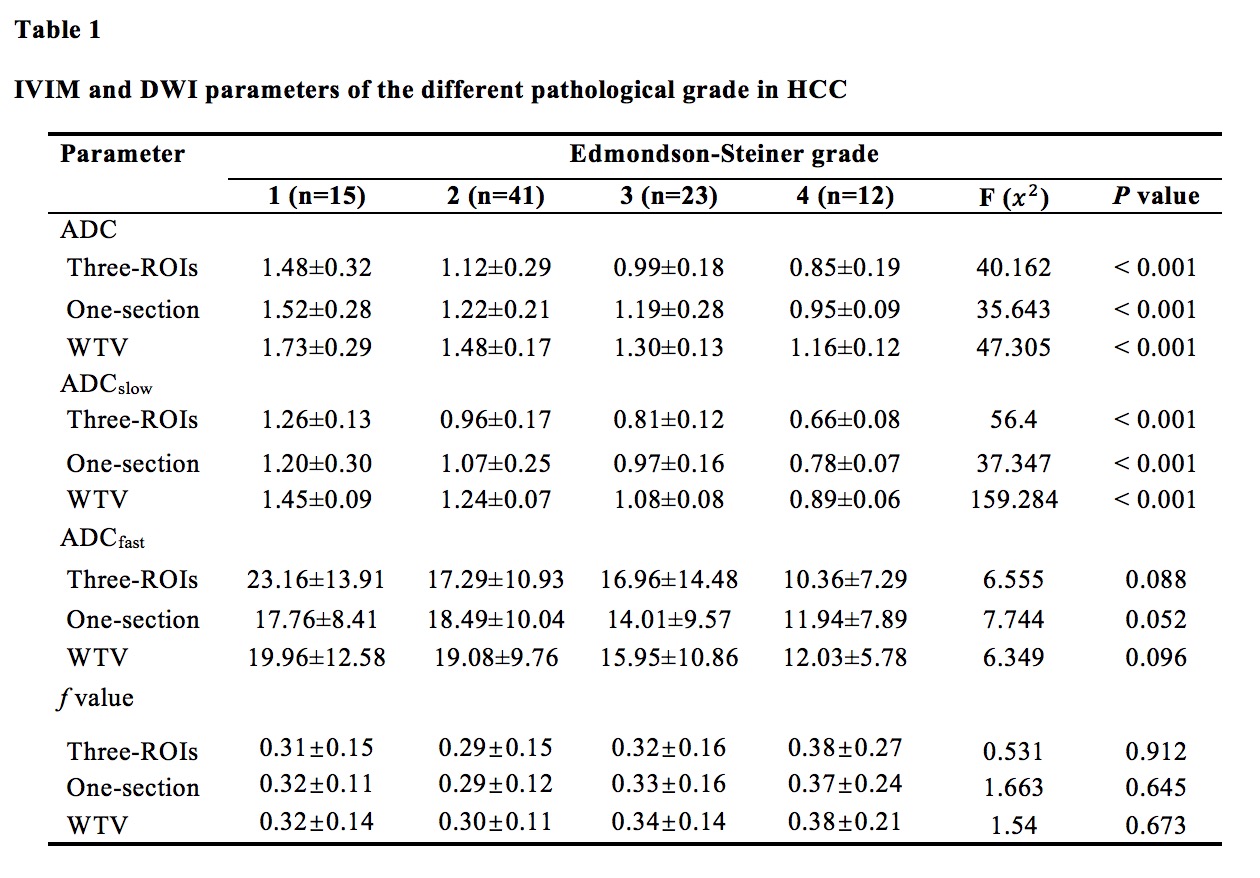
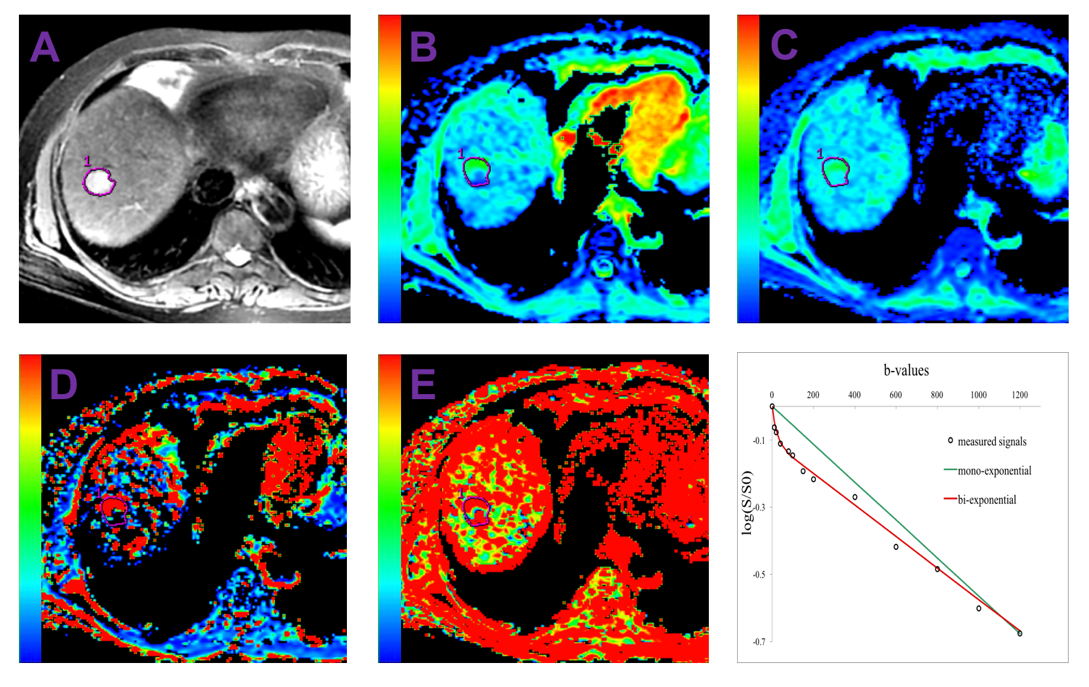
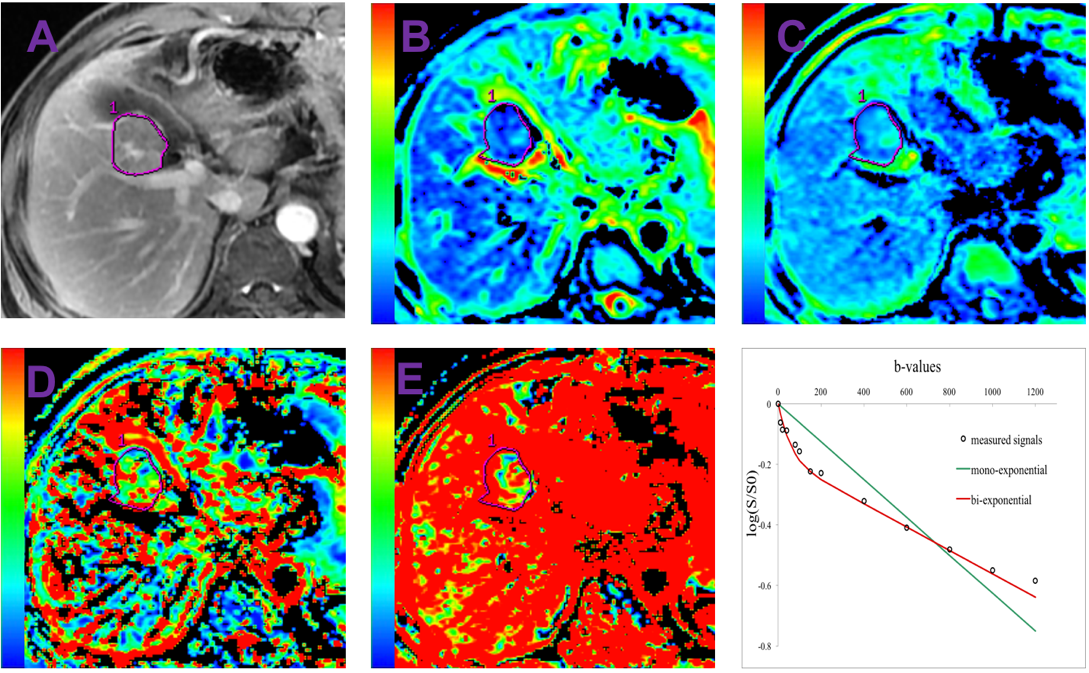
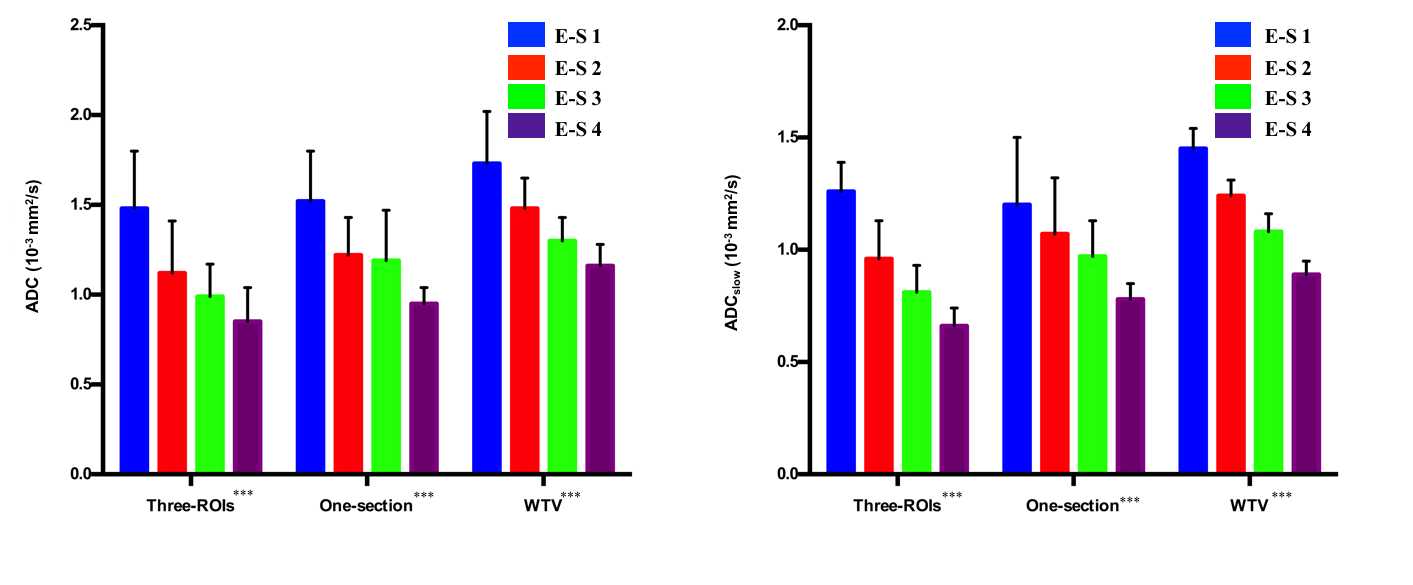
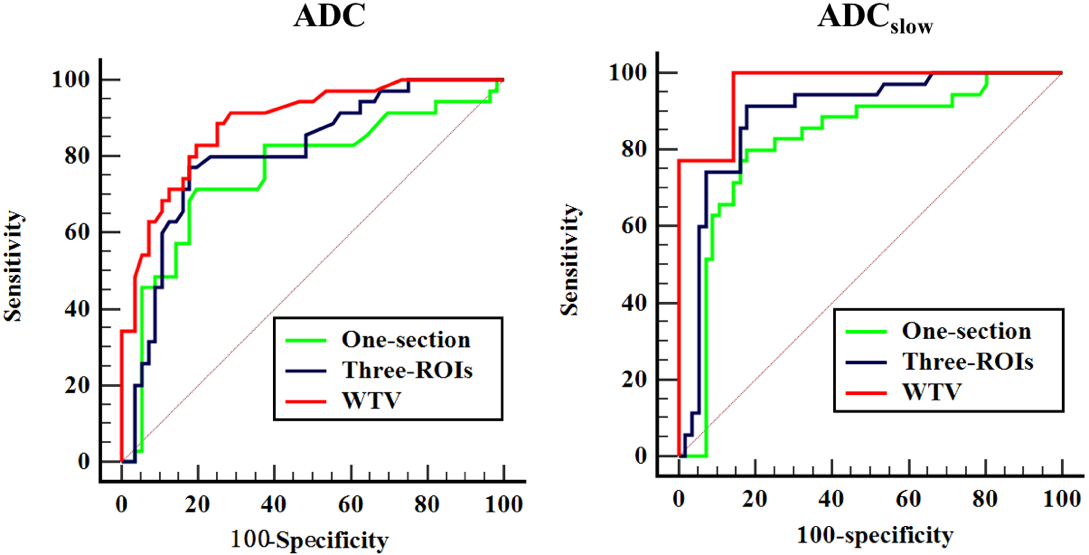
For the ADC and true ADC (ADCslow), the mean value measured by using WTV method was significant higher than the one-section and three-ROIs method (ALL P<0.001), statistical significance was also obtained between one-section and three-ROIs method (ALL P<0.05). However, pseudo ADC (ADCfast) value (P=0.755) and perfusion fraction (f) value (P=0.652) did not show a statistical significance in the three different ROI positioning methods. ADC and ADCslow values showed a statistical significance in grading HCC (Fig. 1-3) (ALL P<0.001) (Table 1). For the ADCslow, the highest area under curve (AUC) with a value of 0.967 was obtained by using the WTV method, followed by the three-ROIs method with the value of 0.890, and 0.821 for the one-section method. Additionally, for the ADC, AUC values were 0.887 for WTV method, 0.808 for three-ROIs method, 0.758 for one-section method. The AUC values for the WTV method was statistically greater than one-section and three-ROIs method (ALL P<0.05) (Figure 4).Conclusion and Discussion
Different ROI positioning methods used significantly affects the IVIM parameters and ADC measurements. Measurements of ADCslow value derived from WTV method entailed the highest diagnostic performance in grading HCC.Acknowledgements
Thank you for the patients who were willing to devote themselves to the medical research.References
1. Torre LA, Bray F, Siegel RL, Ferlay J, Lortet-Tieulent J, Jemal A. Global cancer statistics, 2012. CA: a cancer journal for clinicians 2015;65(2):87-108.
2. Recio-Boiles A, Babiker HM. Cancer, Liver. [Updated 2017 Aug 29]. In: StatPearls [Internet]. Treasure Island (FL): StatPearls Publishing; 2017 Jun-. Available from: http://www.ncbi.nlm.nih.gov/books/NBK448337/.
3. Nishie A, Tajima T, Asayama Y, et al. Diagnostic performance of apparent diffusion coefficient for predicting histological grade of hepatocellular carcinoma. European journal of radiology 2011;80(2):e29.
4. Nakanishi M, Chuma M, Hige S, et al. Relationship between diffusion-weighted magnetic resonance imaging and histological tumor grading of hepatocellular carcinoma.[J]. Annals of Surgical Oncology, 2012, 19(4):1302-1309.
5. Muhi A, Ichikawa T, Motosugi U, et al. High-b-value diffusion-weighted MR imaging of hepatocellular lesions: estimation of grade of malignancy of hepatocellular carcinoma. Journal of magnetic resonance imaging: JMRI 2009;30(5):1005-1011.
6. Nasu K, Kuroki Y, Tsukamoto T, Nakajima H, Mori K, Minami M. Diffusion-weighted imaging of surgically resected hepatocellular carcinoma: imaging characteristics and relationship among signal intensity, apparent diffusion coefficient, and histopathologic grade. AJR American journal of roentgenology 2009;193(2):438-444.
7. Granata V, Fusco R, Catalano O, et al. Intravoxel incoherent motion (IVIM) in diffusion-weighted imaging (DWI) for Hepatocellular carcinoma: correlation with histologic grade. Oncotarget 2016;7(48):79357-79364.
8. Amin MB, Edge SB, Greene FL, et al. AJCC cancer Staging Manual. 8th ed.New York:Springer;2017.
Figures