2620
Assessment of the Hepatocyte Fraction Combined with Liver Volume for the estimation of liver function1Radiology, Peking University First Hospital, Beijing, China, 2Philips Healthcare, Beijing, China
Synopsis
Hepatocyte fraction (HeF) and uptake function based on k map have becoming new biomarkers based on EOB-MR in estimation of hepatic function. Liver volume is another factor that influence the liver function. The purpose of our study was to determine whether liver function can be estimated quantitatively from EOB-MR combined with liver volume.
Introduction
The assessment of hepatic functional reserve is essential for determining the prognosis and clinical management of patients with chronic liver disease or patients who undergo liver surgery. Gadoxetic acid (Gd-EOB-DTPA) is a hepatobiliary magnetic resonance (MR) contrast agent which can be uptake into functional hepatocytes. Hepatocyte fraction (HeF) and uptake function based on K map have becoming new biomarkers based on EOB-MR in estimation of hepatic function. Liver volume is another factor that influence the liver function. The purpose of this study was to determine whether liver function can be estimated quantitatively from EOB-MR combined with liver volume.Method and Materials
Institutional review board approval and informed patient consent were obtained for this study. All the patients had underwent Gd-EOB-DTPA enhanced MR imaging (EOB-MR).
Subjects: From October 2016 to September 2017, a total of 32 patients (17m/15f, age range: 43-80 yo, average age:60±10.06 yo) who was under regular procedure of diagnosis and treatment had undergone EOB-MR. Seventeen of them had also undergone CT imaging within 1 month. The result of blood biochemical examination, include ALT, AST, BIL, DBIL, ALB, PAB, PT, were collected. And the Childe-Pugh class was recorded based on the blood examination and the patients’ clinical condition.
MRI imaging: All the imaging were scanned on a 3T scanner (Achieva TX; Philips). In addition to the conventional sequence, the 2D Look-Locker sequence (T1-TFE, TE/TR=1.7/5ms, FA=7, matrix=288*288, SW=8mm, single slice, breath holding, scan time=16s) were acquired before and 15min post injection.
Image analysis: The HeF map and Khep map were calculated by a software based on a simple pharmacokinetic model and the ΔR1 values. Two regions of interest (ROIs) were placed in the right lobe, and 1~2 ROIs were placed in the left lobe. Artefacts, focal lesions and major branches of veins were avoided. Each ROI was a circle and was chosen as large as possible (the size ranged between 1.6 cm2 and 3.5 cm2). The liver volume (LV) was calculated on the workstation (IntelliSpace Portal Philips) based on the CT imaging, and the functional LV (fLV) was calculated by total LV minus tumor volume. The average value of all ROIs for HeF and Khep were recorded. The HeF*fLV were calculated.
Statistical analysis: HeF, Khep and HeF*fLV correlation with blood biochemical examination (ALT, AST, BIL, DBIL, ALB, PAB) were assessed by Pearson's correlation coefficient. The strength of correlation was classified as strong(r=0.8-1.0), moderate(r=0.4-0.6), weak(r=0.2-0.4). HeF, Khep, HeF*fLV were compared with Childe-Pugh score by using Kruskal-Wallis test. A p-value < 0.01 was considered significant.
Results
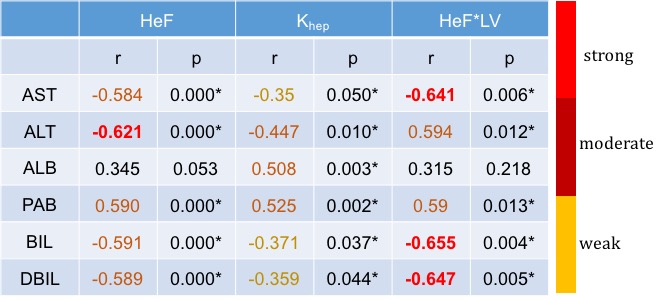
HeF and HeF*fLV showed moderate to strong correlation with ALT, AST, BIL DBIL and PAB. Khep showed weak to moderate correlation with ALT, AST, BIL, DBIL, ALB and PAB (Table 1).
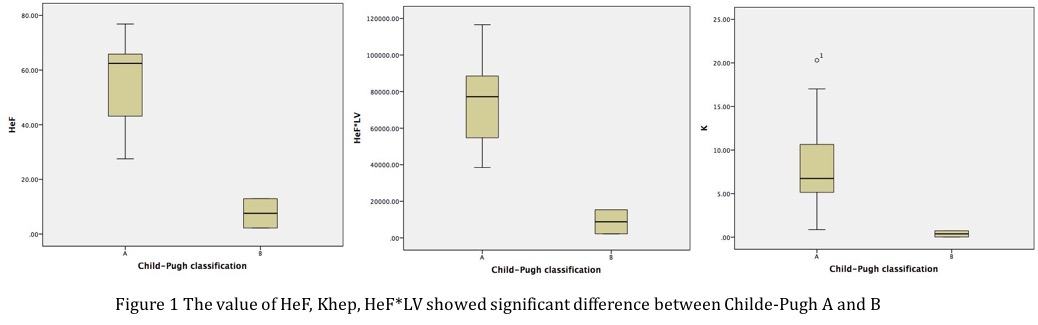
The value of HeF, Khep, HeF*fLV showed significant difference between Childe-Pugh A and B (Fig 1).
Discussion
1.Hepatocyte fraction and Khep are new biomarkers that can estimate hepatocytes and hepatic uptake. The result of our study showed that HeF, Khep, HeF*fLV are useful for evaluation of liver function.
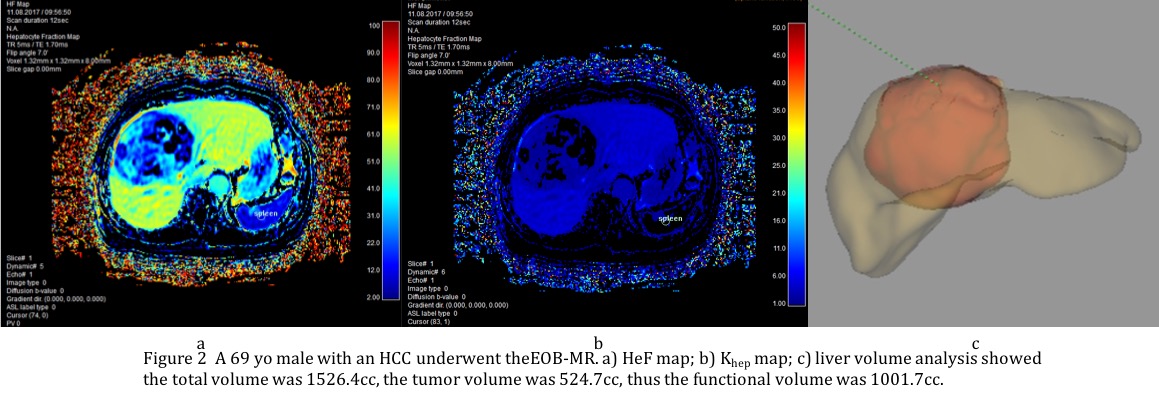
2.Besides hepatocyte function, liver volume is also an important factor that may influence the total liver function. For example, the functional liver volume may differ greatly with the total volume in patients with large tumors (Fig 2). The results of our study indicate that HeF combined with functional liver volume showed better correlation compared with HeF or Khep.
3. Limitation: 1)The patient population is too small. More patients will be recruited in this study. 2)Single slice scanning was used. 3D scanning will be better to cover the whole liver information. 3)Comparison with ICG test and pathological data will be needed for further study.
Acknowledgements
No acknowledgement found.References
1.E. Ünal et al. Semin Ultrasound CT MR, 2016; I37:549-560.
2.M. Haimerl et al. Eur Radiol, 2016; 26:1125–1133.
3. O. Dahlqvist et al. Eur Radiol, 2012; 22:642-653.
4. T. Okuaki et al. ISMRM, 2015 proc.
5. T. Okuaki et al. ISMRM, 2016 proc.
Figures