2617
Diffusion MRI alteration following the induction of mild liver fibrosis in a rabbit model1Radiology, Northwestern University, Chicago, IL, United States, 2Radiology, The Third Affiliated Hospital of Soochow University, Changzhou, China, 3Orthopedics, Qilu Hospital, Shandong University, Jinan, China, 4General Surgery, Nanfang Hospital, Southern Medical University, Guangzhou, China, 5Radiology, Peking Union Medical College Hospital, Chinese Academy of Medical Science and Peking Union Medical College, Beijing, China
Synopsis
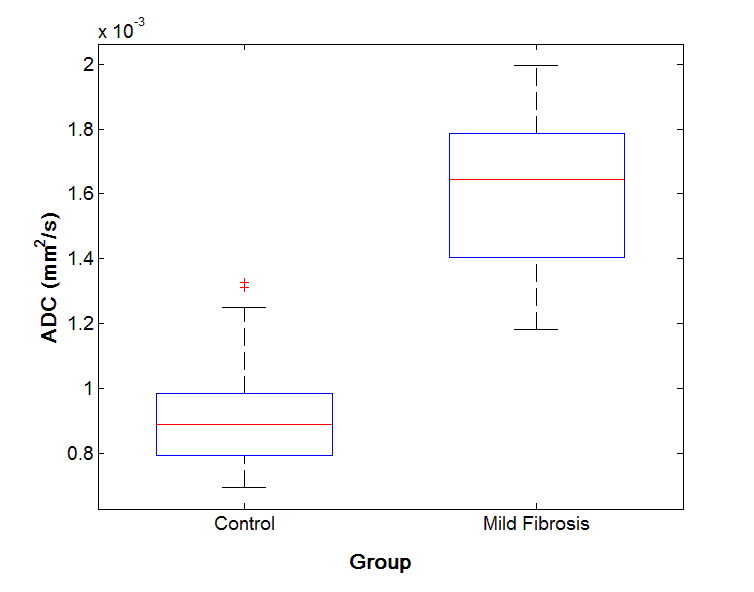
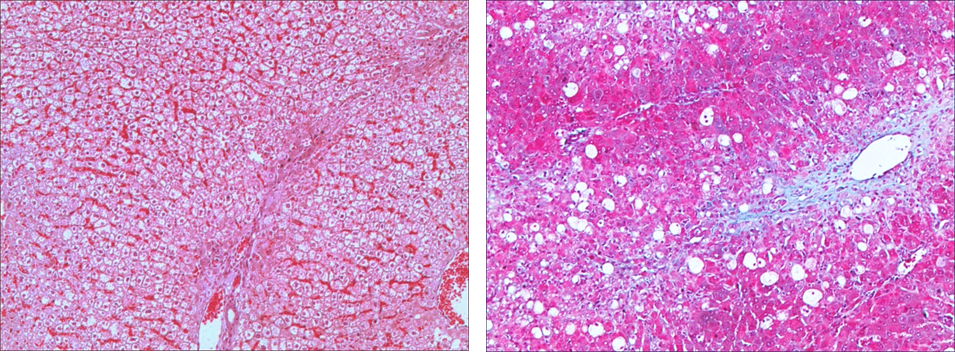
Nine rabbits were injected with carbon tetrachloride for 6 weeks to induce liver fibrosis. At the end of this period, these rabbits and 15 controls injected with saline underwent an imaging protocol including diffusion MRI. Histology showed mild fibrosis throughout the liver of the CCl4-injected animals. The Apparent Diffusion Coefficient in the liver of the fibrotic rabbits was significantly higher than in the controls. This counterintuitive result can be explained by the presence of many conflicting mechanisms during the early stage of fibrosis. If confirmed, the ADC could become a valuable tool for the early detection of liver fibrosis .
INTRODUCTION
Liver fibrosis is reversible in its early stages, whereas advanced liver fibrosis can lead to cirrhosis, liver failure, portal hypertension, and liver cancer, which often requires liver transplantation as a life-saving procedure. Therefore, early diagnosis of liver fibrosis is essential for treatment and prognosis. The gold-standard technique for the staging of liver fibrosis, which has several disadvantages: it is invasive, sometimes associated with pain and even major complications, and it suffers from sampling errors and inter-observer variability. MRI techniques have been proposed for the assessment and staging of liver fibrosis, with contradictory results1-4. Here we report Diffusion MRI results in a rabbit model of liver fibrosis.METHODS
Nine healthy New Zealand white rabbits (Experimental Animal Center of Lanzhou University) received weekly subcutaneous injections comprising 50% carbon tetrachloride (CCl4) in oily solution for 6 weeks (0.1 ml/kg for the first 3 weeks, 0.2 ml/kg from 4th to 6th week) in the neck and back. Fifteen control rabbits received subcutaneous injections with the same amount of normal saline solution instead. MRI was performed at the end of the 6 weeks on a 3 T clinical MR unit (Verio 3.0T, Siemens Medical Solutions, Erlangen, Germany) with a 32-channel head phased-array coil. Before being imaged, rabbits were anesthetized with intramuscular administration of 0.3 mL per kilogram of body weight of 2% xylazine hydrochloride and 30 mg/kg of ketamine hydrochloride. After a T2-weighted turbo spin-echo sequence for anatomical reference (TR/TE = 4000/30 ms, FOV = 210 x 210 mm2, matrix = 256 x 256, slice thickness = 4 mm), Diffusion-weighted images were acquired (TR/TE = 6600/100 ms, FOV = 210 x 210 mm2, matrix = 192 x 192, slice thickness = 4 mm) with 3 orthogonal directions of the diffusion-sensitizing gradients and 3 degrees of diffusion weighting: b = 0, 200, 500 s/mm2
Regions of interest (ROIs) were delineated in the liver parenchyma paying attention to avoid vessels and other structures. The diffusion-weighted signal was averaged in each ROI and a mono-exponential model was fitted to it using a custom code in Matlab (Mathworks, Natick, MA, USA) to compute the Apparent Diffusion Coefficient (ADC). The resulting ADC values were compared between fibrotic and control animals. Histologic slices were excised from the left lateral, right lateral, and medium lateral liver lobes of each rabbit, properly processed and stained for Masson's trichrome staining to identify collagen tissue.
RESULTS
The ADC values obtained in the fibrotic rabbits after 6 weeks of CCl4 injections were much higher than those obtained in control rabbits, as shown in the boxplots in figure 1. The difference between the two groups was statistically significant according to an unpaired two-tail t-test (p<10-6). Representative histology slides are represented in figure 2, showing a mild degree of fibrosis in the treated rabbits compared to the controls.DISCUSSION AND CONCLUSION
This study shows a dramatic ADC increase in the liver of rabbits with mild fibrosis. This result is unexpected, because fibrosis would be more intuitively associated with slow diffusion because of the presence of collagen fibers. However, this interpretation may be too simplistic and many other factors may influence the ADC, such as the total water content, inflammation, the presence of fat and iron, etc.5-6 Previous studies generally reported a poor correlation between diffusion MRI parameters and liver fibrosis, and they often focused on later stages. Our results certainly need to be confirmed, validated and understood more thoroughly, but they could be important to provide a non-invasive imaging tool for liver fibrosis detection at an early stage.Acknowledgements
This
work was supported by grants R01CA196967 and R01CA209886 funded by the USA
National Cancer Institute (National Institutes of Health)
References
1. Petitclerc L, Gilbert G, Nguyen BN, Tang A. Liver Fibrosis Quantification by Magnetic Resonance Imaging. Top Magn Reson Imaging 2017 [Epub ahead of print]
2. Park HS, Kim YJ, Yu MH, Choe WH, Jung SI, Jeon HJ. Three-Tesla magnetic resonance elastography for hepatic fibrosis: comparison with diffusion-weighted imaging and gadoxetic acid-enhanced magnetic resonance imaging. World J Gastroenterol 2014; 20(46): 17558-17767.
3. Kocakoc E, Bakan AA, Poyrazoglu OK, Dagli AF, Gul Y, Cicekci M, Bahcecioglu IH. Assessment of Liver Fibrosis with Diffusion-Weighted Magnetic Resonance Imaging Using Different b-values in Chronic Viral Hepatitis. Med Princ Pract. 2015; 24(6): 522-526
4. Zhang B, Liang L, Dong Y, Lian Z, Chen W, Liang C, Zhang S. Intravoxel Incoherent Motion MR Imaging for Staging of Hepatic Fibrosis. PLoS One. 2016; 11(1): e0147789
5. Sandrasegaran K, Territo P, Elkady RM, Lin Y, Gasparis P, Borthakur G, Lin C. Does intravoxel incoherent motion reliably stage hepatic fibrosis, steatosis, and inflammation? Abdom Radiol (NY) 2017. [Epub ahead of print]
6. Bülow R, Mensel B, Meffert P, Hernando D, Evert M, Kühn JP. Diffusion-weighted magnetic resonance imaging for staging liver fibrosis is less reliable in the presence of fat and iron. Eur Radiol 2013; 23(5): 1281-1287
Figures