2615
Comparison between MR T1ρ imaging and acoustic radiation force impulse for noninvasive assessment of liver fibrosis: repeatability, reproducibility, and diagnostic performance in rat models1Radiology, Xinhua Hospital, Shanghai Jiao Tong University School of Medicine, Shanghai, China, 2Philips Healthcare, Shanghai, China
Synopsis
The purpose of this study was to validate the repeatability, reproducibility, and diagnostic performance of MR T1ρ imaging for staging liver fibrosis, compared with ultrasound-based acoustic radiation force impulse (ARFI). The cross-sectional study was performed in rat models with carbon tetrachloride (CCl4). The results of histopathological analysis were used as reference standard. T1ρ imaging showed comparable repeatability and reproducibility with ARFI, however, manifested more accurate diagnostic performance for staging liver fibrosis, especially for detecting early stage of fibrosis.
Introduction
MR T1ρ, the spin-lattice relaxation time in the rotating frame, is sensitive to low-frequency motion of molecules, such as collagens in fibrotic tissues, and has been shown an impressing potential for evaluating liver cirrhosis.1 However, for assessing liver fibrosis, there are still contradictory results.2 Additionally, as a probable biomarker for evaluating liver fibrosis, the repeatability, reproducibility, and diagnostic performance of T1ρ need to be validated and compared with widely acknowledged biomarkers and techniques―MR or ultrasound-based elastography. However, there is a paucity of such data directly comparing T1ρ imaging with any kind of elastography in vivo. Therefore, we built the liver fibrosis in rat models with carbon tetrachloride and performed both T1ρ and acoustic radiation force impulse (ARFI) imaging, the latter which is an ultrasound-based shear-wave elastography and enables quantify liver stiffness with virtual touch tissue quantification (VTQ),3 on each rat to validate and compare the repeatability, reproducibility, and diagnostic performance of T1ρ and VTQ values for staging liver fibrosis.Method
Forty male Sprague-Dawley rats were injected with carbon tetrachloride (CCl4) to induce different stages of liver fibrosis. Fifteen healthy rats were used as control group. Animals underwent MR and ARFI examination, followed by harvesting liver samples for pathologic scoring of fibrosis (F0-F4) with METAVIR classification system. Another ten healthy rats were performed both two examinations twice on the same day and for the third time seven days later to explore the repeatability and reproducibility. MR T1ρ imaging was performed with spin-lock frequency of 500Hz and spin-lock time of 1, 10, 20, 40, 60 ms. T1ρ values were measured using ImageJ on T1ρ maps generated by an IDL software. ARFI imaging was performed using an Acuson S2000 system with a 9L4 high‑frequency probe. Ten VTQ values were recorded to calculate mean value. Repeatability and reproducibility of imaging was assessed with intraclass correlation coefficient. Analysis of variation with mixed model was used to compare quantitative values at different stages. The diagnostic performance for staging liver fibrosis was evaluated with area under receiver operating characteristic (ROC) curve (AUC). Cut-off values determined to accommodate best diagnostic accuracy were based on Youden’s index. P < 0.05 was considered to be statistically significant.Results
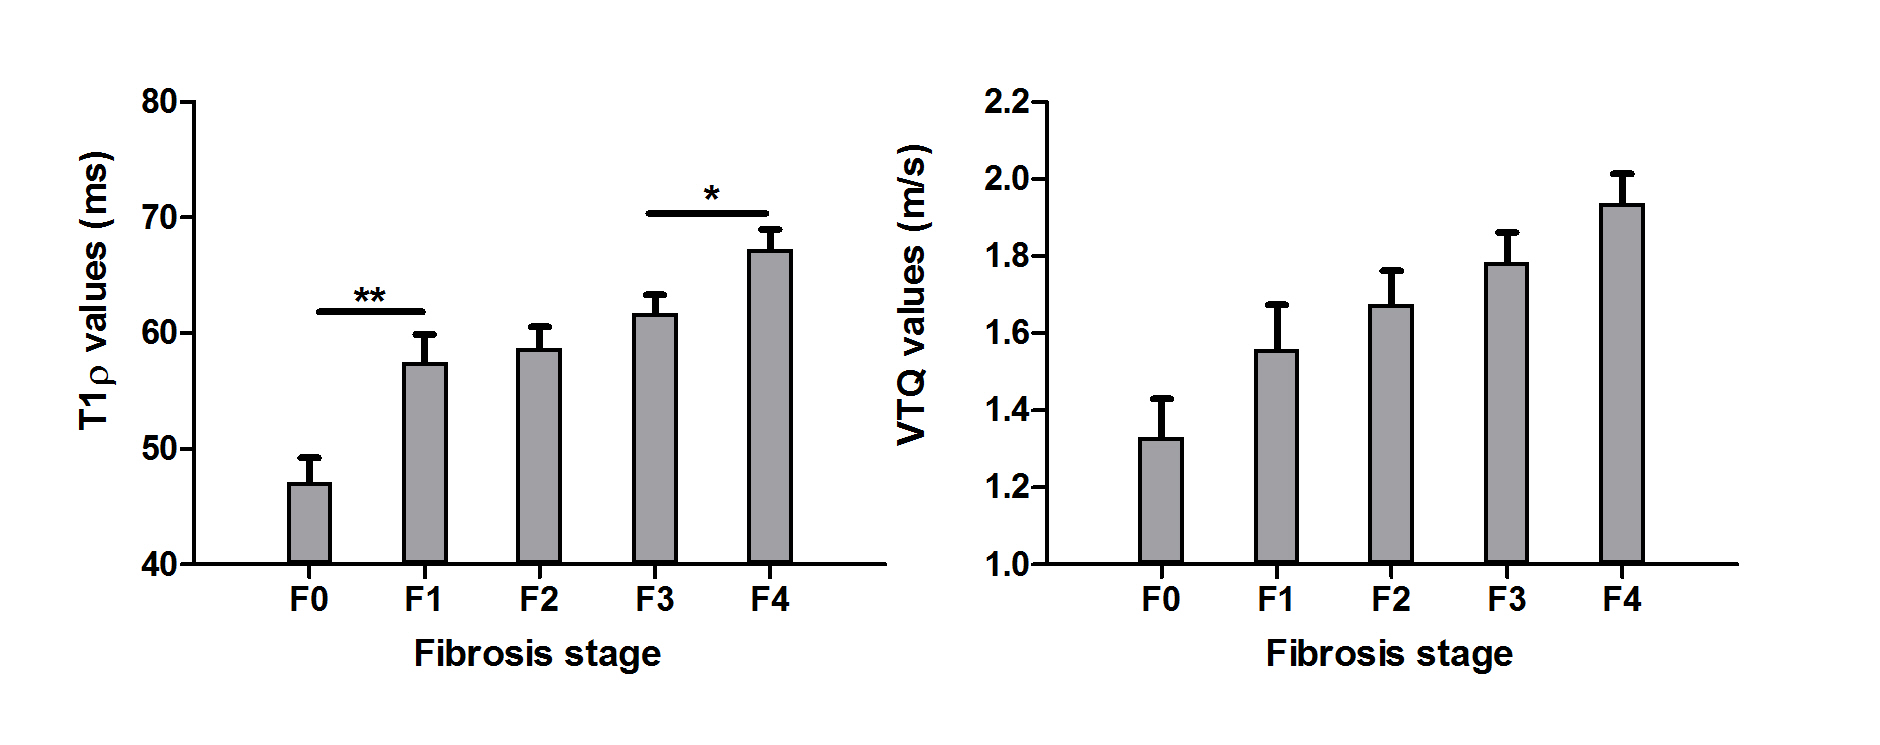
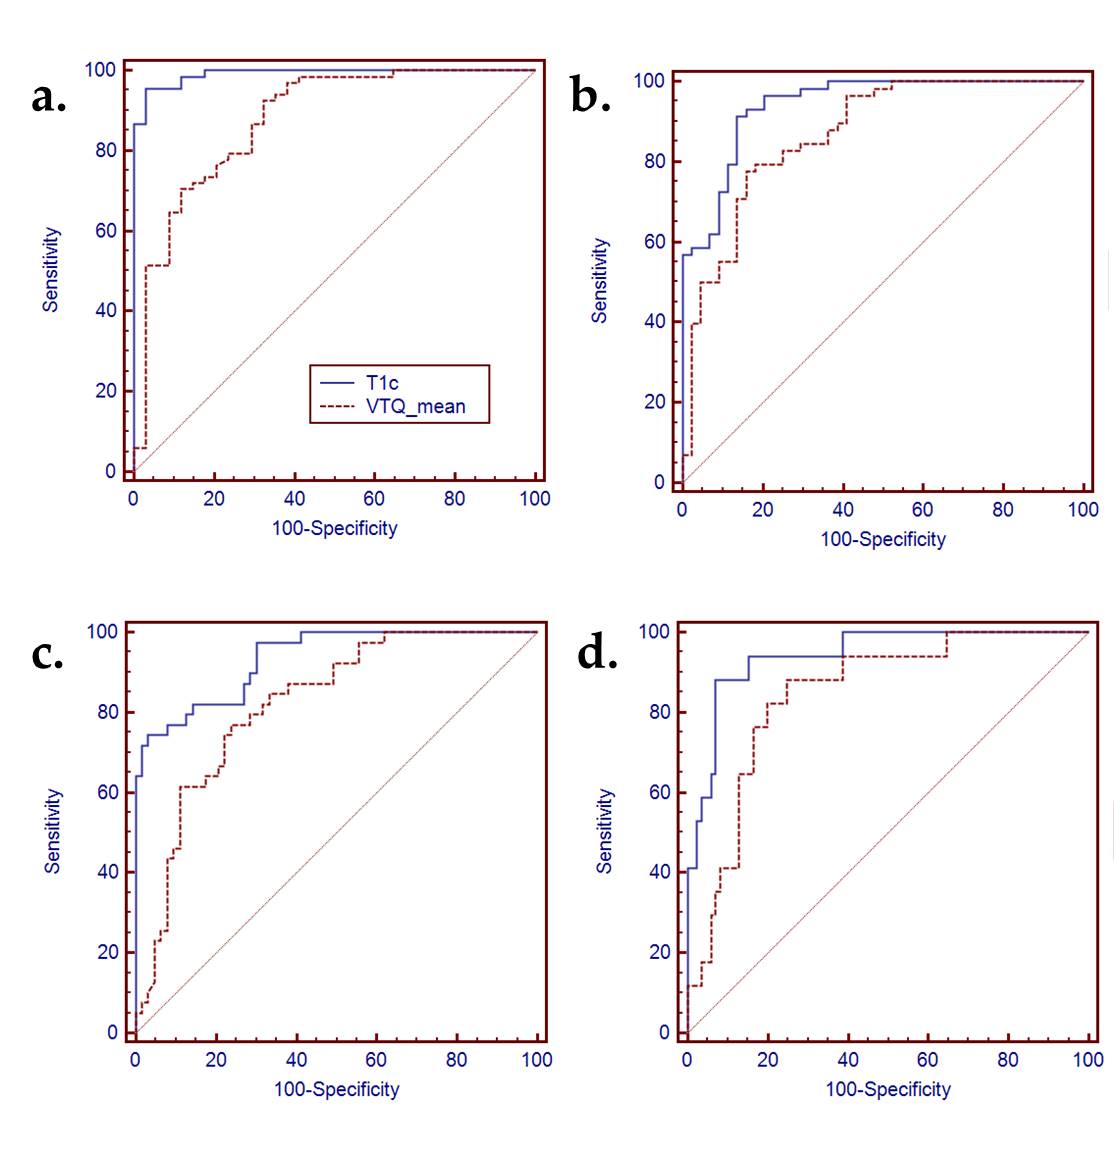
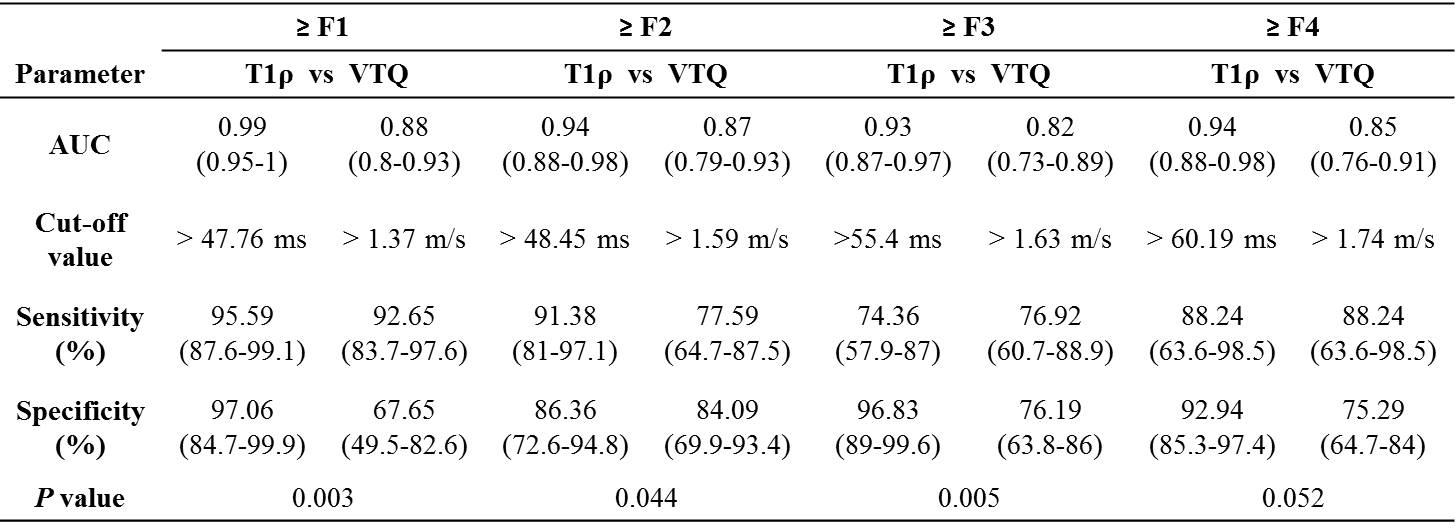
The intraclass correlation coefficient of T1ρ and ARFI was respectively 0.83 vs 0.79 and 0.8 vs 0.78 for assessing repeatability and reproducibility. Figure 1 showed the values of T1ρ and VTQ values at each stage of liver fibrosis. Both values increased with the progression of liver fibrosis from F0 to F4 (P < 0.001). Significant difference could be detected when fibrosis progressed from F0 to F1 (P < 0.001) and from F3 to F4 (P < 0.011). For ARFI imaging, the change of VTQ values between each two stages (F0 vs F1, F1 vs F2, F2 vs F3, F3 vs F4) showed no significance (P ≥ 0.352). ROC curves of T1ρ and ARFI imaging for differentiating fibrosis stage were shown in Figure 2. Table 1 summarized the mean AUC, cut-off values, and corresponding sensitivity and specificity of T1ρ and VTQ values for detecting each degree of fibrosis. The AUCs of T1ρ for evaluating fibrosis of F1-F3 tended to be significantly higher than those of VTQ (P ≤ 0.044), except for fibrosis of F4 (P = 0.052).Synopsis
The purpose of this study was to validate the repeatability, reproducibility, and diagnostic performance of MR T1ρ imaging for staging liver fibrosis, compared with ultrasound-based acoustic radiation force impulse (ARFI). The cross-sectional study was performed in rat models with carbon tetrachloride (CCl4). The results of histopathological analysis were used as reference standard. T1ρ imaging showed comparable repeatability and reproducibility with ARFI, however, manifested more accurate diagnostic performance for staging liver fibrosis, especially for detecting early stage of fibrosis.Discussion
Possessing a good repeatability and reproducibility is essential for a quantitative parameters used as a biomarker. Our results indicated that T1ρ had a good repeatability and reproducibility, similar to VTQ values. During the progression of liver fibrosis, T1ρ tended to increase more significantly than VTQ values, especially at the early stage of fibrosis. Correspondingly, T1ρ imaging manifested significantly better diagnostic performance for staging liver fibrosis, except for diagnosing liver cirrhosis. Ultrasound-based elastography techniques are portable, relatively inexpensive, and fast to acquire, but are inadequate for patients with obesity or ascites and also have sample errors.4 T1ρ imaging could evaluate the whole liver without preference of patients, and is an effective technique for evaluating liver fibrosis.Acknowledgements
No acknowledgement found.References
1. Rauscher I, Eiber M, Ganter C, et al. Evaluation of T1rho as a potential MR biomarker for liver cirrhosis: comparison of healthy control subjects and patients with liver cirrhosis. Eur J Radiol. 2014;83(6):900-904.
2. Talwalkar JA, Yin M, Fidler JL, Sanderson SO, Kamath PS, Ehman RL. Magnetic resonance imaging of hepatic fibrosis: emerging clinical applications. Hepatology. 2008;47(1):332-342.
3. Friedrich-Rust M, Nierhoff J, Lupsor M, et al. Performance of Acoustic Radiation Force Impulse imaging for the staging of liver fibrosis: a pooled meta-analysis. Journal of viral hepatitis. 2012;19(2):e212-219. 4. Petitclerc L, Sebastiani G, Gilbert G, Cloutier G, Tang A. Liver fibrosis: Review of current imaging and MRI quantification techniques. J Magn Reson Imaging. 2017;45(5):1276-1295.
Figures