2614
More than Hepatobiliary Relative Enhancement Ratio by Gd-EOB-DTPA for Liver Fibrosis Estimation, Hepatocyte Fraction method by T1 mapping measurement1Sheng Jing Hospital, Shenyang, China, 2Philips Healthcare, Beijing, China
Synopsis
We calculated the hepatocytefraction (Hep) and reduction rate of T1 relaxation time (RE) based on T1changes in the hepatocyte due to pharmacokinetics of gadoliniumethoxybenzyl-diethylenetriamine pentaacetic acid (Gd-EOB-DTPA) uptake in liver.Both Hep and RE were compared with liver fibrosis stage according to theMETAVIR scoring system. And we found that Hep significantly correlated withfibrosis stage, and indicate it a good quantitative biomarker for liver fibrosis estimation.
Purposes
Hepatic fibrosis is a diffusive pathological change, a response to most chronic liver diseases and ultimately develops into cirrhosis and hepatocellular cancer. Non-invasive methods for the assessment of hepatic fibrosis are getting more interest as better potential alternatives for liver biopsy. Herein we carried out T1 measurement for liver using a Look-Locker inversion recovery sequence with Gd-EOB-DTPA-enhanced [1] magnetic resonance imaging (MRI) to investigate its feasibility as a quantitative tool to estimate liver fibrosis, and compared it with reduction rate of T1 relaxation time (RE) [2].Materials and Methods
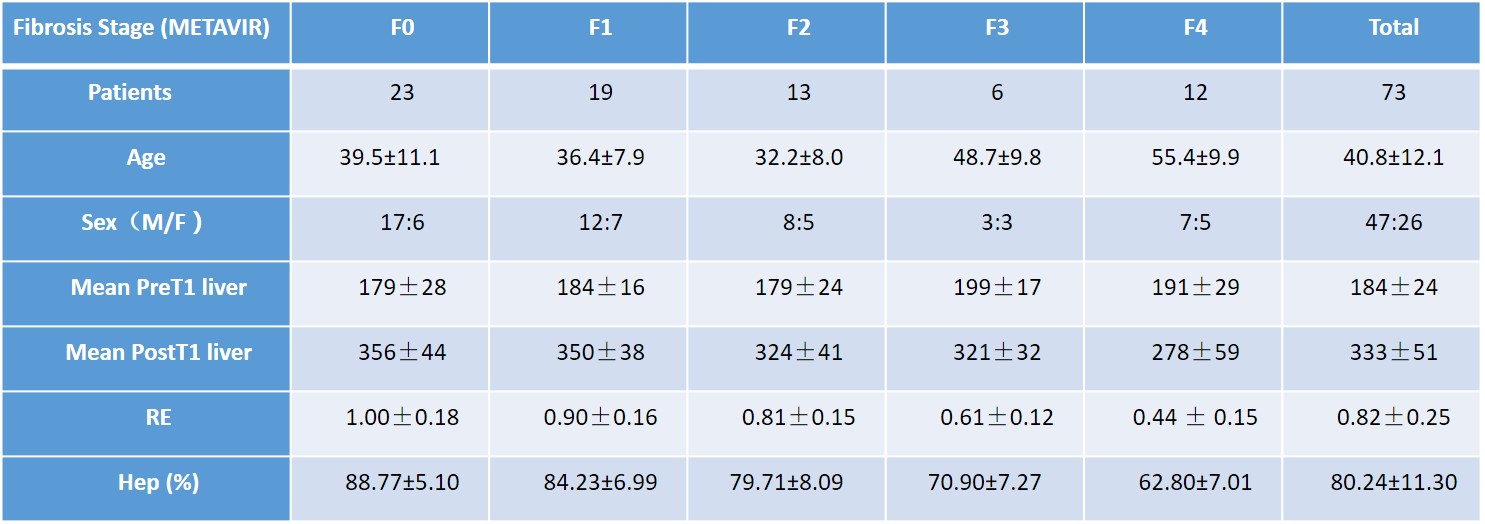
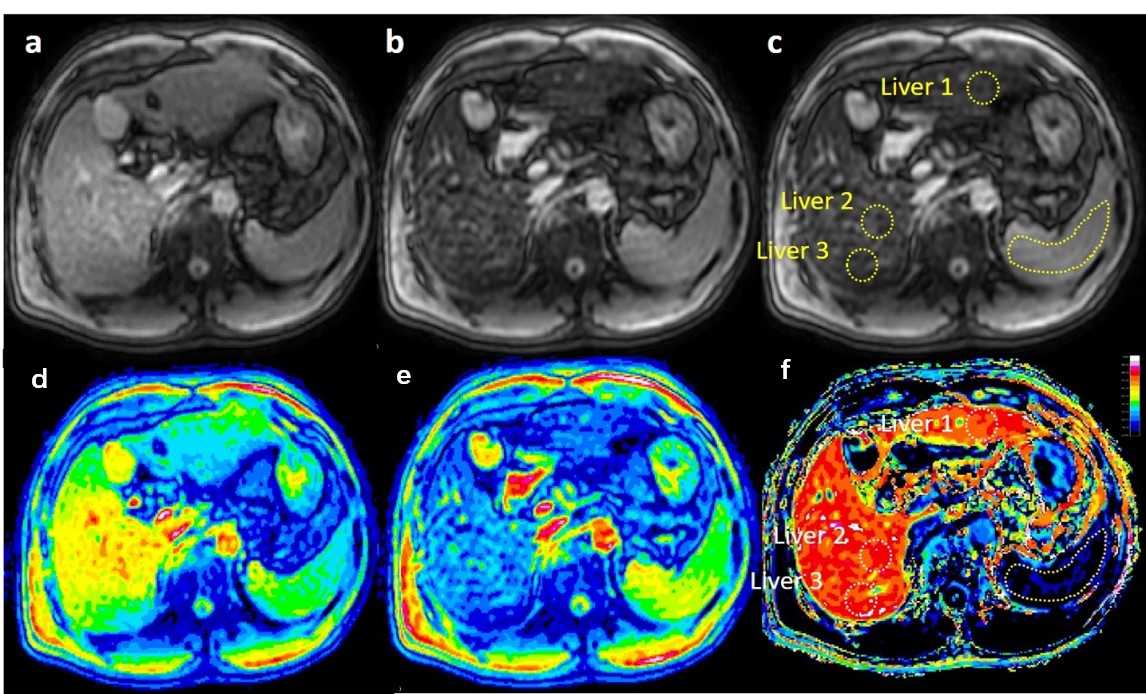
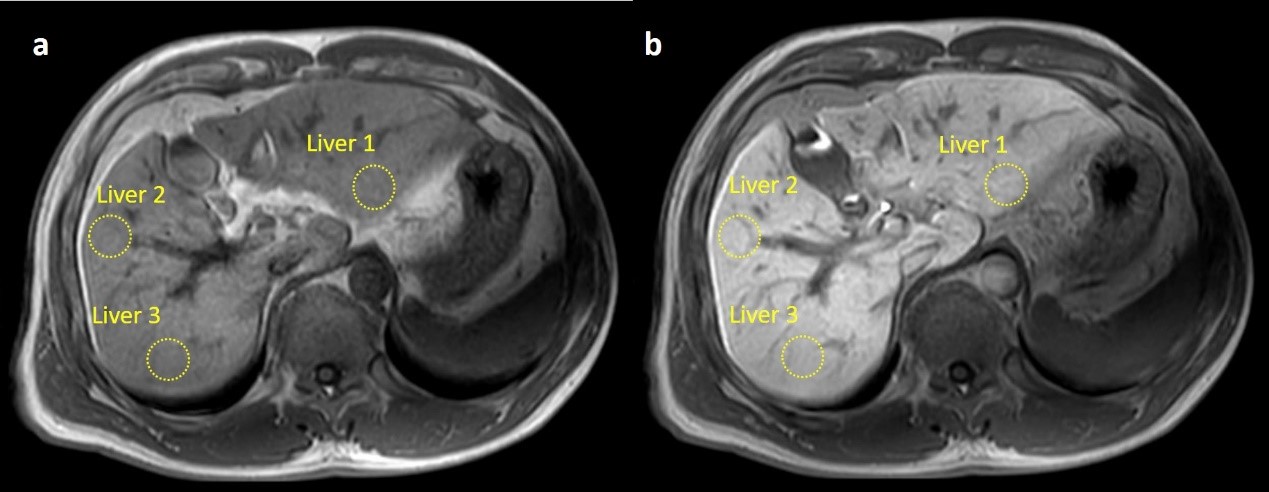
89 patients underwent a 3.0 Tesla MRI (Ingenia, Phillip Healthcare, Best, the Netherlands) examination, including T1-weighted and Look-Locker sequences for T1 mapping, both scanned twice before and after Gd-EOB-DTPA enhanced (post-T1-weighted scan was performed 18 min after Gd-EOB-DTPA, post-Look-Locker was done 20min after injection). Images at different delay time were acquired by Look-Locker sequence with the following protocol parameters: TE/TR=1.7/7 ms, 1.37×1.37×8 mm, FA=7, single-slice, shot interval=5 sec, SENSE factor=2, and scan time=20 sec with two breath holdings [3]. T1 mapping was calculated afterwards. 73 patients’ liver fibrosis pathology were collected within 48 hours after MRI examination. The fibrosis stage was evaluated semi-quantitatively according to the METAVIR scoring system [4]: F0 (n=23, 31.5 %); F1 (n=19, 26.0%); F2 (n=13, 17.8 %); F3 (n=6, 8.2 %). Hepatocyte Fractions (Hep) for liver were calculated based on T1 measurements based on landmark of spleen’s T1 change [2]. Relative Enhancement (RE) was calculated from signal intensity (SI) change on T1-weighted images, RE =((SI post-SI pre)/SI pre)×100 (%) [5].Results
Hepatocyte Fractions by EOB enhancement imaging were significantly correlated with fibrosis stage(r=﹣0.808, P<0.05). However, no correlation were established between Relative Enhancement (RE) among all groups (p > 0.05). Area under ROC curve (AUC) for diagnosis of any (≥F 1), significant (≥F 2), or advanced fibrosis (≥F 3), and cirrhosis by using Hep, were 0.84 (95% CI 0.75–0.93), 0.89 (95% CI 0.81–0.97), 0.96 (95% CI 0.91–1.00), and 0.96 (95% CI 0.91–1.00), respectively. It has higher diagnostic performance than RE, which indicates Hep a superior non-invasive liver fibrosis staging method.Conclusions
This study shows a strong correlation between hepatocyte fraction and liver fibrosis stage. In addition to the multi-dynamic Gd-EOB-DTPA-enhanced exams, the hepatocyte fraction imaging generates quantitative measurements in distinguishing different grades of liver fibrosis. This restudy shows that the T1 mapping based Hepatocyte fraction method is an efficient diagnostic tool for the staging of liver fibrosis.Discussion
The current results indicate that hepatocyte fraction a reliable tool for grading liver fibrosis. Look-Locker with Gd-EOB-DTPA-enhanced MRI has its advantages in accuracy. Moreover, no additional install special equipment (such as MRE) needed for clinical application. However, the method has its limitations due to fat influences Look-Locker T1 measurements in the liver [6], which also an important factor in Hep modeling. Furthermore, mismatches between post contrast images and pre contrast ones were observed due to motion and long gap between the scans. In order to improve the accessibility for future clinical use, further development for fast multi-slice or a 3D volume quantitative T1 mapping is needed with liver specific motion registration.Acknowledgements
No acknowledgement found.References
1. Hamm, B., et al., Phase I clinical evaluation of Gd-EOB-DTPA as a hepatobiliary MR contrast agent: safety, pharmacokinetics, and MR imaging. Radiology, 1995. 195(3): p. 785-92.
2.Kim, K.A., et al., Quantitative evaluation of liver cirrhosis using T1 relaxation time with 3 tesla MRI before and after oxygen inhalation. Journal of Magnetic Resonance Imaging, 2012. 36(2): p. 405-410.
3.Okuaki T, Morita K, Namimoto T, Yoshida M, Shiraishi S, Yamashita Y, et al. Assessment of the Hepatocyte Fraction for estimation of liver function /ISMRM 2015 abstract.
4.Bedossa, P. and T. Poynard, An algorithm for the grading of activity in chronic hepatitis C. The METAVIR Cooperative Study Group. Hepatology, 1996. 24(2): p. 289-93.
5. Verloh, N., et al., Liver fibrosis and Gd-EOB-DTPA-enhanced MRI: A histopathologic correlation. Sci Rep, 2015. 5: p. 15408.
6.Mozes, F.E., et al., Influence of fat on liver T1 measurements using modified Look-Locker inversion recovery (MOLLI) methods at 3T. J Magn Reson Imaging, 2016. 44(1): p. 105-11.
Figures
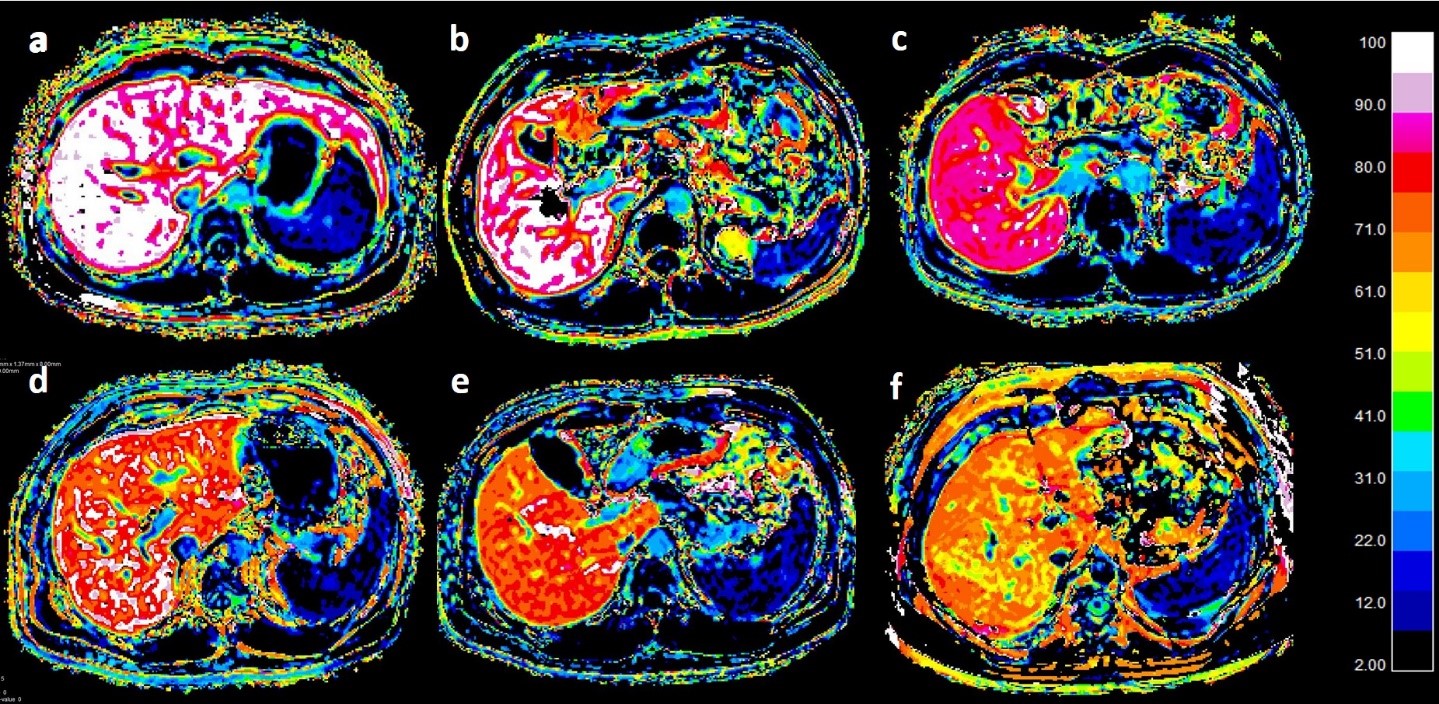
a. Hep image in a 19-year-old woman with METAVIR score F0. Hep-liver-average was 97.16%.
b. Hep image in a 29-year-old man with METAVIR score F1. Hep-liver-average was 89.21%.
c. Hep image in a 31-year-old woman with METAVIR score F2. Hep-liver-average was 79.92%.
d. Hep image in a 46-year-old man with METAVIR score F2. Hep-liver-average was 72.94%.
e. Hep image in a 46-year-old man with METAVIR score F3. Hep-liver-average was 69.17%.
f. Hep image in a 56-year-old man with METAVIR score F4. Hep-liver-average was 62.43%.