2613
The influence of glycogen on shortened modified Look-Locker inversion recovery (shMOLLI) T1 maps of the liver1University of Oxford Centre for Magnetic Resonance Research, University of Oxford, Oxford, United Kingdom, 2Translational Gastroenterology Unit, University of Oxford, Oxford, United Kingdom
Synopsis
Dynamic physiological changes in the liver may influence the increased variability of shMOLLI T1 of healthy livers relative to normal myocardial shMOLLI T1 variability. Since glycogen concentration varies over relatively short time periods, this may contribute to the variability. This study explores two possible pathways by which glycogen might influence shMOLLI measurements: chemical exchange saturation transfer (CEST) effects and direct change of liver water relaxation. Simulations, phantom and human experiments suggest that the CEST effect is negligible in vivo and a 7% shortening of T1 at high glycogen concentration is driven by direct relaxation effects.
Introduction
T1 mapping of the liver with the shMOLLI sequence1 has lately gained popularity and it has been shown to be capable of both characterising and predicting outcomes of liver disease2,3. However, the inter-subject standard deviation of shMOLLI T1 values of the liver of normal volunteers shows a higher variability4 (49 ms) than shMOLLI T1 values of the normal myocardium5 (25 ms). This higher variability might be explained in part by changes in liver glycogen concentration. The aim of the present study is to explore the influence of glycogen on liver T1s by chemical shift saturation exchange (CEST) effects6 and by direct influence on the relaxation of water7 at 3T.Methods
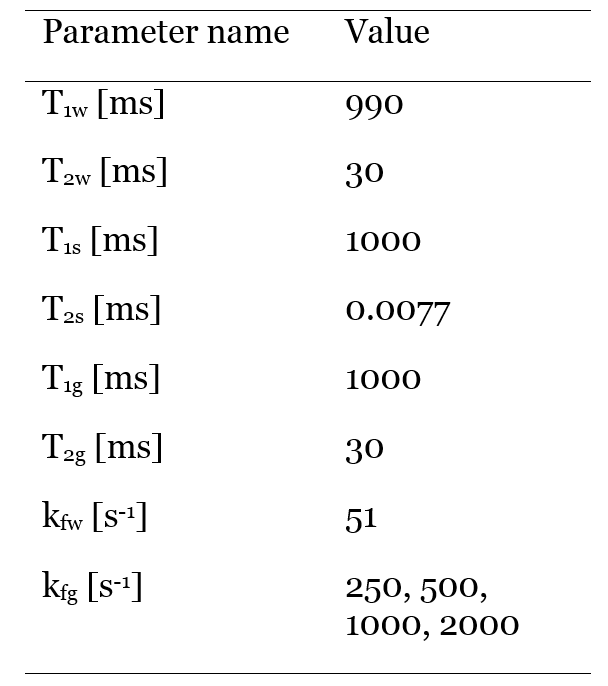
Simulations: Two Bloch-McConnell simulations of the shMOLLI sequence for a two-compartment liver model were performed in MATLAB (The MathWorks Inc., Natick, MA, USA)8. First, the unrestricted water pool and the semi-solid macromolecule pool were simulated with magnetization transfer (MT) in the absence of glycogen. Then glycogen was added to the unrestricted pool as a hydroxyl peak with a chemical shift relative to water of 1.2 ppm and MT was considered between the hydroxyl groups of the glycogen and the water molecules of the unrestricted pool6, in addition to the exchange between the two original liver pools. The concentration of glycogen was considered to be 450 mM. Simulations were performed for the range of off-resonance frequencies -200 Hz to 200 Hz in steps of 10 Hz for four exchange rates between glycogen and water6: kf1=250 s-1, kf2=500 s-1, kf3=1000 s-1 and kf4=2000 s-1. Simulation parameters are included in Table 1.
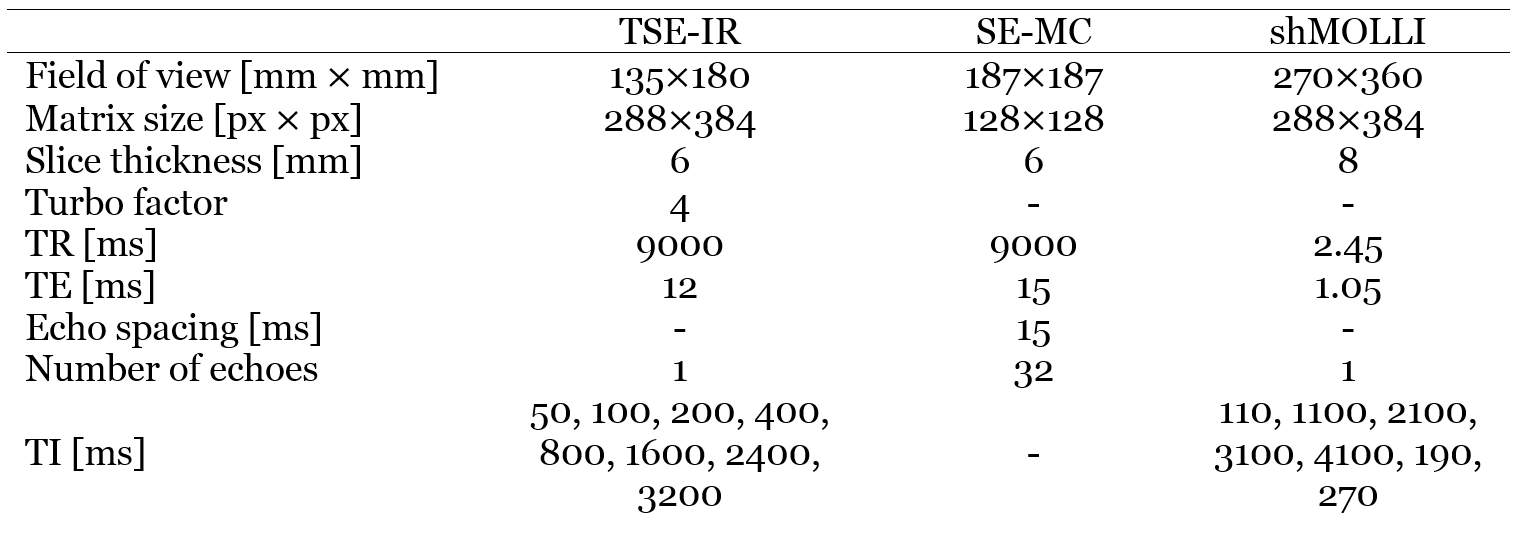
Phantoms: N=12 phantoms containing 25 ml deionised water and glycogen in concentrations of 0% to 11% in steps of 1% by mass were built and scanned on a Siemens Avanto 1.5T and a Siemens Prisma 3T (Siemens Medical Solutions, Erlangen, Germany) imager at 37°C. T1 of the phantoms was measured with turbo spin echo inversion recovery and T2 of the phantoms was measured with multiple contrast spin echo. Sequence parameters are shown in Table 2. Measured T1,2 values were fitted to the equation: $$$1/T_{1,2}=1/T_{1,20}+r_{1,2}g$$$, where g is the concentration of glycogen in percentage weight/volume, T1,20 are relaxation times in the absence of glycogen and r1,2 are relaxivities of glycogen.
Human participant: M=1 athletically active healthy volunteer was enrolled in a pilot study and was scanned 4 times in a fed state (after consuming a high-calorie meal) and 4 times in a fasted state (after a 12-hour overnight fast and 2 hours of physical exercise). This protocol was designed such that the participant had low liver glycogen concentration in the fasted state and high liver glycogen concentration in the fed state9. ShMOLLI T1 maps of the participant’s liver were collected on a Siemens Prisma 3 T scanner over a range of off-resonance frequencies between -150 Hz and 150 Hz in steps of 15 Hz. Sequence parameters are included in Table 2. ShMOLLI T1 values of the liver were also simulated using the model described by Tunnicliffe et al.10 in which we introduced a dependence of the intracellular water component on glycogen, using the relaxivities determined in phantoms.
Results
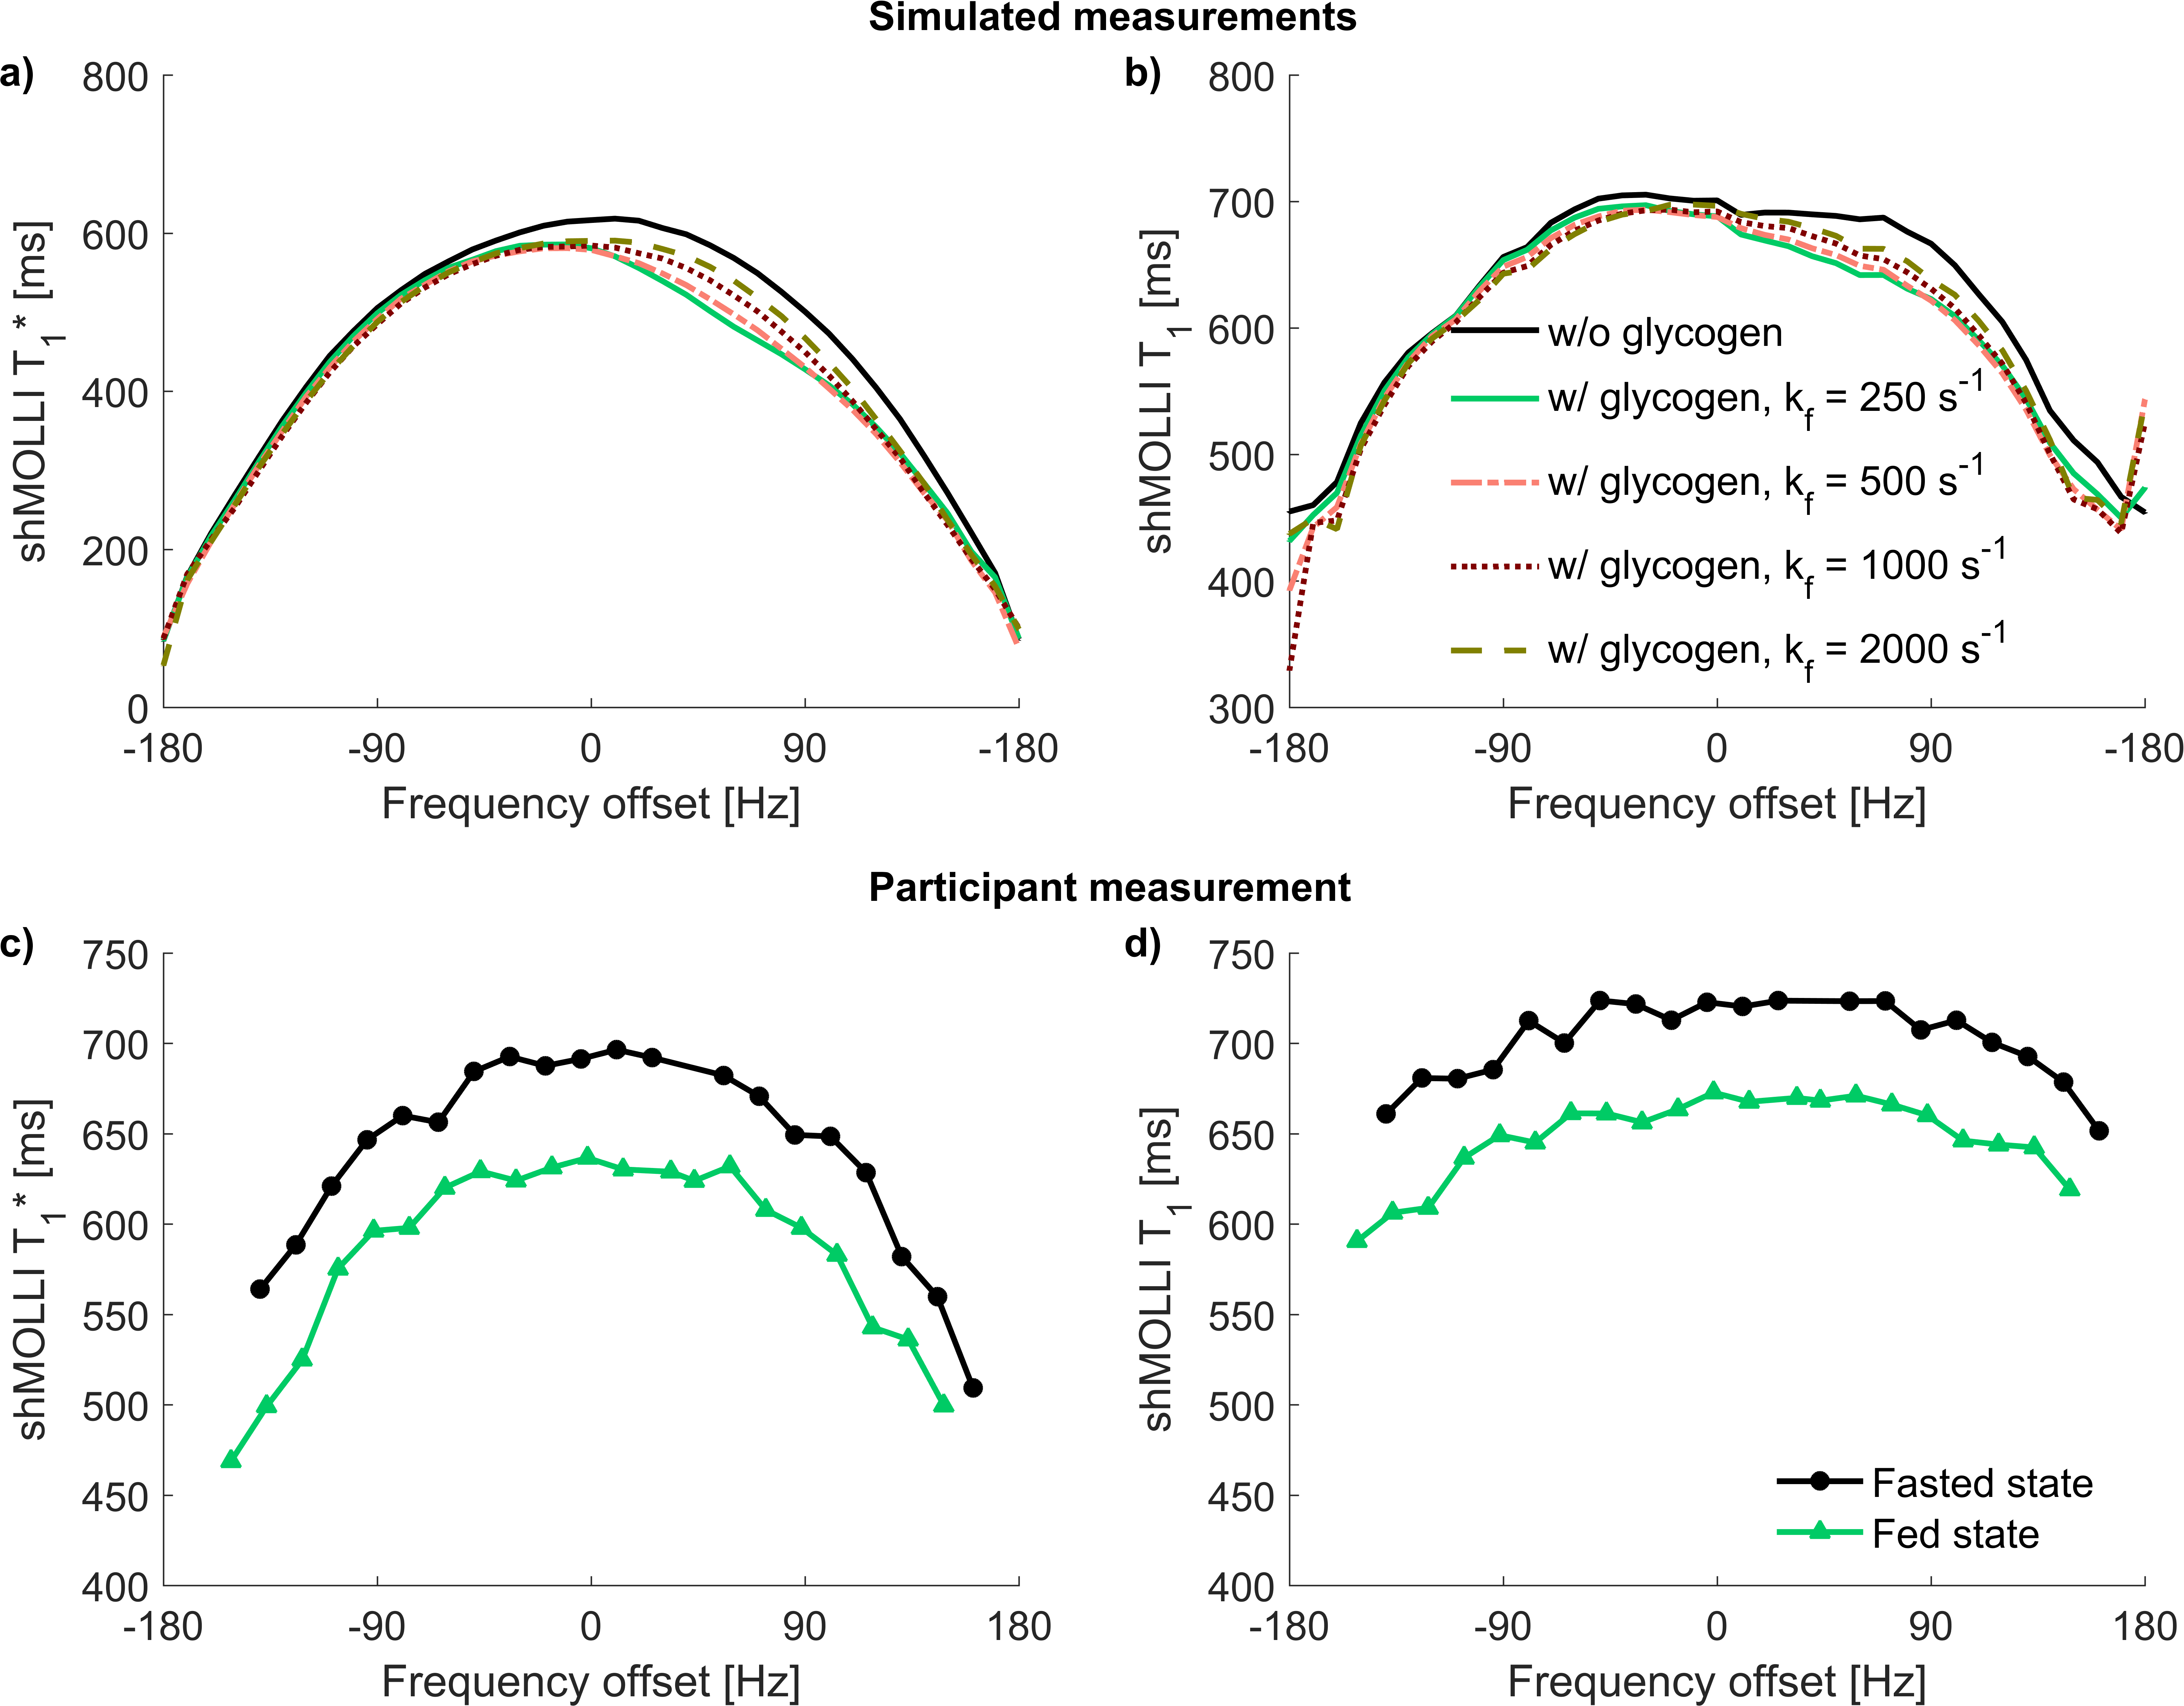
Simulations: The glycogen CEST effect causes an asymmetric dependence of shMOLLI T1* on frequency. The asymmetry diminishes with increasing exchange rates, as shown in figure 1a.
Phantoms: Relaxivities of glycogen were r1=0.0245±0.020 s-1%-1, r2=0.3223±0.0265 s-1%-1 at 1.5T and r1=0.0175±0.0013 s-1%-1, r2=0.5446±0.0514 s-1%-1 at 3 T.
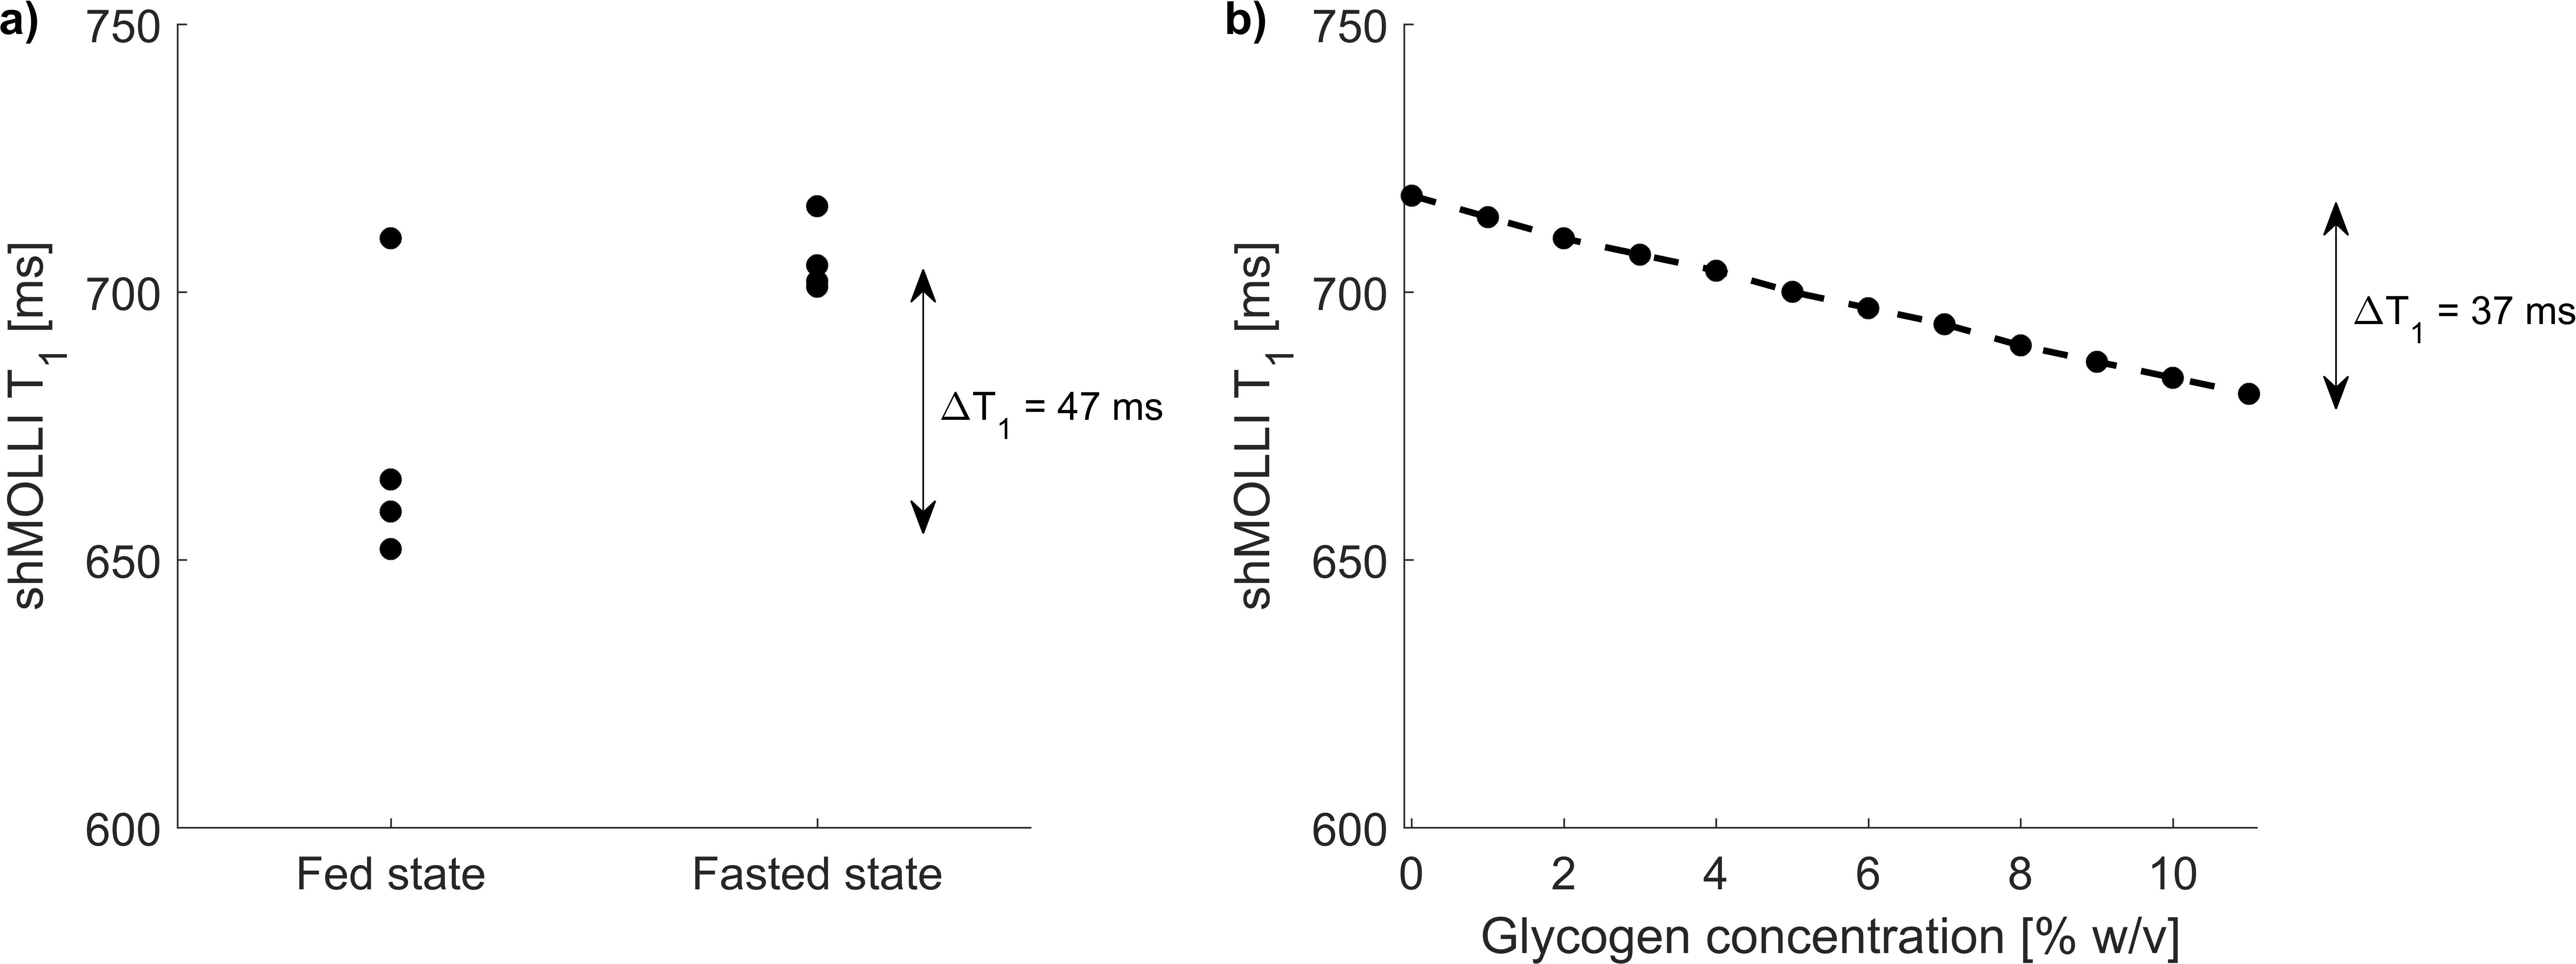
The human study did not show asymmetric behaviour of shMOLLI T1* (figure 1c), suggesting a reasonably high exchange rate between glycogen hydroxyl groups and unrestricted water in agreement with literature11. T1 values were generally lower in the fed state than in the fasted state (figure 2a), with an average difference of 34.5 ms. Simulations also showed a shortening of T1, but to a lesser extent than the experimental data, perhaps due to a different relaxivity of glycogen in vivo.
Discussion
Glycogen depletion elevates T1 in the liver by up to 50 ms which appears to be a direct relaxation effect of glycogen. The glycoCEST effect was found to be small at 3 T with the shMOLLI sequence. Longitudinal relaxivity values of glycogen were found to be decreasing with increasing field strength and transverse relaxivity values were increasing with increasing field strength when compared to literature values7.Conclusion
We have shown that the presence of glycogen leads to a shortening of shMOLLI T1 in the human liver. Study protocols should take this into account to improve the reproducibility of liver shMOLLI measurements.Acknowledgements
This work was supported by a UK MRC DTA (MR/K501256/1), a Scatcherd European Scholarship, the RDM Scholars Programme and the NIHR Biomedical Research Centre, Oxford.References
1. Piechnik SK, Ferreira VM, Dall’Armellina E, et al. Shortened Modified Look-Locker Inversion recovery (ShMOLLI) for clinical myocardial T1-mapping at 1.5 and 3 T within a 9 heartbeat breathhold. J. Cardiovasc. Magn. Reson. 2010;12(1):69.
2. Banerjee R, Pavlides M, Tunnicliffe EM, et al. Multiparametric magnetic resonance for the non-invasive diagnosis of liver disease. J. Hepatol. 2014;60(1):69-77.
3. Pavlides M, Banerjee R, Sellwood J, et al. Multiparametric magnetic resonance imaging predicts clinical outcomes in patients with chronic liver disease. J. Hepatol. 2016;64(2):308-315.
4. Pavlides M, Banerjee R, Tunnicliffe EM, et al. Multi-parametric magnetic resonance imaging for the assessment of non-alcoholic fatty liver disease severity. Liver Int. 2017;37(7):1065-1073.
5. Piechnik SK, Ferreira VM, Lewandowski AJ, et al. Normal variation of magnetic resonance T1 relaxation times in the human population at 1.5 T using ShMOLLI. J. Cardiovasc. Magn. Reson. 2013;15(1):13.
6. van Zijl PCM, Jones CK, Ren J, Malloy CR, Sherry AD. MRI detection of glycogen in vivo by using chemical exchange saturation transfer imaging (glycoCEST). Proc. Natl. Acad. Sci. U.S.A. 2007;104(11):4359-4364.
7. Gore JC, Brown MS, Mizumoto CT, Armitage IM. Influence of glycogen on water proton relaxation times. Magn. Reson. Med. 1986;3(3):463-466.
8. Robson MD, Piechnik SK, Tunnicliffe EM, Neubauer S. T1 measurements in the human myocardium: The effects of magnetization transfer on the SASHA and MOLLI sequences. Magn. Reson. Med. 2013;670:664-670.
9. Rothman D, Magnusson I, Katz L, Shulman R, Shulman G. Quantitation of hepatic glycogenolysis and gluconeogenesis in fasting humans with 13C NMR. Science (80-). 1991;254(5031):573-576.
10. Tunnicliffe EM, Banerjee R, Pavlides M, Neubauer S, Robson MD. A model for hepatic fibrosis: the competing effects of cell loss and iron on shortened modified Look-Locker inversion recovery T1 (shMOLLI-T1) in the liver. J. Magn. Reson. Imaging 2017;45(2):450-462.
11. Liepinsh E, Otting G. Proton exchange rates from amino acid side chains— implications for image contrast. Magn. Reson. Med. 1996;35(1):30-42.
Figures