2612
Bi-exponential T1rho Relaxation of In Vivo Human Liver1Department of Imaging and Interventional Radiology, The Chinese University of Hong Kong, Shatin, Hong Kong, 2Department of Medicine & Therapeutics, The Chinese University of Hong Kong, Shatin, Hong Kong, 3Philips Healthcare, Hong Kong, China, Shatin, Hong Kong
Synopsis
Quantitative T1rho imaging is reported a promising non-invasive diagnostic tool for detection of liver fibrosis at its early stage. T1rho relaxation is often estimated by a mono-exponential relaxation model. However, bi-exponential relaxation may occur due to compartmentation of the liver tissue. Bi-exponential T1rho relaxation has been reported in rat muscle and human knee cartilage. In this work, we provided our observation and analysis of bi-exponential T1rho relaxation of in vivo human liver.
Introduction
T1rho imaging is a promising non-invasive technology for diagnosis of early-stage liver fibrosis. T1rho characterize the spin relaxation constant along the effective spin-lock field at the presence of spin-lock radiofrequency (RF) pulse. T1rho relaxation is typically described by a mono-exponential model. However, per Zimmerman-Brittin relaxation model1, bi-exponential or multi-exponential relaxation may occur due to compartmentation of tissue. Bi-exponential T1rho relaxation has been reported in rat muscle2 and human knee cartilage3. In this work, we report our observation and analysis of bi-exponential T1rho relaxation of in vivo human liver.Methods
Data sets were acquired from a Philips Achieva 3.0TX system equipped with a dual transmitter. Liver MRI scan of 15 subjects was conducted under the approval of the Institutional Review. A 32-channel cardiac coil was used as the receiver. A 2D T1rho-prepared single shot fast spin echo sequence was used for data acquisition. The acquisition parameters include: resolution 2mm x 2mm, slice thickness 6mm, TR/TE 2000/5.9ms, spin-lock frequency 500Hz, and 16 time-of-spinlock (TSL) [0 2 5 8 12 16 20 24 28 32 35 40 42 48 52 60]ms. Respiratory triggering was used for motion compensation with a standard respiratory belt to obtain the respiratory signal.
The data sets were fitted to a mono-exponential model I=I0exp(-TSL/T1ρm), and a bi-exponential model I=I0·{α·exp(-TSL/T1ρL)+(1-α)·exp(-TSL/T1ρS)}, respectively, where T1ρm is the T1rho value from the mono-exponential model; T1ρL and T1ρS characterize the long and the short component of the bi-exponential model, respectively; and α is the fraction of the long T1rho component. F-test was performed to compare the two relaxation models. The F-ratio is given as F = [(SSE1 - SSE2)/(N2-N1)]/[(SSE2/DFE2)], where SSE is the summed square of residuals, and N is the number of variables of the model, and DFE is the degrees of freedom.
Results
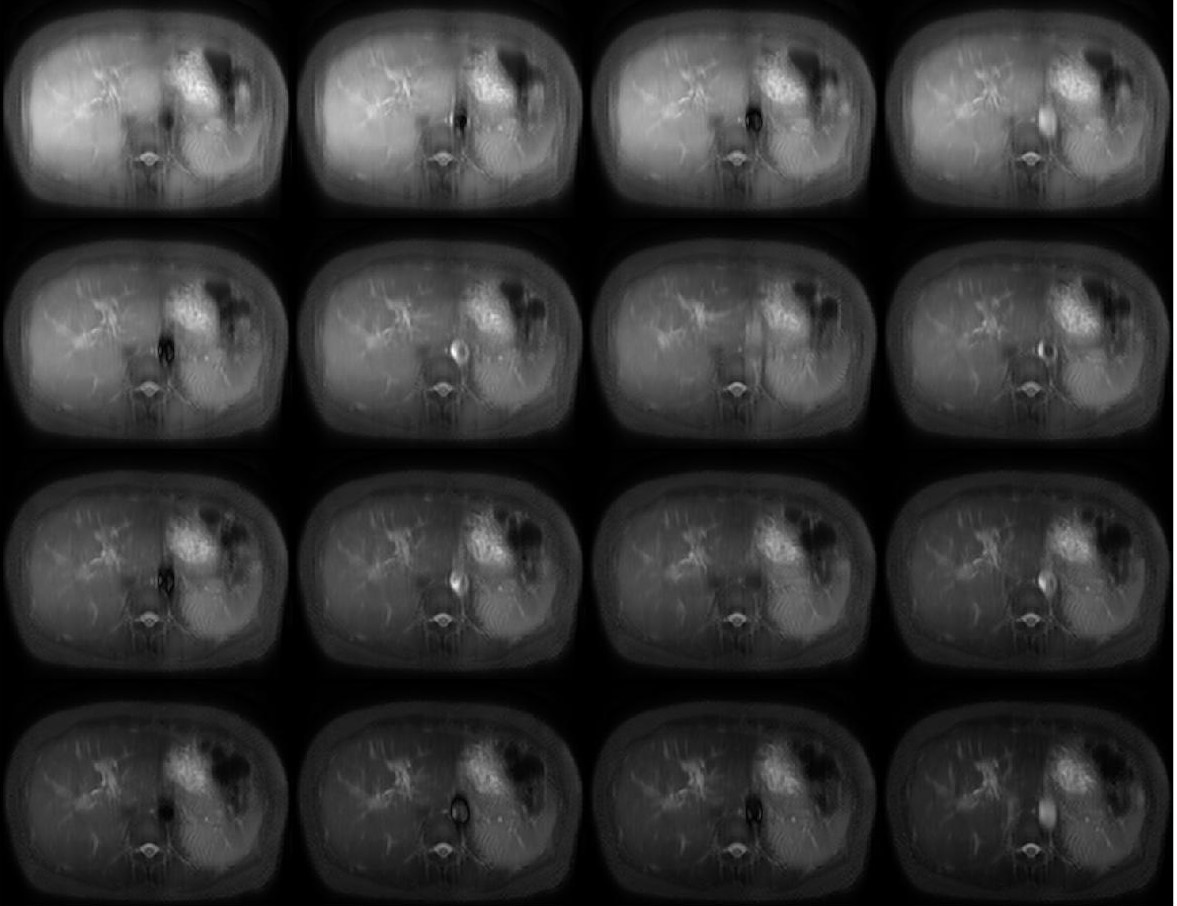
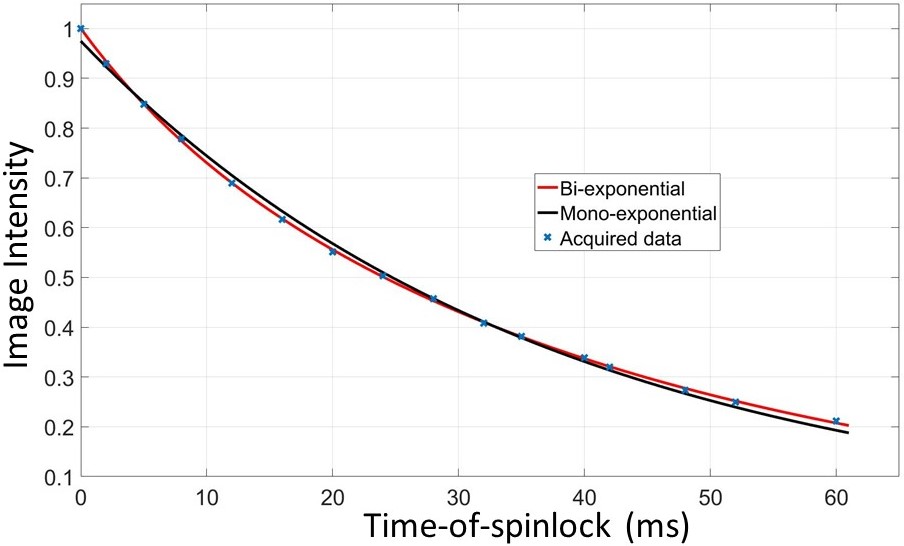
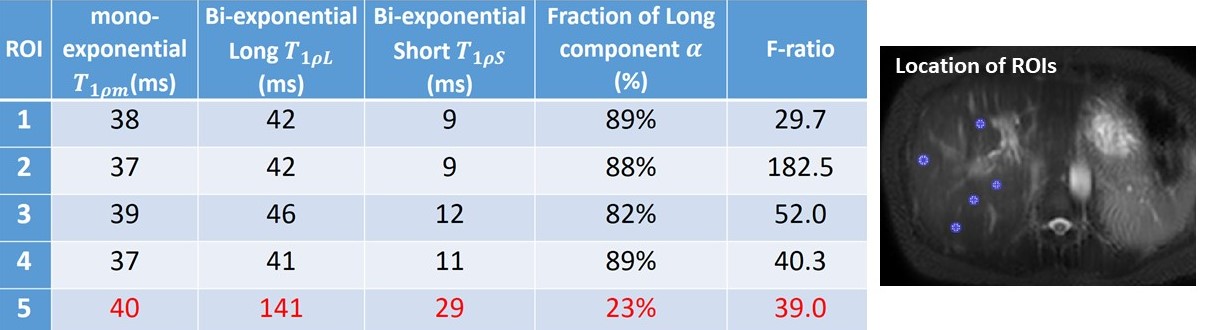
For all 15 subjects, the bi-exponential model shows improved fitting of the acquired data compared to the mono-exponential model. Figure 1 shows typical T1rho-prepared images with different TSL. Figure 2 is a typical fitting result using two relaxation models. Note the acquired data deviates from the mono-exponential model, but follows bi-exponential model quite well. Figure 3 shows the quantification results at five ROIs. F-test produced F-ratios ranging from 29.7 to 182.5 with P value smaller than 0.0002, indicating a significantly improved fitting using the bi-exponential model.
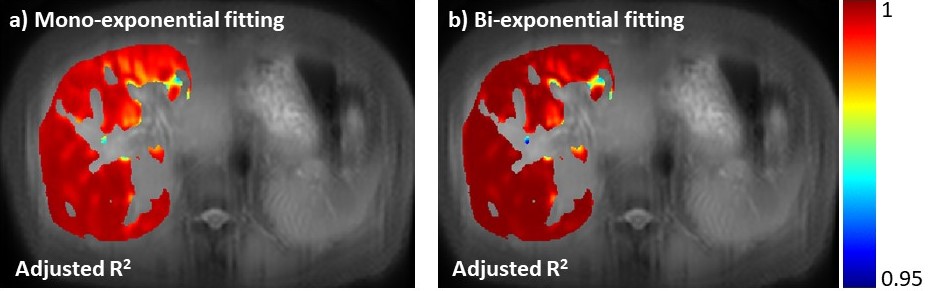
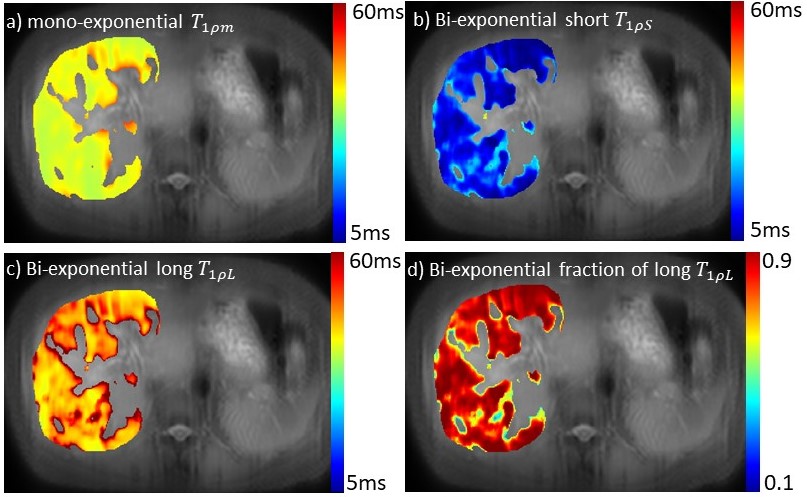
Note there are regions (the 5th ROI in the table shown in Figure 3) which bi-exponential fitting resulted in a large T1rho of the long T1rho component. One possible cause of this effect is the blood flow variation during acquisition of T1rho-prepared images at different TSLs. At regions there is no obvious blood signal, the mean of the short and the long T1rho component is approximately 10ms and 43ms, respectively, with the mean of the fraction of the long T1rho component 87%. To mitigate the potential signal contamination from blood, we added an exclusion criterion to exclude pixels with estimated long T1ρL larger than 75ms. The results were shown in Figure 4 and 5. Figure 4 was the adjusted R-square map. We used adjusted R-square rather than R-square to reflect the different number of unknowns in two models. Note bi-exponential fitting resulted in improved adjusted R-square. Figure 5 was the map of T1rho and the fraction (α) of the long T1rho component.
Discussion
Yuan et al2 reported bi-exponential T1rho relaxation in rat muscle. The mono, short and long T1rho values were reported as approximately 30 to 33, 9 to 11 and 37 to 41 ms, respectively. The fraction of the long T1rho component was approximately 80 to 88%. In a recent cartilage study, a bi-exponential T1rho relaxation was reported with the short and long T1rho 6.9 and 51.0 ms, respectively, and the fraction of the long T1rho component 62.4%3. The short component in cartilage may be related to water tightly bound to proteoglycans and collagen, whereas the long component corresponds to water loosely bound to these macromolecules3.
One possible cause to the bi-exponential T1rho relaxation in the liver may be the different relaxation of intra- and extra-cellular water. It is conjectured that the biological cause of the bi-exponential T1rho relaxation in liver and muscle is similar considering the agreement of their measurements. However, further investigation is needed to understand factors contributing to relaxation effect in these tissues and its potential clinical applications.
Conclusion
Bi-exponential T1rho relaxation is observed in the human liver. The measured long and short T1rho component, and their fractions are consistent with what was reported in muscle, which suggests the bi-exponential T1rho relaxation in the liver and muscle may share similar biological causes.
Acknowledgements
This study is supported by the grant from the Research Grants Council of the Hong Kong SAR (Project No. SEG CUHK02).References
1. Zimmerman JR, Brittin WE. Nuclear magnetic resonance studies in multiple phase systems: lifetime of a water molecule in an adsorbing phase on silica gel. The Journal of Physical Chemistry. 1957 Oct;61(10):1328-33.
2.Yuan J, Zhao F, Chan Q, Wang YX. Observation of bi-exponential T1ρ relaxation of in-vivo rat muscles at 3T. Acta Radiologica. 2012 Jul;53(6):675-81.
3. Alghamdi S, Sinclair B, Cowin G, Brereton I, Tesiram YA. Magnetic resonance spin–spin relaxation time estimation in a rat model of fatty liver disease. Journal of Magnetic Resonance Imaging. 2017 Jun 22.
Figures