2611
Early Stage Chronic Liver Disease: T1 Relaxation and Hepatic Fibrosis1Department of Radiation Physics, and Department of Medical and Health Sciences and Center for Medical Image Science and Visualization (CMIV), Linköping Univeristy, Linköping, Sweden, 2Department of Biomedical Engineering and Center For Medical Image Science and Visualization (CMIV), Linköping University, Linköping, Sweden, 3Amra AB, Linköping, Sweden, 4Department of Radiology, and Department of Medical and Health Sciences, Linköping University, Norrköping, Sweden, 5Department of Medical and Health Sciences and Center for Medical Image Science and Visualization (CMIV), Linköping University, Linköping, Sweden, 6Center for Medical Image Science and Visualization (CMIV), Linköping University, Linköping, Sweden, 7Department of Medical and Health Sciences and Center for Medical Image Science and Visualization (CMIV), Linköping Univeristy, Linköping, Sweden, 8Department of Medical and Health Sciences and Department of Gasteroenterology and Hepatology, Linköping University, Linköping, Sweden
Synopsis
We measured T1 relaxation times in a prospectively recruited cohort of patients with suspected chronic liver disease. Our aim was to investigate the predictive value of T1 for staging hepatic fibrosis. Furthermore, we sought to test if T1 values are confounded by inflammation or presence of iron. We found that T1 was confounded by iron and that T1 alone had a poor ability to stage hepatic fibrosis.
Introduction
Chronic liver disease (CLD) is a large and growing problem. Regardless of etiology, CLD can lead to the development of hepatic fibrosis and cirrhosis. Liver biopsy, the current gold standard for staging fibrosis, is an invasive procedure that also suffers from sampling, intra-reader, as well as inter-reader variability.
T1-relaxometry has been suggested as a non-invasive alternative to invasive biopsies1-3. There are several different factors that potentially may confound the T1 values, such as fat, iron and inflammation.
The purpose of
this work was to investigate if T1‑relaxometry can be used to stage hepatic
fibrosis in a cohort of early stage CLD. Furthermore, we aimed to use a
methodology that is insensitive to fat, as well as investigate if the T1‑measurements
were confounded by iron or inflammation.
Methods
87 patients with suspected CLD, of different etiologies, were referred to our hepatology department due to chronically (>6 months) elevated serum levels of alanine aminotransferase, and/or aspartate aminotransferase, and/or alkaline phosphatase, and scheduled for liver biopsy, were prospectively included prospectively. All patients underwent an MRI examination (Philips Achieva 1.5 T) prior to obtaining two liver biopsies, on the same occasion.
The first biopsy underwent histopathological staging of fibrosis according to Batts and Ludwig. Inflammation was also graded as none/mild or advanced. A second biopsy was obtained from 76 of the patients, and the biopsy was analyzed for liver iron content (LIC) by inductively coupled plasma sector field mass spectrometry.
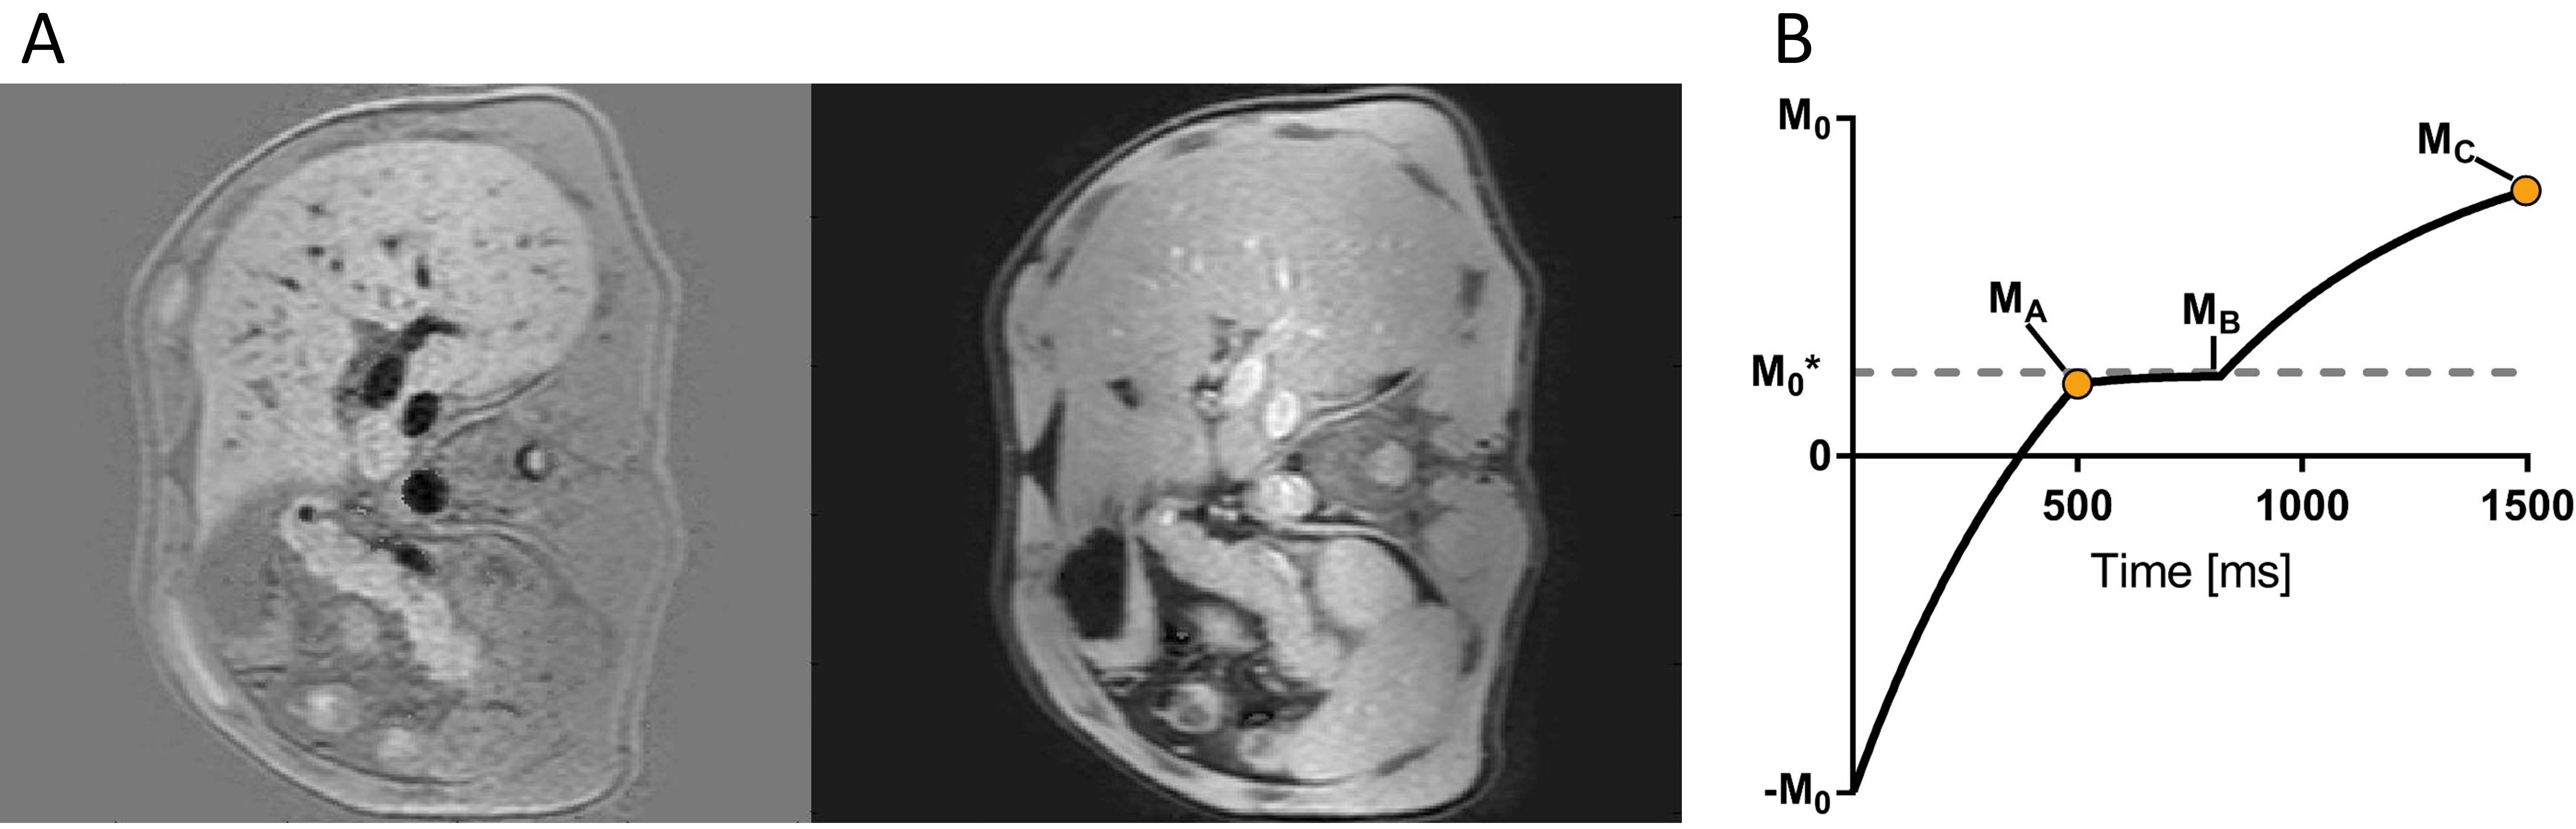
T1 relaxation of the liver was estimated using a phase sensitive inversion recovery sequence4 with a Turbo Field Echo acquisition (TR=6.6 ms, FA=16°, TE=2.3/4.6 ms). The first acquisition was performed at an inversion time of 500 ms and the second acquisition was performed 1000 ms later. To reduce any confounding effect of fat in the T1 measurement, both in-phase (ip) and opposite-phase images (op) were acquired at each acquisition. Water images (w) and fat images (f) were reconstructed from the in-phase and opposite-phase images using phase sensitive reconstruction5 (PSR), after removing the ip phase from the op image:
$$w_{TI0},f_{TI0}=PSR(ip_{TI0},op_{TI0}*e^{-angle(ip_{TI0} )} )$$
$$w ̂_{TI500},f ̂_{TI500}=PSR(ip_{TI500},op_{TI500}*e^{-angle(ip_{TI500})})$$
For the inversion recovery images the T1-induced sign of the water signal was retrieved using the sign of the phase corrected ipTI500:
$$w_{TI500}=w ̂_{TI500}*sign(ip_{TI500}*e^{-angle(ip_{TI0})})$$
Five 2D-slices (one slice per breath hold) were acquired. Examples of the images can be found in Fig 1A. A region of interest was drawn in the first water image, avoiding large vessels and transferred to the second water image. The mean signal intensities were used to calculate T1.
The recovery of the longitudinal magnetization was simulated (Fig 1B). Since a single-shot acquisition was used for each image and the magnetization had time to recover between the slices, the recovery was assumed to start at –M0. In addition, a low-high k-space profile order ensured that the image intensity reflected the magnetization at the start of the acquisition.
From the inversion to the start of the first acquisition, the magnetization recovers from –M0 to MA:
$$M_A=M_0*(1-2*e^{-500⁄T1})$$
During the acquisition, for a time of Tacq=317 ms, the magnetization recovers towards MB with an apparent T1*‑relaxation time towards a saturated magnetization M0*:
$$M_B=M_0^*-(M_0^*-M_A )*e^{-T_{acq}⁄T1^*}$$
$$M_0^*/M_0 =T1^*/T1=TR/(TR-ln(cosFA ) )$$
Between the acquisitions, the magnetization again recovers towards M0 with T1:
$$M_C=M_0-(M_0-M_B )*e^{-(1000-T_{acq})⁄T1}$$
M0 and T1 were determined by fitting the simulated magnetizations MA and MC to the measured intensities using least squares fitting.
Results
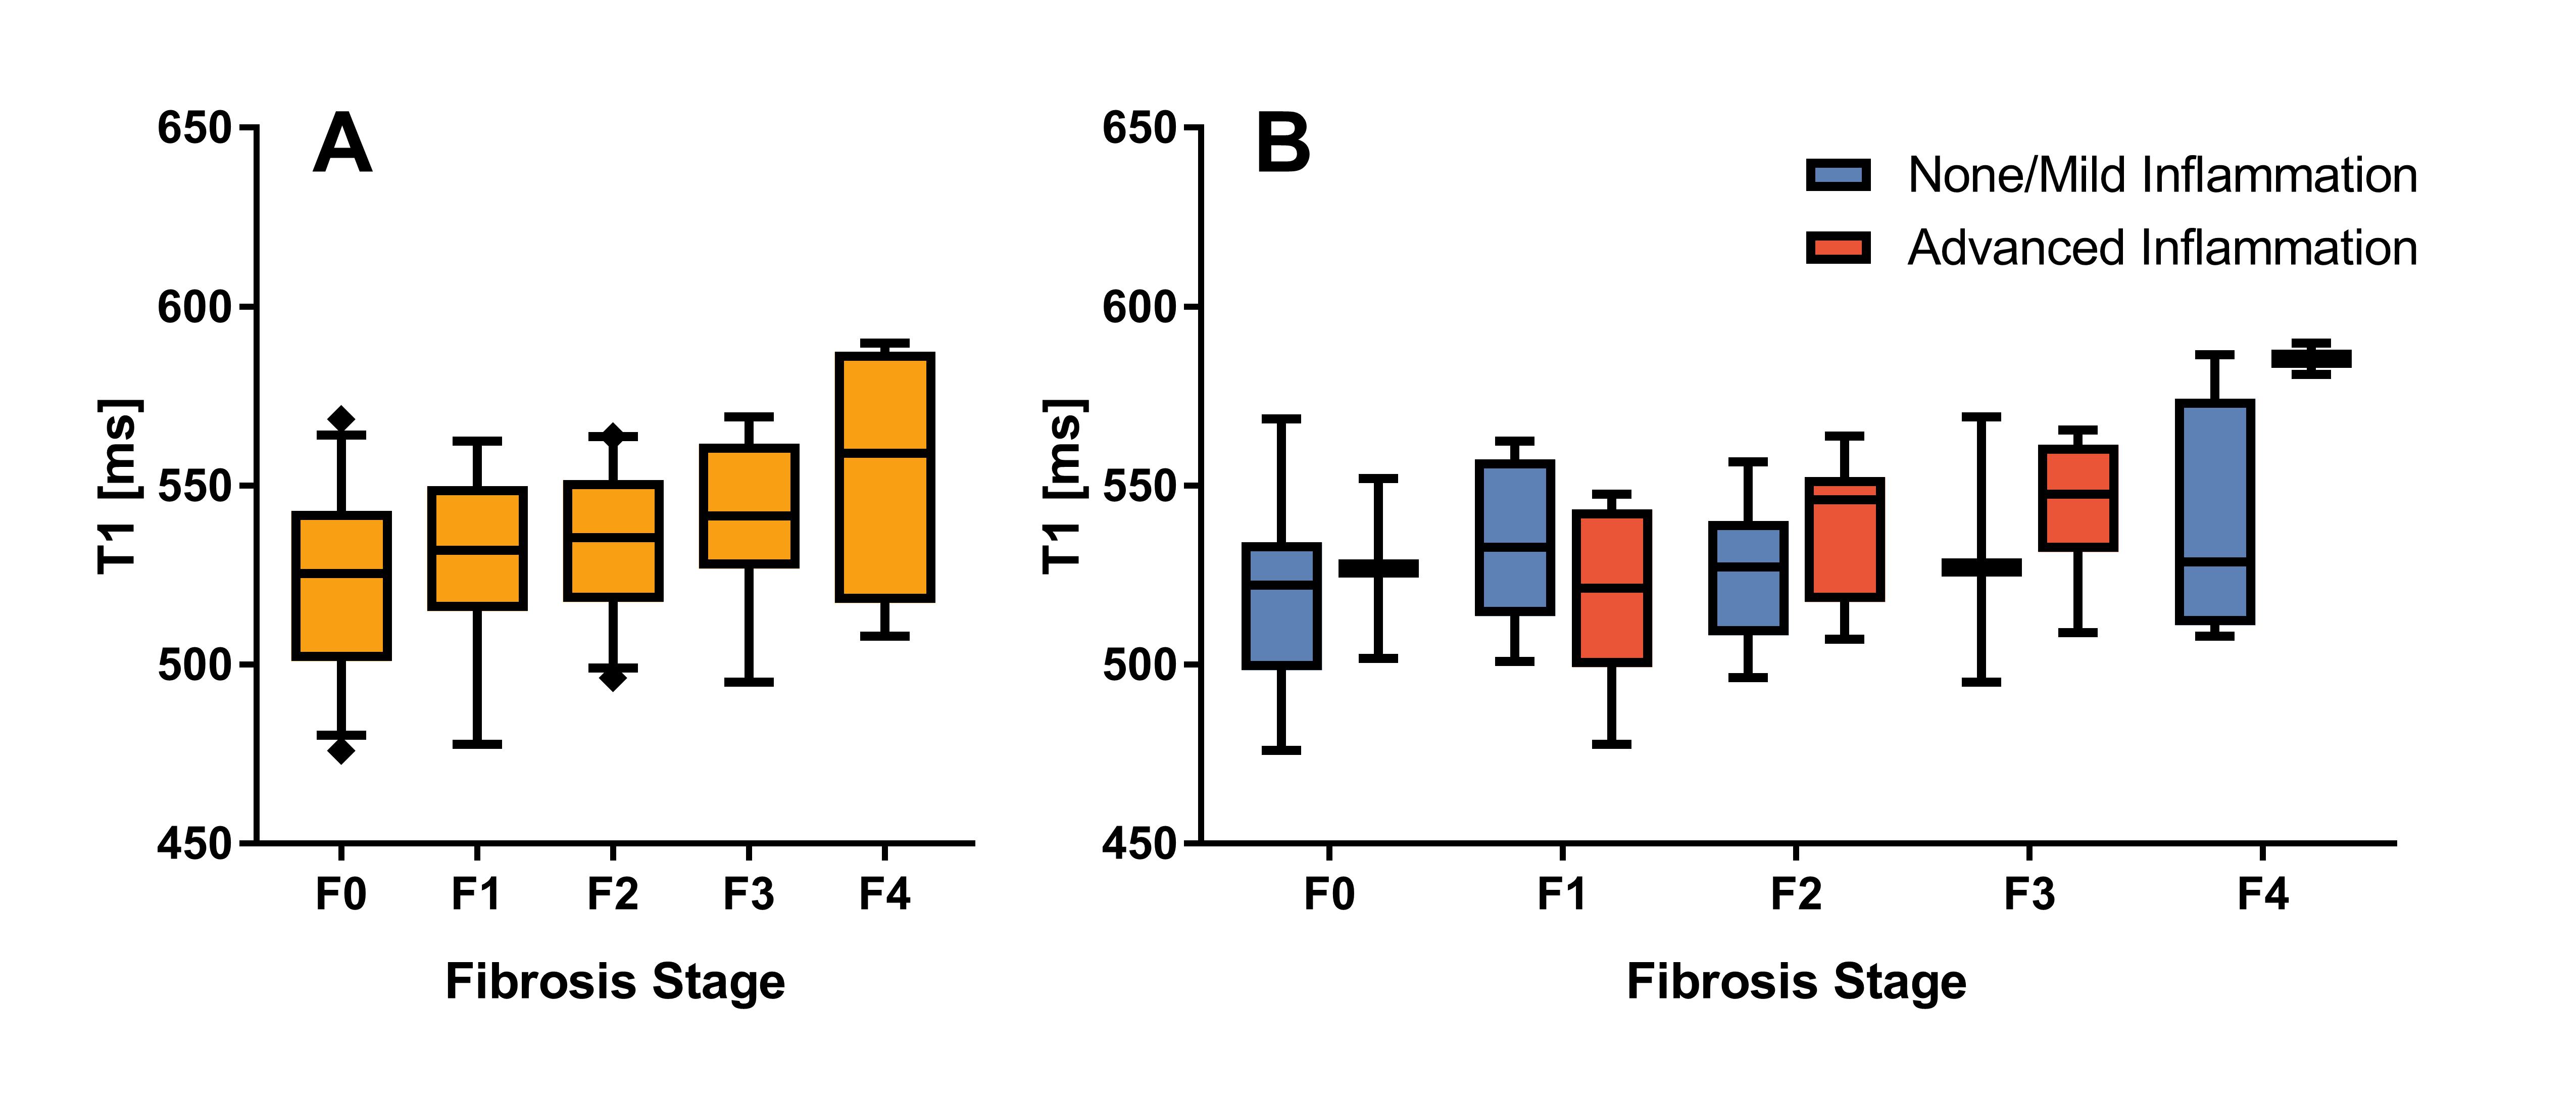
Fig 2A shows a boxplot of T1 for different fibrosis stages. An ANOVA with Bonnferroni correction found significant difference between F0 and F4 (p=0.049). Fig 2B shows T1 for the different fibrosis stages grouped by inflammation. In the figure, not much of an effect of inflammation on T1 is apparent.
An ANOVA of the 76 patients with LIC measurements with T1 as dependent variable, fibrosis and inflammation as categorical independent variables, and LIC as independent covariate showed that LIC was the only significant factor (p=0.01) while fibrosis was trending (p=0.056) and inflammation was not significant (p=0.292).
Discussion
We evaluated a method for measuring T1-relaxation in CLD patients, and the predictive value of T1 for staging hepatic fibrosis. Our method is not affected by fat, since fat/water-separation was used. However we were unable to detect any influence of fibrosis using this approach. In contrast, we observed that the T1-values were affected by iron accumulation in the liver.Conclusion
T1 in liver was affected by iron accumulation. In contrast, it was not possible to diagnose fibrosis using T1 values.Acknowledgements
No acknowledgement found.References
1. Banerjee R et al. Multiparametric magnetic resonance for the non-invasive diagnosis of liver disease. Journal of Hepatology 2014, 60(1):69-77.
2. Agrawal S et al. Visual morphometry and three non-invasive markers in the evaluation of liver fibrosis in chronic liver disease. Scandinavian Journal of Gastroenterology 2017, 52(1):107-115.
3. Tunnicliffe EM et al. A model for hepatic fibrosis: the competing effects of cell loss and iron on shortened modified Look‐Locker inversion recovery T1 (shMOLLI‐T1) in the liver. Journal of Magnetic Resonance Imaging 2016.
4. Warntjes MJB et al. Rapid T1 quantification based on 3D phase sensitive inversion recovery. BMC medical imaging 2010, 10(1):19.
5. Romu T et al. Robust water fat separated dual-echo MRI by phase-sensitive reconstruction. Magnetic Resonance in Medicine 2017, 78(3):1208-1216.
Figures