2608
Test-retest Repeatability of R2* Mapping and Quantitative Susceptibility Mapping for Liver Iron Quantification1Biomedical Engineering, University of Wisconsin-Madison, Madison, WI, United States, 2Radiology, University of Wisconsin-Madison, Madison, WI, United States, 3Medical Physics, University of Wisconsin-Madison, Madison, WI, United States, 4Medicine, University of Wisconsin-Madison, Madison, WI, United States, 5Emergency Medicine, University of Wisconsin-Madison, Madison, WI, United States
Synopsis
Liver iron concentration is widely recognized as the best overall metric of total body iron content. Accurate and precise (repeatable) non-invasive measurements of liver iron concentration are needed. In this work, we assessed the test-retest repeatability of R2* mapping and quantitative susceptibility mapping (QSM) in patients with liver iron overload at 1.5T. Our test-retest measurements demonstrate good agreement in different protocols for R2* quantification but large limits of agreements for QSM susceptibility estimates. Further optimization of QSM techniques is needed to improve test-retest repeatability.
Introduction
Excess iron deposition in the body is toxic and can lead to organ damages such as in the liver, pancreas, and heart. Liver iron concentration (LIC) is widely recognized as the best overall metric of total body iron content1. Accurate and precise (repeatable) non-invasive measurements of LIC are needed for diagnosis and treatment monitoring of iron overload. In MRI, liver R2* and tissue susceptibility have been shown to be strongly correlated with iron concentration, enabling non-invasive liver iron quantification2. However, the repeatability of R2* mapping and quantitative susceptibility mapping (QSM) have not yet been evaluated in patients with liver iron overload. Therefore, the purpose of this work was to assess the test-retest repeatability of R2* mapping and QSM in patients with liver iron overload using multiple acquisition protocols.Methods
Subjects: This prospective HIPAA compliant study was performed after obtaining local Institutional Review Board (IRB) approval. Subjects with known or suspected iron overload were recruited after obtaining informed written consent.
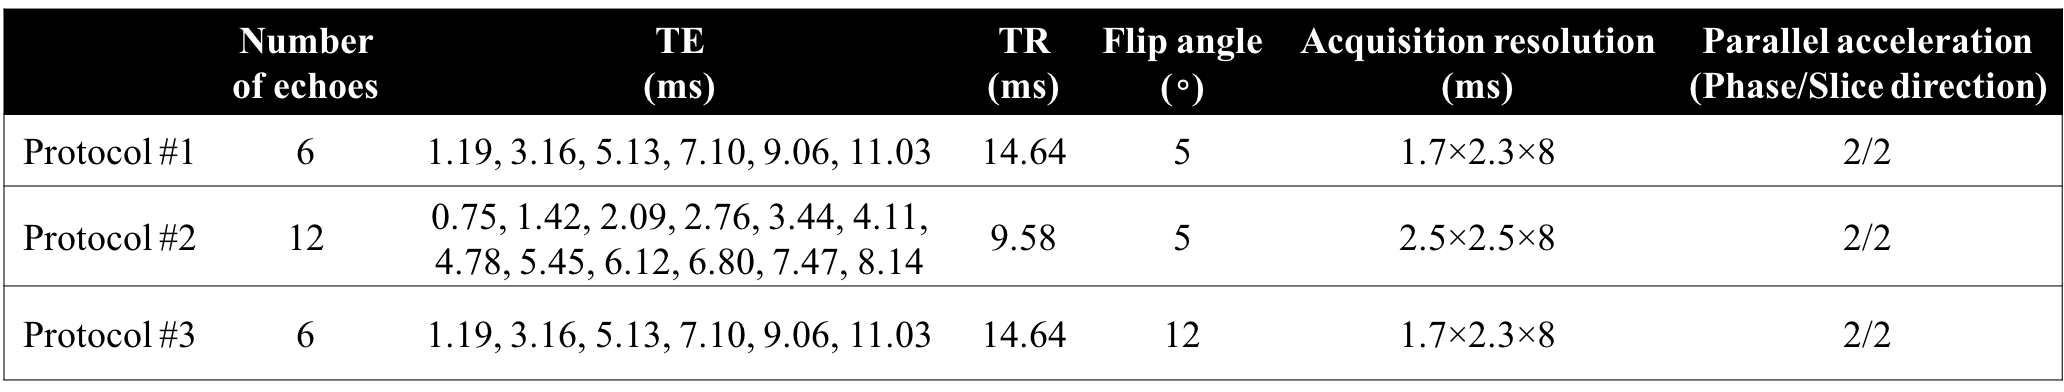
Imaging and reconstruction: All imaging was performed on a clinical 1.5T MRI system (GE Healthcare HDxt, Waukesha, WI) using an 8-channel body array coil (USA instruments, Aurora, OH). Breath-held 3D multi-echo spoiled gradient-echo (SGRE) acquisitions were performed for R2* mapping and QSM. Three different SGRE acquisition protocols with different parameters (e.g. flip angles, acquisition resolutions, and echo times) were scanned sequentially to assess the test-retest repeatability. After the first acquisition of all three protocols, the patients were brought out of the scanner, the coil was removed and the patients were asked to sit up. After a 5min break, the coil was repositioned, localizer images were reacquired and the three SGRE acquisitions were repeated. Acquisition parameters are detailed in Table 1.
R2* maps, as well as separated water and fat images and B0 field maps, were obtained by using a complex chemical shift-encoded reconstruction from each SGRE acquisition3. A liver QSM reconstruction algorithm4 was used to generate quantitative susceptibility maps. A large circular ROI region-of-interest (ROI) was drawn in the right lobe of the liver while avoiding large vessels and bile ducts for measurements of both R2* and susceptibility. The absolute liver tissue susceptibility was measured using the adjacent subcutaneous fat as a susceptibility reference. All ROIs in the liver of each patient were co-localized in images from different acquisitions.
Data analysis: The repeatability of liver R2* and susceptibility from each protocol were assessed using Bland-Altman analysis between the two repeated scans.
Results
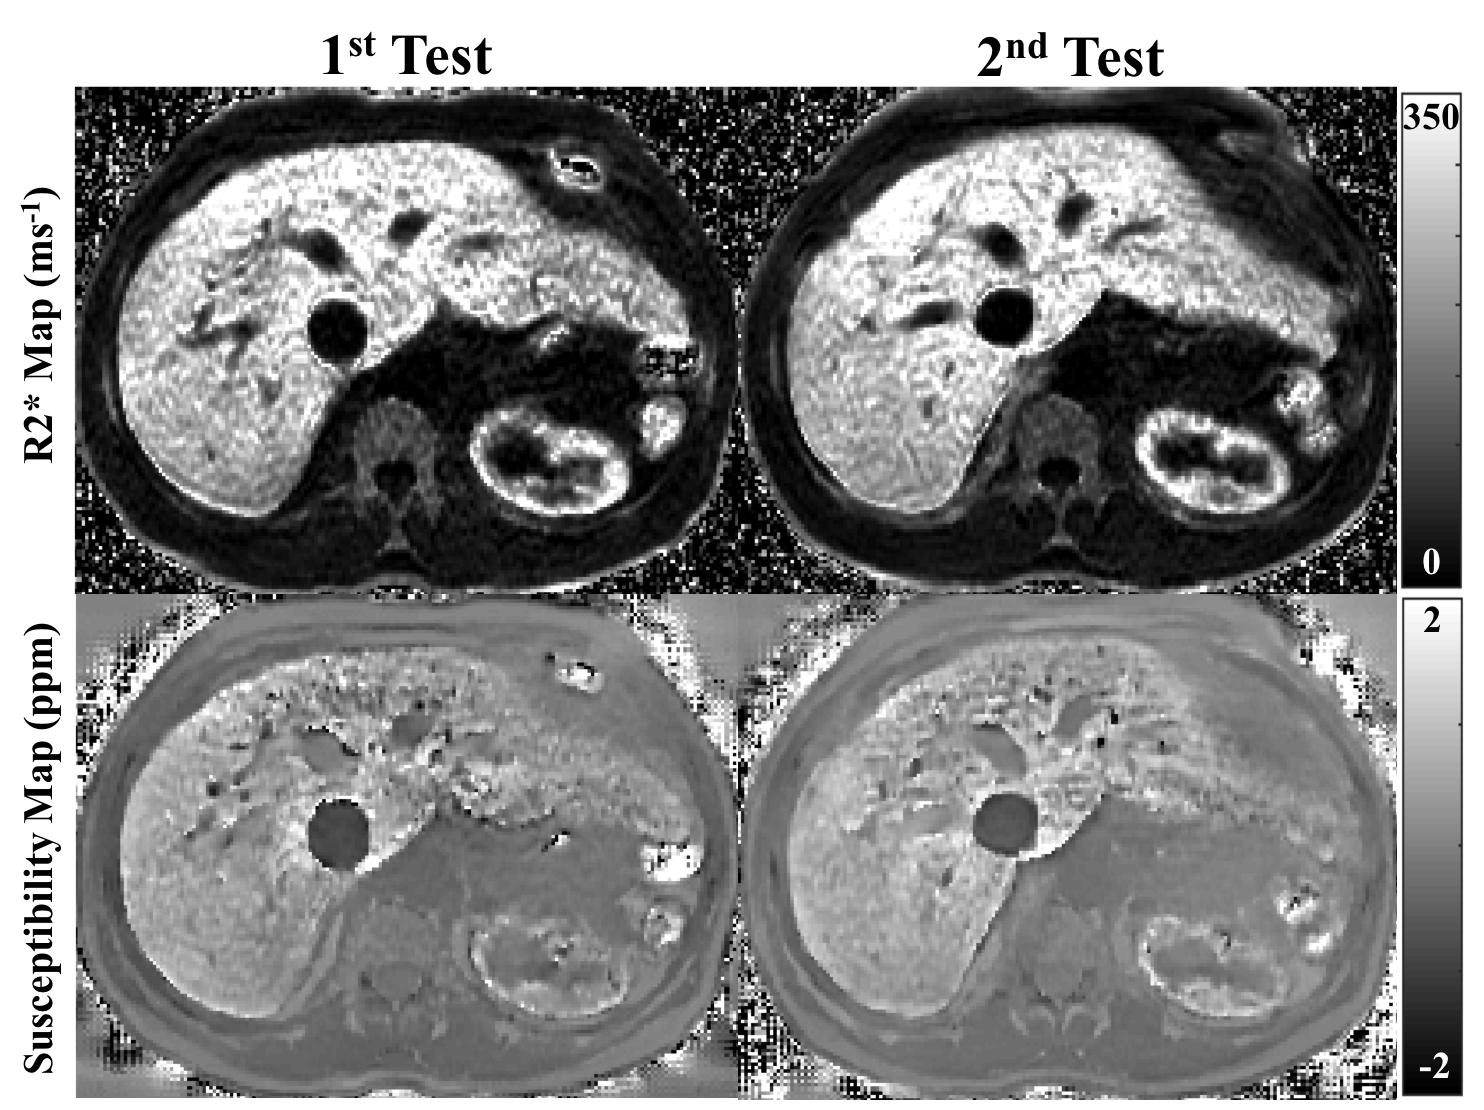
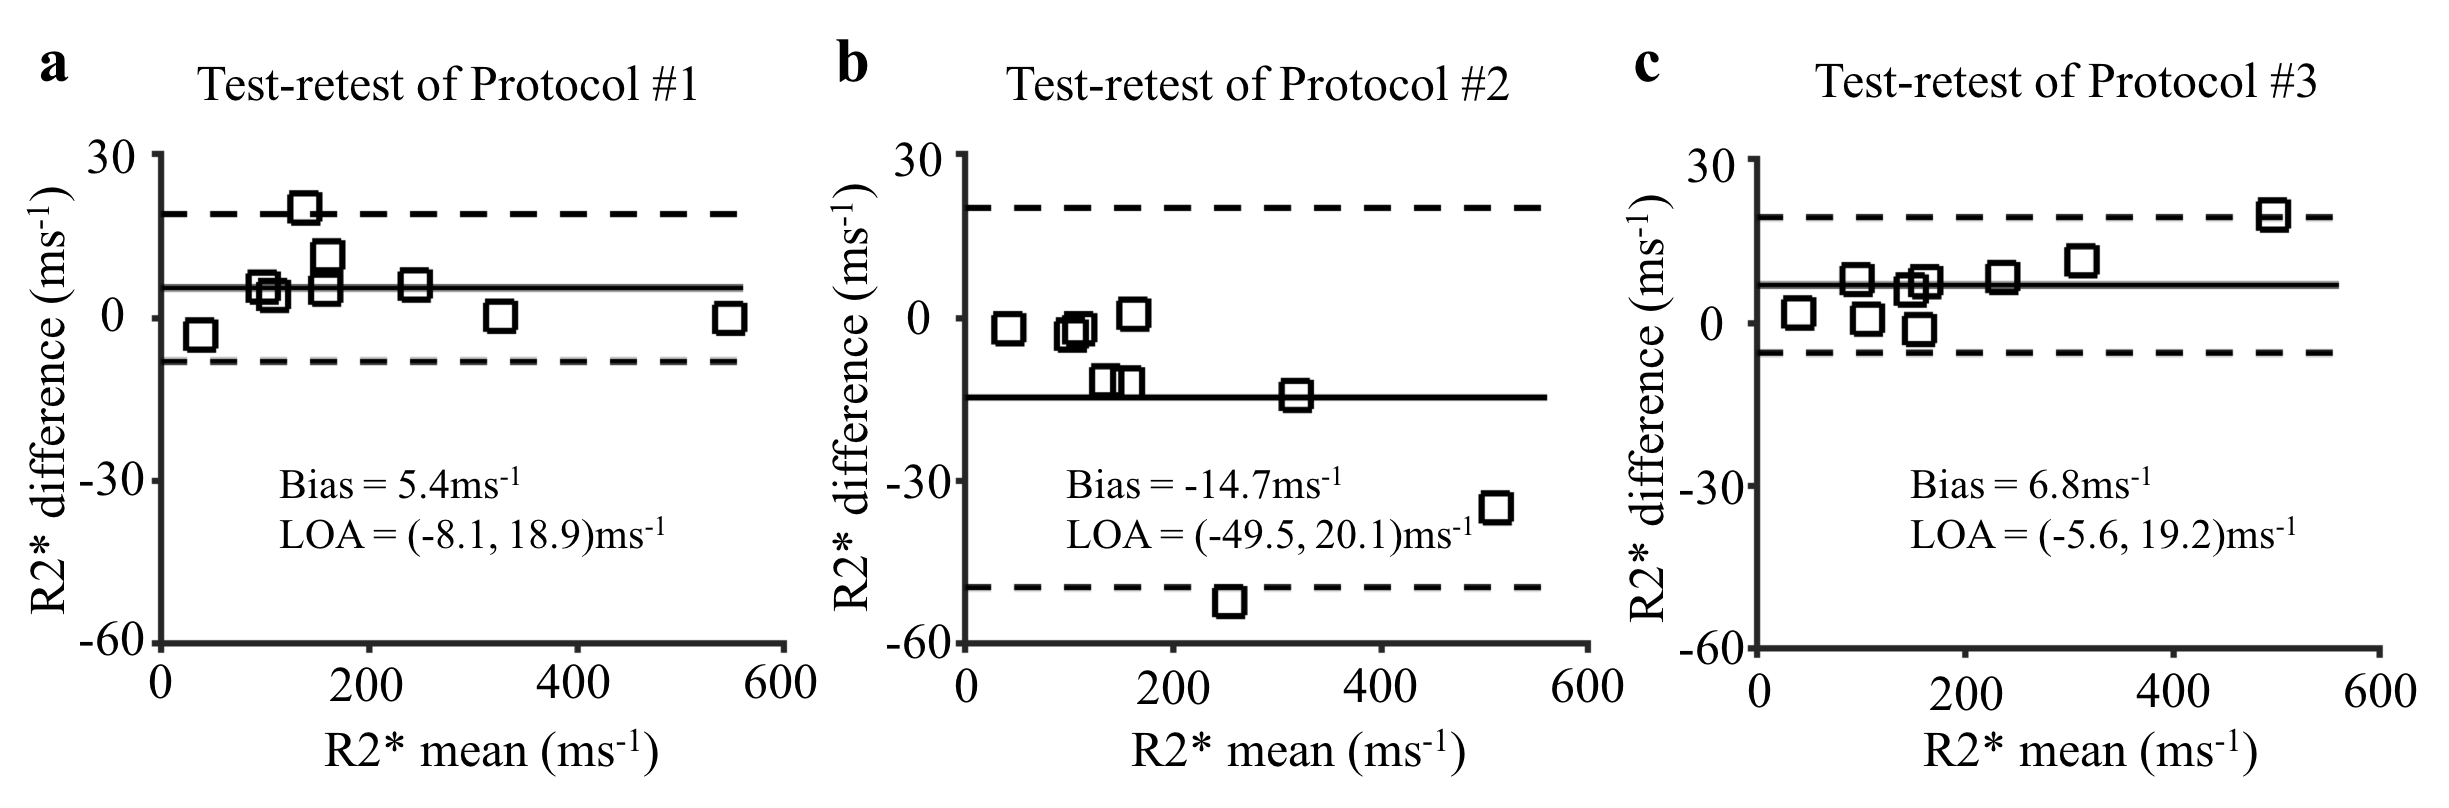
A total of 9 subjects were successfully recruited (5 women, 4 men, mean age 43±22 years). Figure 1 shows representative R2* maps and susceptibility maps from one subject. The spatial distribution of R2* and susceptibility in the liver was consistent between the two tests. In Figure 2, a small bias and narrow limits of agreement of R2* measurements are observed using the standard protocol (Protocol #1) and the protocol with a higher flip angle (Protocol #3), indicating high repeatability of R2* quantification. The measurements of R2* and tissue susceptibility in Protocol #2 (with different echo times and lower acquisition resolution) has a larger bias and limits of agreement than the other protocols.
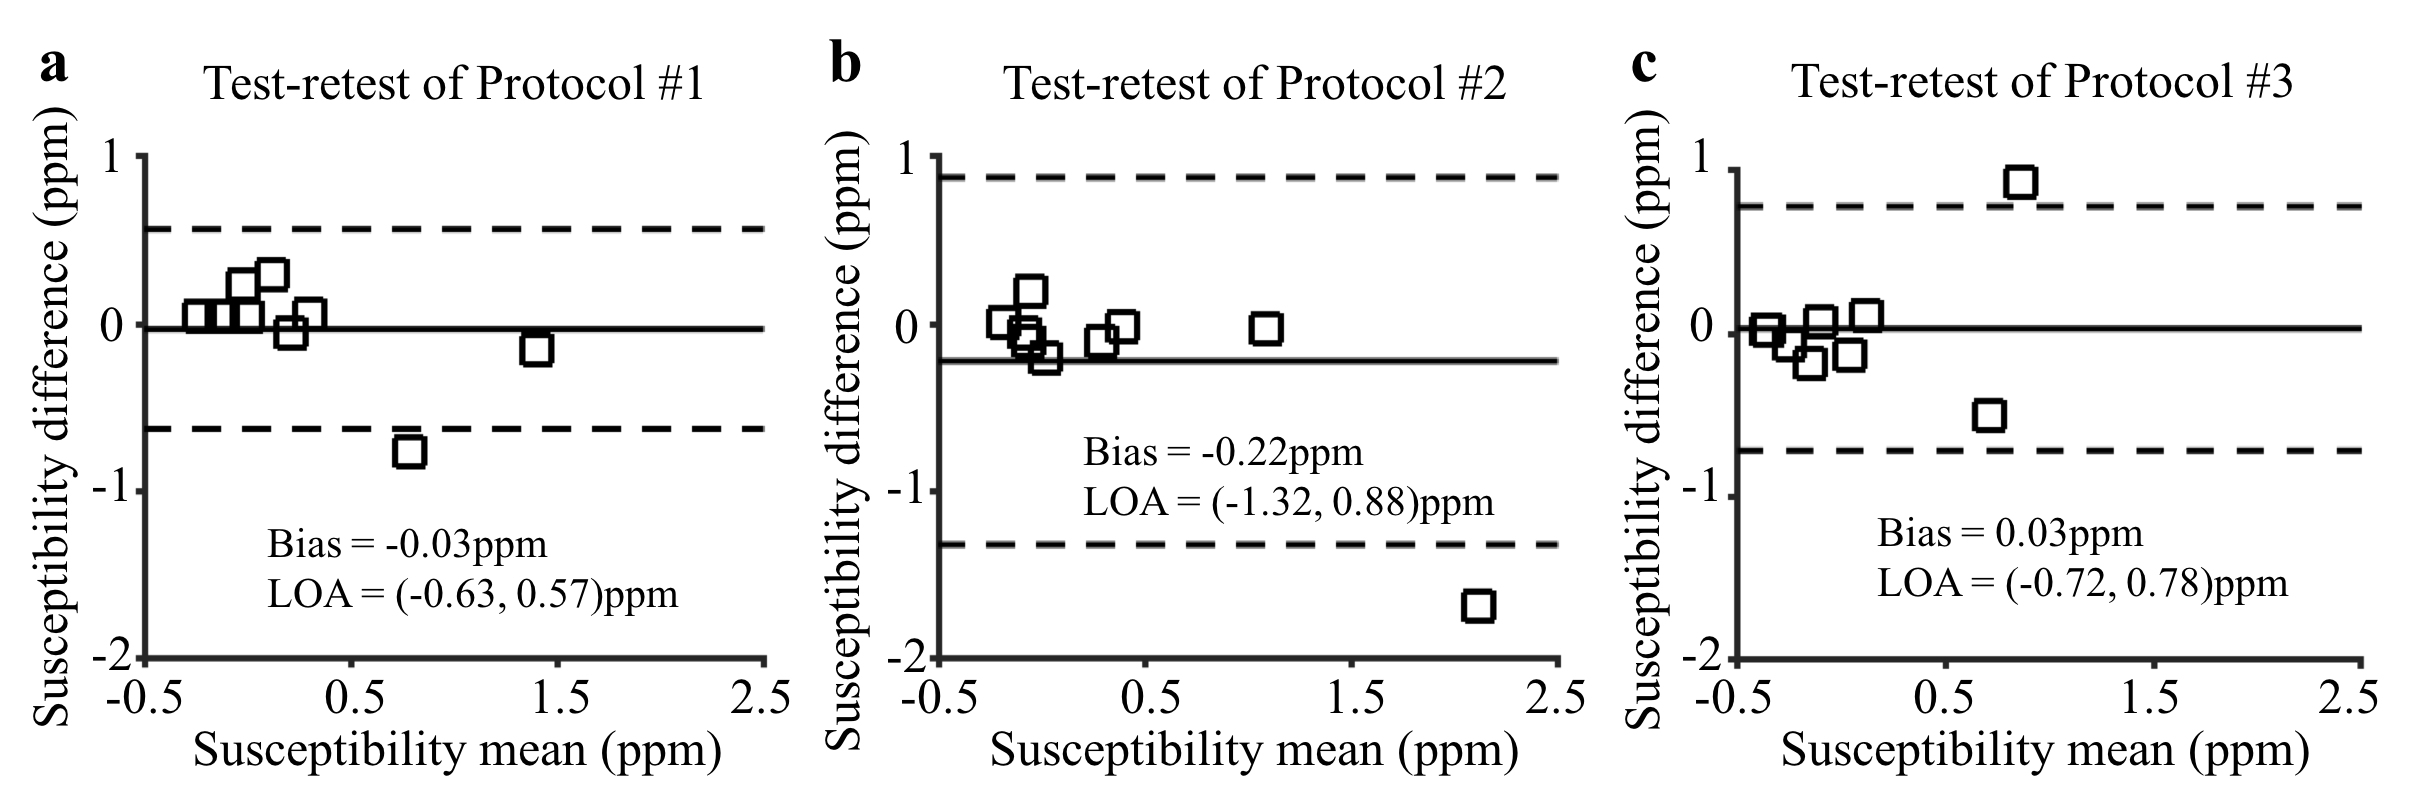
Figure 3 shows repeatability measurements of liver tissue susceptibility with a small bias in test-retest experiments using Protocol #1 and #3. The limits of agreement, however, are large relative to the small range of measured susceptibility.
Discussions and Conclusions
We have assessed the test-retest repeatability of R2* mapping and QSM in patients with liver iron overload, using three acquisition protocols. Preliminary results show good agreement in the measurements from the two repeated tests for R2* mapping. This study suggested that R2* and tissue susceptibility may provide repeatable estimation on liver iron concentration.
The limits of agreement of R2* in test-retest experiments showed that R2* mapping was more repeatable, compared to QSM in which a larger variability of liver tissue susceptibility was observed. This discrepancy may be caused by additional challenges of QSM compared to R2* mapping. Importantly, optimization of imaging parameters for liver QSM is more complicated than for R2* due to the non-local nature of the QSM inversion. Further protocol optimization is needed to further improve test-retest repeatability in QSM of the liver.
In summary, liver R2* mapping is highly repeatable, whereas liver QSM requires further optimization to improve its repeatability.
Acknowledgements
The authors acknowledge support from the NIH (grants R01-DK100651, K24-DK102595, R01-DK083380, R01-DK088925, and U01-HD087216) as well as GE Healthcare who provides research support to the University of Wisconsin-Madison.References
1. Brittenham GM, Badman DG. Noninvasive measurement of iron: report of an NIDDK workshop. Blood. 2003; 101:15-19.
2. Hernando D, et al. Quantification of liver iron with MRI: State of the art and remaining challenges. J Magn Reson Imaging. 2014; 40(5):1003-1021.
3. Yu H, et al. Multiecho water-fat separation and simultaneous R2* estimation with multifrequency fat spectrum modeling. Magn Reson Med. 2008; 60(5):1122-1134.
4. Sharma SD, et al. Quantitative susceptibility mapping in the abdomen as an imaging biomarker of hepatic iron overload. Magn Reson Med. 2015; 74(3):673-683.
Figures