2607
Global Measures of Liver Iron Content Based on T2* mapping and Dual Clustering Segmentation1Radiology, Boston University, Boston, MA, United States, 2Radiology, Boston Medical Center, Boston, MA, United States
Synopsis
Purpose: To develop a method to estimate total iron load of the whole liver. Methods: Multi gradient-echo pulse sequence was applied to 17 patients with varying degrees of liver iron content (LIC). LIC was measured via T2* mapping on a voxel-by-voxel basis. Liver was segmented with a semi-automated dual-clustering method. Total iron load was estimated by numerically integrating the LIC histogram. Results: This assessment of iron load presents a noninvasive whole liver alternative to liver biopsies. Conclusion: T2* relaxometry and segmentation provide a novel method for iron content quantification at the organ level that can easily be adapted in clinics.
Introduction
Iron is an important chemical element found in many cells in the human body. Iron is often stored intracellularly in ferritin proteins, but there are no homeostatic means of regulating its removal. In populations where a syndrome (i.e. genetic blood disorder) may cause a sustained increase in iron supply, an iron overload is likely to follow.1 Iron overload can eventually overwhelm the capacity of its ferritin container and accumulate in the cells. The “gold standard” to assess such iron content is biopsy and chemical analysis of the affected organ.2 MRI has long been used in place of biopsies for its noninvasive approach. T2/T2* relaxometry methods have proven most accurate of the MRI techniques as they are correlated to the extent of iron overload.2 However, such methods are limited to arbitrary selection of regions of interest (ROIs) in the affected organ. This research assesses the degree of iron load at the organ level through combining techniques of T2*, LIC (liver iron concentration), and dual-clustering segmentation.Methods and Materials
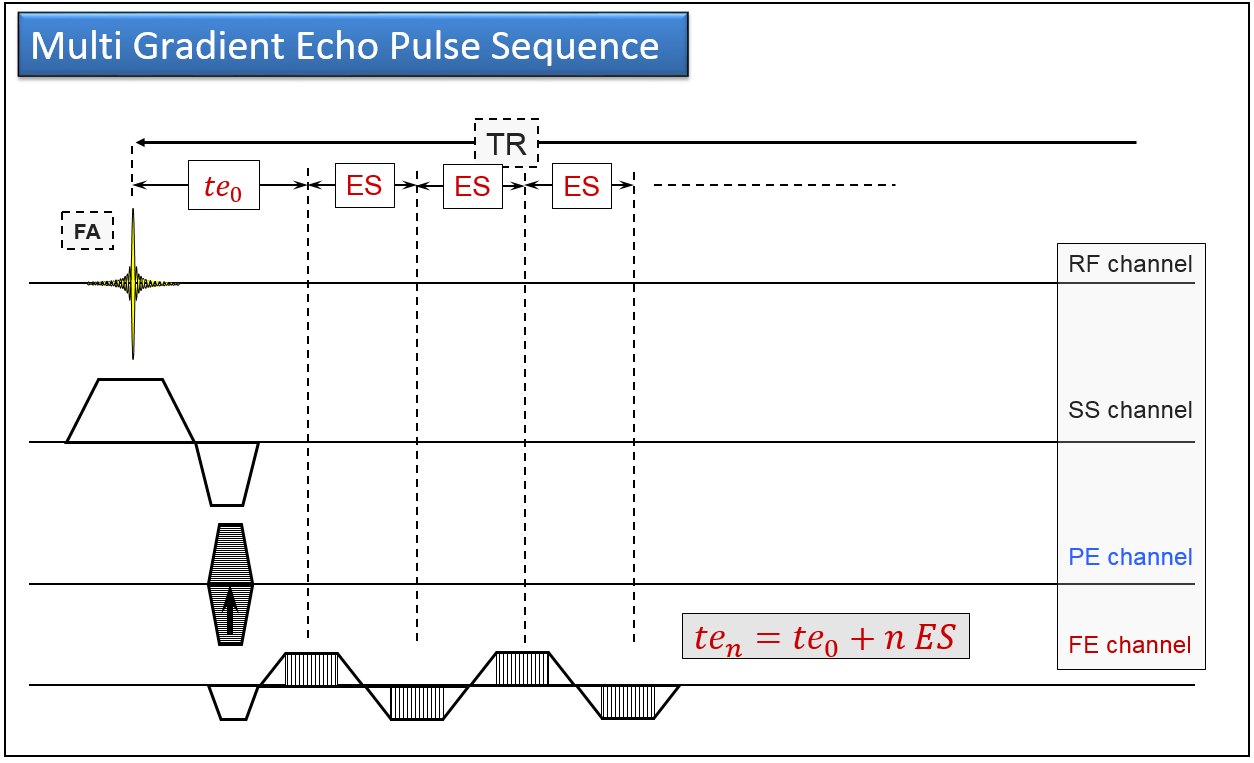
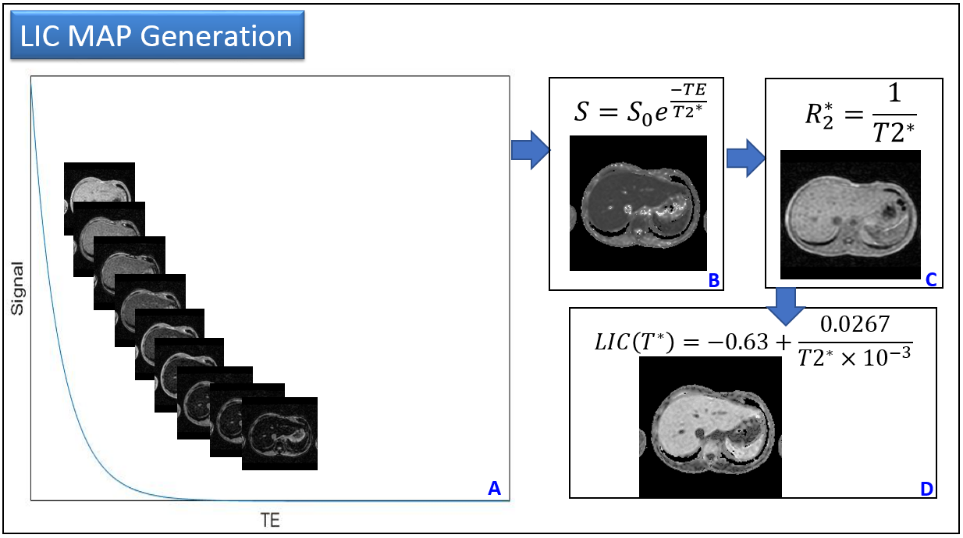
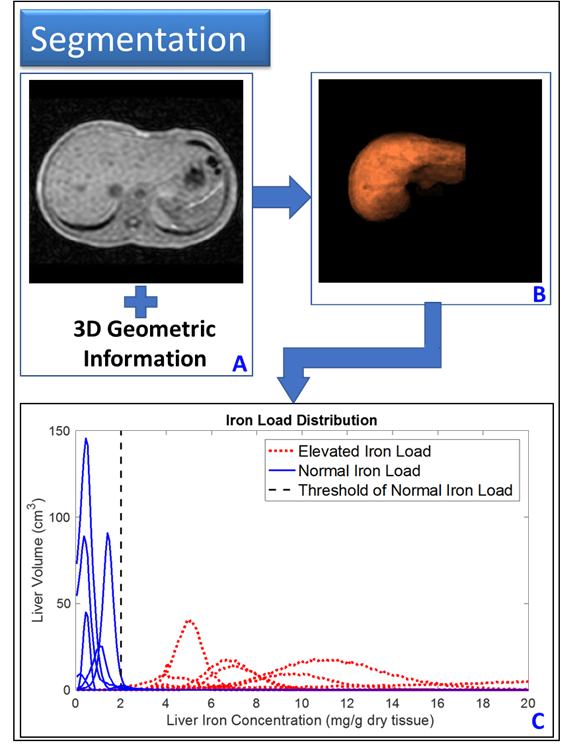
Under the approval of the local institutional review board (IRB) of our institution, a cohort of 17 patients with varying degree of iron concentrations in the liver was recruited in this study. All patients were scanned at a 1.5 T system (Achieva, Philips Healthcare, Best, The Netherlands) using a multi gradient-echo sequence (Figure 1). Key parameters are: number of echoes=10, ES=0.7220ms, TR=304.37ms, in-plane resolution=1.75x1.75mm2, slice thickness=5mm, number of slices=32, and number of acquisitions (NEX) =1. Data was processed with an in-house developed program coded in Mathcad (version 15 PTC, Needham MA). The T2* and R2* map was used to estimate the liver iron concentration (Figure 2). T2* and 3D geometric information was used to access the connectivity between voxels and segment the liver with a dual-clustering method (Figure 3).3 The histogram of LIC distribution was obtained for the segmented liver. The total iron load was calculated as the integral of the LIC histogram.Results
The demographics and medical conditions of the subject cohort are summarized as follows: age=24 ±18 yrs., female=7, male=10, 10 subjects have sickle cell disease, 3 subjects have hereditary hemochromatosis (HH), 2 subjects have thalassemia, 1 subject has history of cirrhosis, and 1 subject has no historical indication of elevated liver iron content. The average liver volume was 621.7 ±318.38 cm3. The distribution of LIC in segmented livers for all the subjects were summarized in Figure 3C, with each line representing a different subject. 7 out of the 17 subjects demonstrated a narrow distribution of LIC values --histogram half width=0.62 ±0.18 mg Fe/g dry tissue (blue solid line, Figure 3C), and their average total liver iron load was 0.88 ±0.60 mg. Whereas, 10 out of the 17 subjects showed a broad distribution of LIC values in the liver (histogram half width=3.61 ±3.51 mg Fe/g dry tissue), and their average total iron load in the liver was 7.94 ±5.04 mg.Discussion
Both the biopsy and ROI based MRI methods rely on arbitrarily selecting liver regions, thus can easily lead to misinterpreting iron content in cases of inhomogeneous iron distribution across the organ. Here, we propose using a combination of dual-clustering segmentation and quantitative T2* MRI (qMRI) to estimate the total iron deposition in the liver as a whole. We observe broad LIC histograms in 10 patients in our study cohort. These broad spectra signify the heterogeneity of iron concentrations across the liver when in overload stasis. Our method of integrated LIC distribution can obtain the total iron load in the liver, which will be independent of sample selection.Conclusion
As demonstrated herein, LIC histogram iron distribution can be inhomogeneous in the liver. The described method, which combines T2* qMRI and dual clustering segmentation provides global measures of iron deposition and can be easily adopted in the clinical setting. This study could lead to a reduction in the number of biopsies while confirming the inaccuracies with liver biopsies and existing MRI LIC quantification.Acknowledgements
No acknowledgement found.References
1. Sirlin C, Reeder S. Magnetic Resonance Imaging Quantification of Liver Iron. Magnetic Resonance Imaging Clinics of North America. 2010;18(3);359–ix.
2. Alústiza Echeverría J, Castiella A, Emparanza J. Quantification of iron concentration in the liver by MRI. Insights into Imaging. 2012;3(2);173–180.
3. Watanabe M, Sakai O, Norbash A, et al. Accurate brain volumetry with diffusion-weighted spin-echo single-shot echo-planar-imaging and dual-clustering segmentation: Comparison with volumetry-validated quantitative magnetic resonance imaging. Med Phys. 2010;37(3);1183–1190.
Figures