2604
Demonstration of linear correlation between R2* and liver iron concentration across multiple MR acquisition parameters at 1.5T and 3T.1Radiology, Lucile Packard Children's Hospital, Palo Alto, CA, United States, 2Stanford University of Medicine Quantitative Sciences Unit, Stanford University, Palo Alto, CA, United States, 3GE Healthcare, Sunnyvale, CA, United States, 4Radiology, Medical Physics, University of Wisconsin, Madison, WI, United States, 5Radiology, Biomedical Engineering, Medical Physics, University of Wisconsin, Madison, WI, United States
Synopsis
We demonstrate a robust linear relationship between the concentration of liver iron and R2* measurements taken in any liver segment, with various planes of acquisition, slice thickness, flip angle, and echo spacing at 1.5T or 3T. As compared with Ferriscan, R2* imaging is faster, lower-cost, and requires no post-processing, and has better geographic availability compared to the gold standard of superconducting quantum interference devices.
Introduction
R2* is a promising biomarker of liver iron concentration (LIC), with important application in the diagnosis and treatment monitoring of iron overload. Previous works have demonstrated the high correlation of liver R2* with biopsy-determined LIC [1, 2]. We sought to compare R2* measurements to other noninvasive measurements of LIC including (1) a previously calibrated, FDA-approved single-spin-echo R2-based technique at 1.5T (FerriScan, Resonance Health, Australia, [3]), and (2) measurements obtained with a superconducting quantum interference device (SQUID), which has previously been shown to have excellent correlation with biopsy-determined LICs [4], and serum ferritin. Only four SQUIDs are currently available worldwide [2]. We performed this correlation in each liver segment, at different field strengths, and with different acquisition parameters .
Purpose
1. Measure R2* in each liver segment, at different field strengths, image planes, and MR parameters.
2. Determine the relationship between R2*, serum ferritin concentration, and LIC as measured by Ferriscan and superconducting quantum interference device (SQUID) biosusceptometry.
Material and Methods
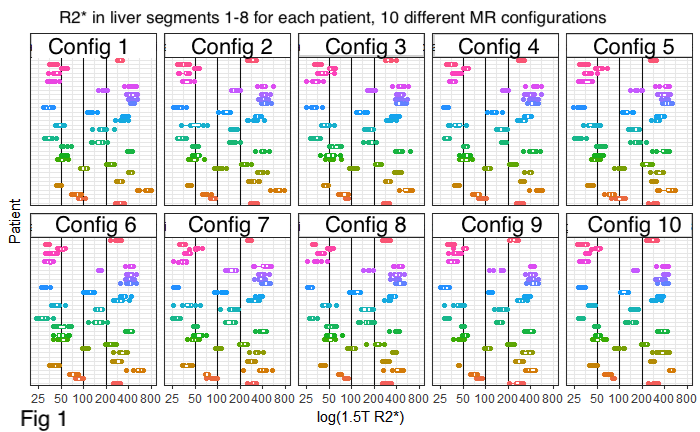
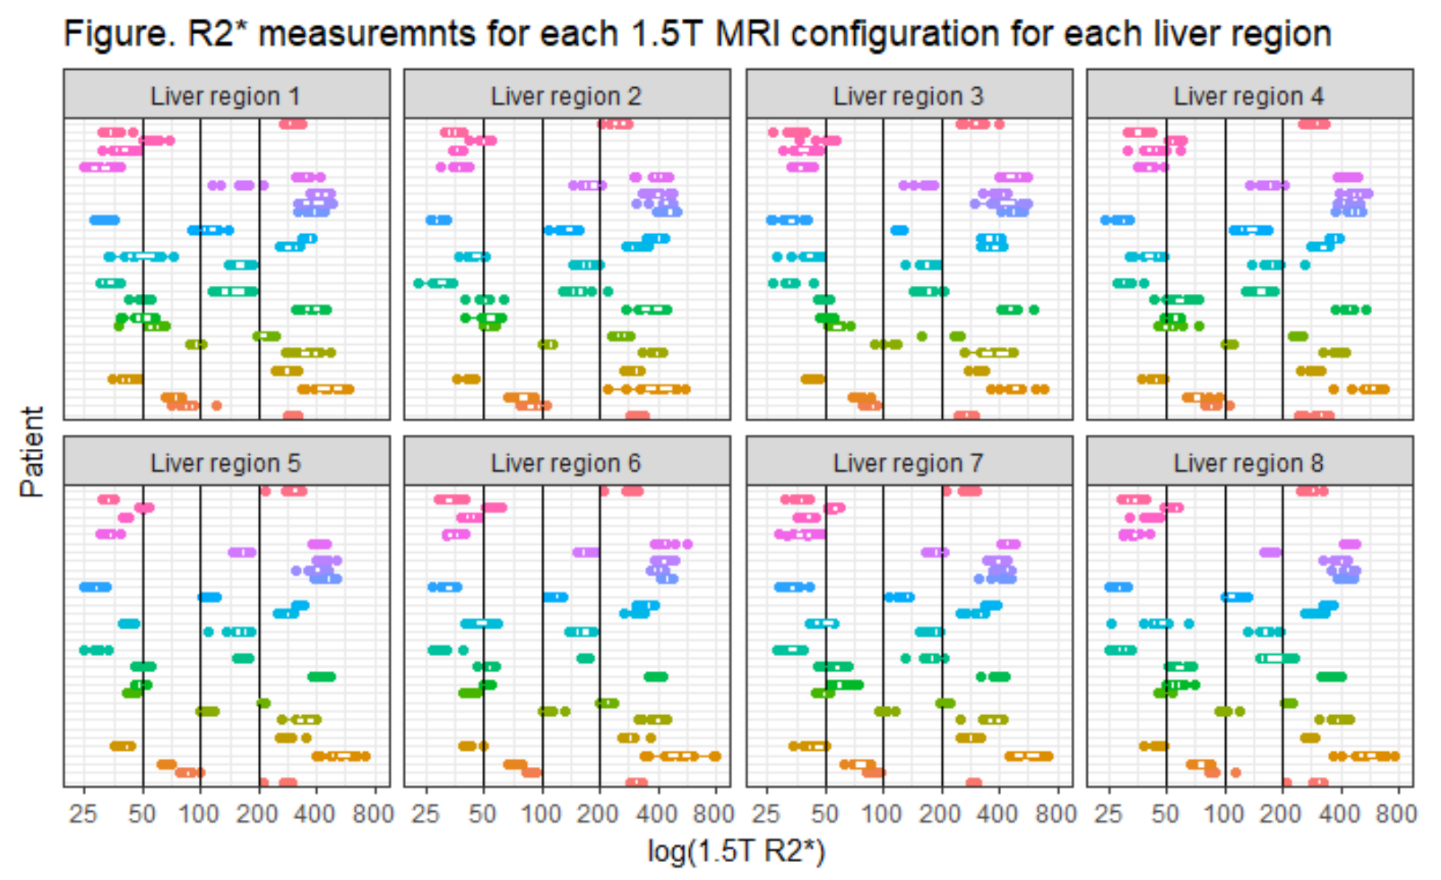
R2* was measured at 1.5T and 3T in each patient on the same day using 10 different MR parameters including axial, sagittal, and coronal planes with varied echo spacing, flip angle, and slice thickness. The absolute agreement among R2* across liver regions and acquisition parameters was assessed using the intraclass correlation coefficient (ICC). Mean R2* values across 1-8 and 5-8 liver segments were calculated for each patient for comparison with LIC. The relationship between mean R2* and LIC for each reference method and MR acquisition parameter was summarized using the spearman rank correlation coefficient and normal linear regression.
Results
Thirty-three patients (mean 20 years, range 8 -70, 45% male) had 4696 total R2* MRI measurements at 1.5T and 3T. Thirty-two patients’ ferritin (range 30-2728 ng/mL), 31 Ferriscan (range 0.9-25.2 mg/g dry tissue), and 14 SQUID (range 212-2625µg/g wet liver) measurements were obtained, Fig 1.
There was high absolute agreement for R2* regardless of liver segment (ICC 0.959-0.975 at 1.5T, 0.894-0.956 at 3T) and MR parameters (0.961-0.977 at 1.5T; 0.940-0.967 at 3T), Figs 2 and 3.
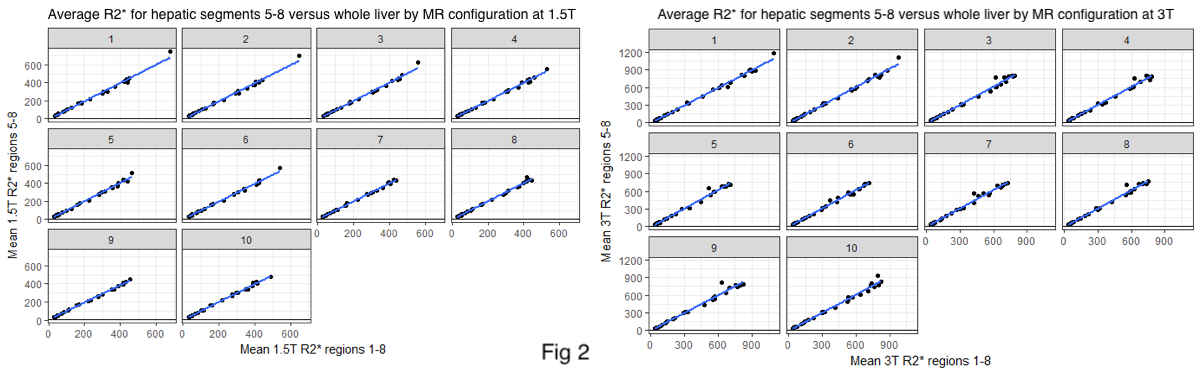
There was no difference between averaged whole liver R2* and the right lobe average, Fig 4.
Spearman correlation coefficients were high between R2* and LIC by Ferriscan (0.945-0.953 at 1.5T, 0.903-0.967 at 3T) and SQUID (0.899-0.943 at 1.5T, 0.789-0.925 at 3T) regardless of MR acquisition parameters or liver segment (see Fig 4 for an example mean R2*/LIC linear regression analysis, using 1 of 10 acquisition parameters at 1.5T). Correlation between R2* and serum ferritin was lower (0.814-0.846 at 1.5T, and 0.776-0.829 at 3T),
Conclusion
R2* is a consistent measure of liver iron concentration independent of liver segment, MR parameters, and magnet strength. As such, R2* may be considered a robust noninvasive biomarker of LIC, and represents an improvement over Ferriscan’s greater cost, longer acquisition time, and longer post-processing time, and over SQUID, which has limited geographic availability.
Acknowledgements
Elisabeth Merkel, Clinical Research Nurse, Stanford University
NIH, R01 DK100651
References
1. Hankins, J.S., et al., R2* magnetic resonance imaging of the liver in patients with iron overload. Blood, 2009. 113(20): p. 4853-5.2. Wood, J.C., et al., MRI R2 and R2* mapping accurately estimates hepatic iron concentration in transfusion-dependent thalassemia and sickle cell diseasepatients. Blood, 2005. 106(4): p. 1460-5.3.
2. Hernando, D., et al., Quantification of liver iron with MRI: State of the art and remaining challenges. J Magn Reson Imaging, 2014. 40(5): p. 1003-1021.4.
3. St Pierre, T.G., et al., Noninvasive measurement and imaging of liver iron concentrations using proton magnetic resonance. Blood, 2005. 105(2): p. 855-61.
4. Brittenham GM, Sheth S, Allen CJ, Farrell DE. Noninvasivemethods for quantitative assessment of transfusional iron over-load in sickle cell disease. Semin Hematol 2001;38:37–56.
Figures
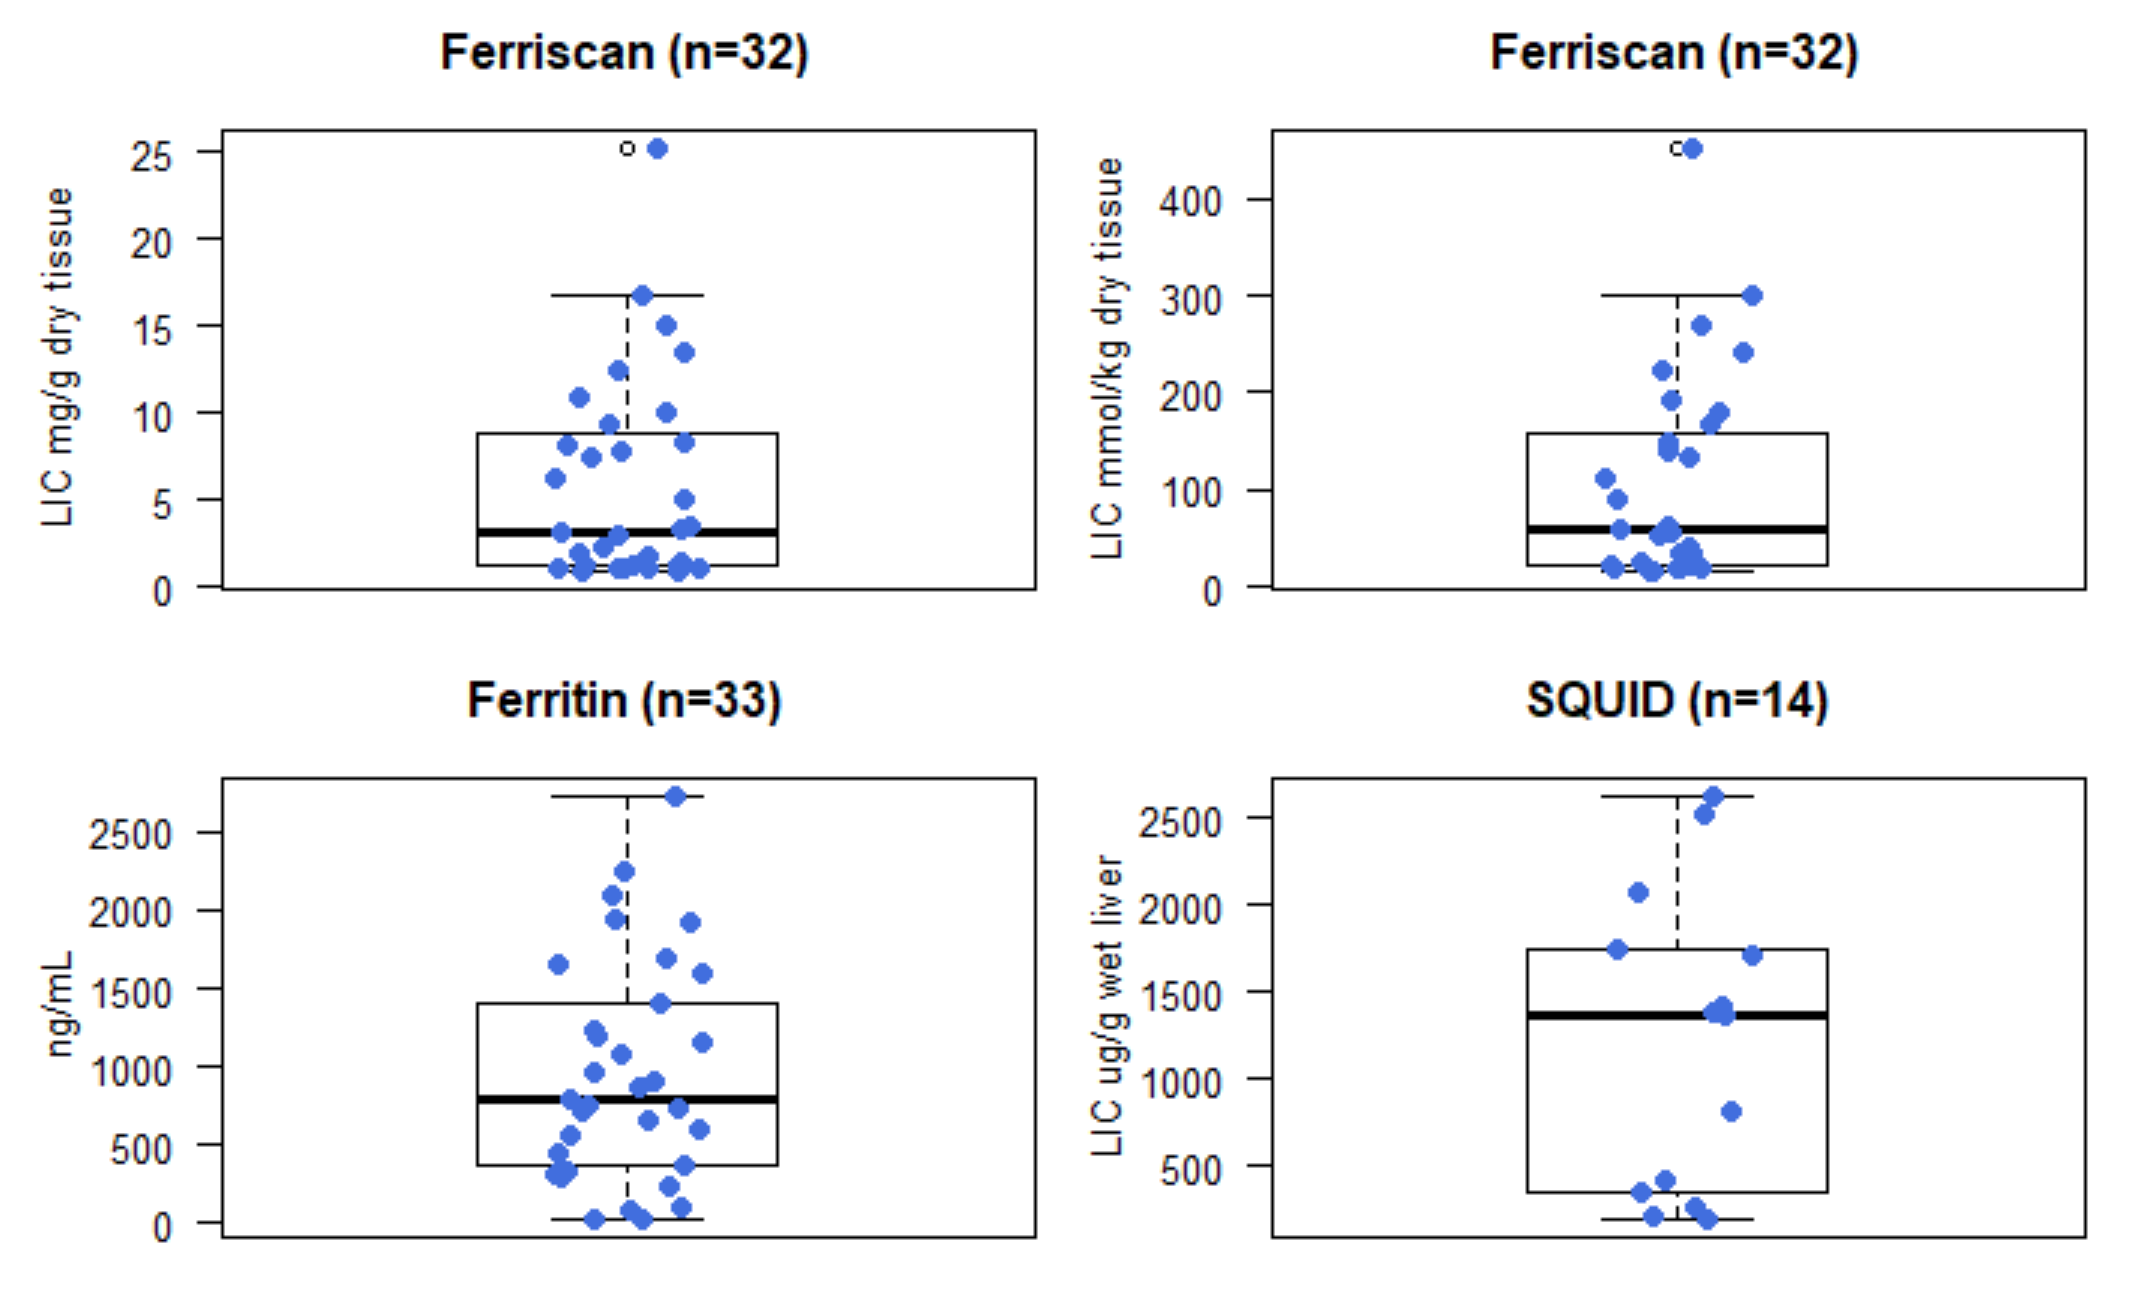
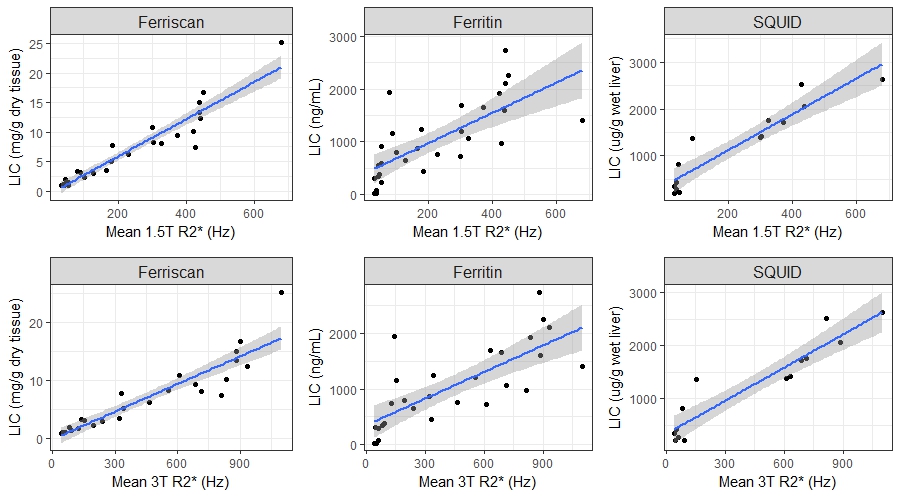
Linear regression analysis. Liver iron concentration via Ferriscan, Ferritin, and Superconducting Quantum Interference Detector (SQUID) versus mean of liver segment 1-8 R2* values at 1.5T and 3T using one of ten MR configurations (axial plane, 8mm slice thickness, 12 degree flip angle, echo spacing 12 ms). 95% confidence intervals in grey.
Spearman correlation
1.5 T
Ferriscanrho = 0.949, 95% conf.int = [ 0.895, 0.976 ]
Ferritinrho = 0.819, 95% conf.int = [ 0.650, 0.910 ]
SQUIDrho = 0.934, 95% conf.int = [ 0.800, 0.979 ]
3T
Ferriscanrho = 0.966, 95% conf.int = [ 0.928, 0.985 ]
Ferritinrho = 0.816, 95% conf.int = [ 0.637, 0.912 ]
SQUIDrho = 0.925, 95% conf.int = [ 0.775, 0.976 ]