2603
Ultrashort Echo Time Imaging for Quantification of Hepatic Iron Overload: Comparison of Current Acquisition and Fitting Methods via Simulations and Phantom Data1Diagnostic Imaging, St. Jude Children's Research Hospital, Memphis, TN, United States, 2Hematology, St. Jude Children's Research Hospital, Memphis, TN, United States
Synopsis
Assessment of hepatic iron content by R2*-MRI is a non-invasive alternative to liver biopsy. R2* is typically measured by a multiecho gradient-echo (GRE) sequence, however, GRE fails in high iron cases when T2* decay is rapid. In recent years, ultrashort echo time (UTE) imaging has been proposed to increase the accuracy in R2* measurements in high and massive iron overload. Still, the accuracy of R2* measurements depends on acquisition parameters and curve fitting algorithms, which vary between institutions. The purpose of this study is to compare current R2* acquisition and fitting methods, and identify the optimal acquisition and fitting methods for clinical use.
Introduction
Recently, ultrashort echo time (UTE) imaging has been proposed instead of gradient-echo (GRE) acquisition to increase the accuracy in R2* based hepatic iron content (HIC) measurements in high iron overload1-3 while permitting the use of free-breathing scans.4 Yet, the accuracy of R2* measurements depends on acquisition parameters such as echo spacing (∆TE), maximum TE (TEmax), and signal-to-noise ratio (SNR), which may vary between institutions.1, 2 Additionally, there are various fitting models proposed that produce different R2* values and therefore different HIC calibrations.5-7 The purpose of this study is two-fold: a) to compare the accuracy and precision of current R2* acquisition and fitting models using simulations, and b) to investigate the effect of different UTE acquisition parameters on different fitting models using simulations and phantoms.Methods
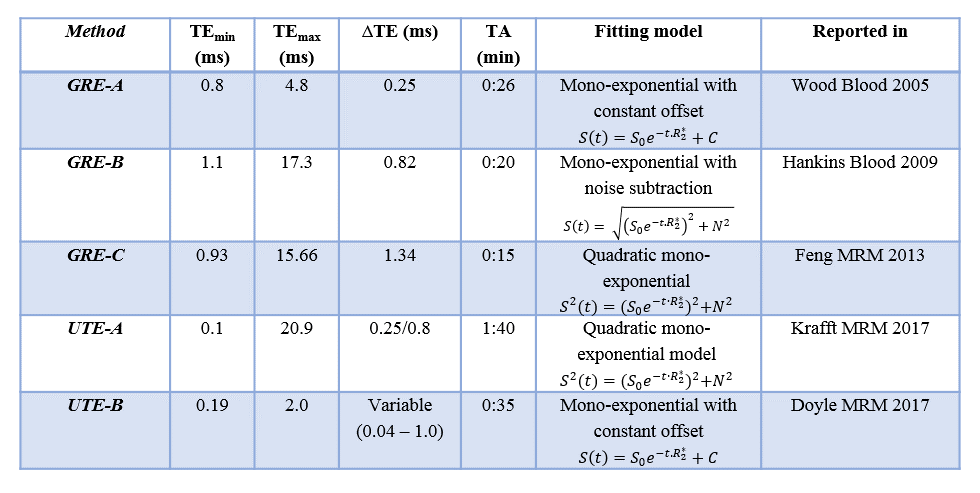
Simulations were performed for the published GRE and UTE acquisition and fitting methods reported in Table 1. Coefficient of variance (CoV) was calculated in Maple for each acquisition independent of the fitting model, to give the lower bound of achievable precision. To compare the accuracy of R2* measurements, Monte Carlo simulations were performed using Matlab for the respective acquisition and fitting models listed in Table 1. For each simulation, 40 R2* values from 25-2000s-1 were defined. For each R2* value, 10,000 Gaussian-distributed R2* data points were created and a signal curve was generated using the reported TEs for each acquisition. Complex Gaussian noise was added to each synthetic signal, which was subsequently fitted with the respective fitting algorithms to calculate estimated R2*.
The performance of reported fitting models for different UTE acquisition parameters was investigated using simulations and iron phantoms. Ten 1L iron phantoms were constructed from 2% agar-water mixtures and doped with various amounts of bionized nonferrites particles to obtain a wide range of R2* values, and were scanned at 1.5T with UTE-A. Images were acquired with different SNRs by changing the number of averages (NA).
Results & Discussion
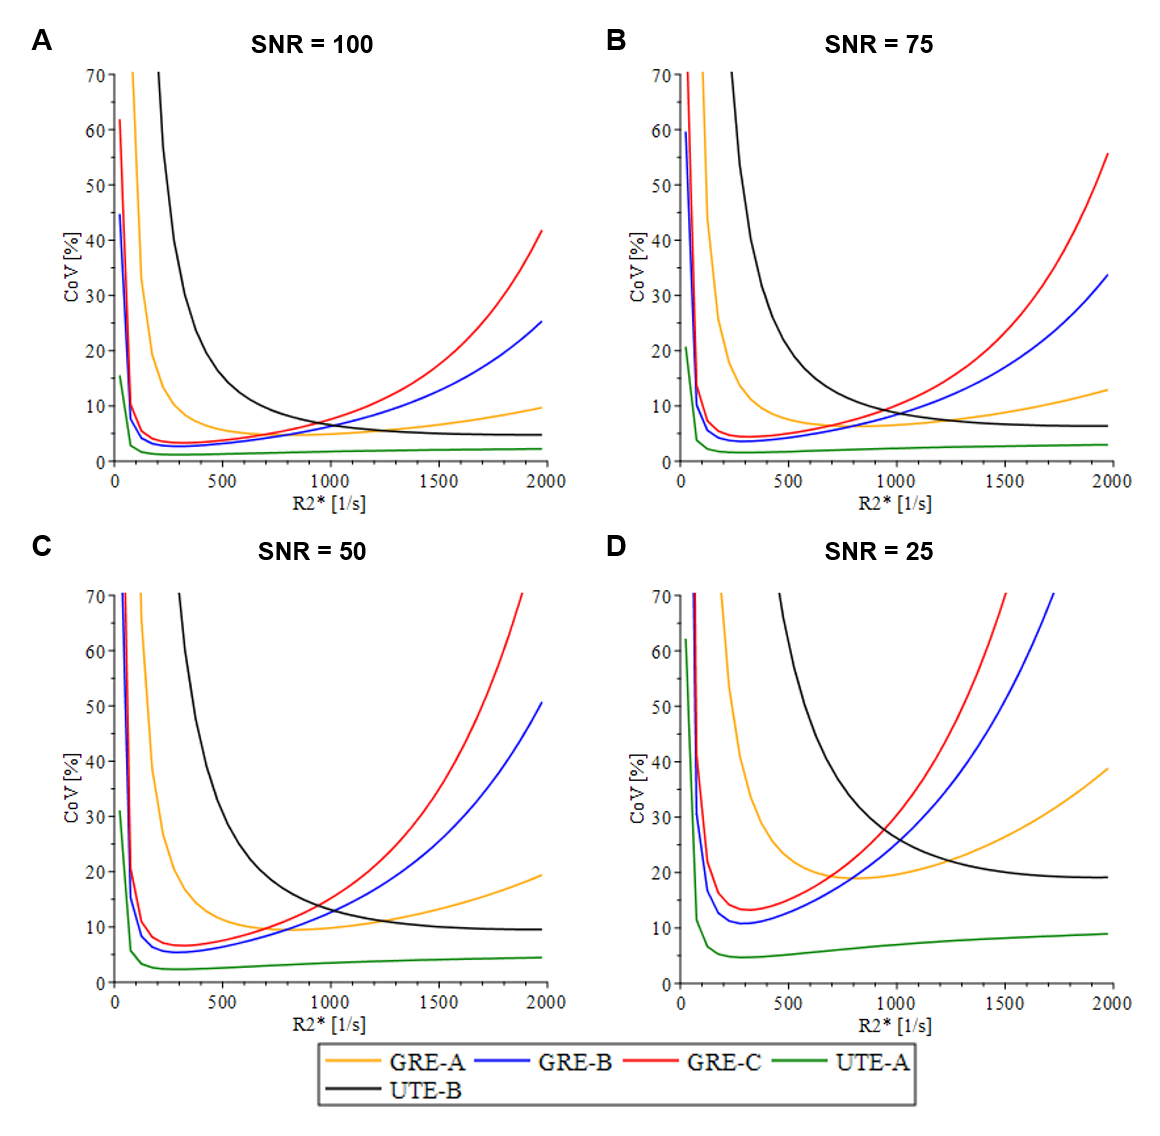
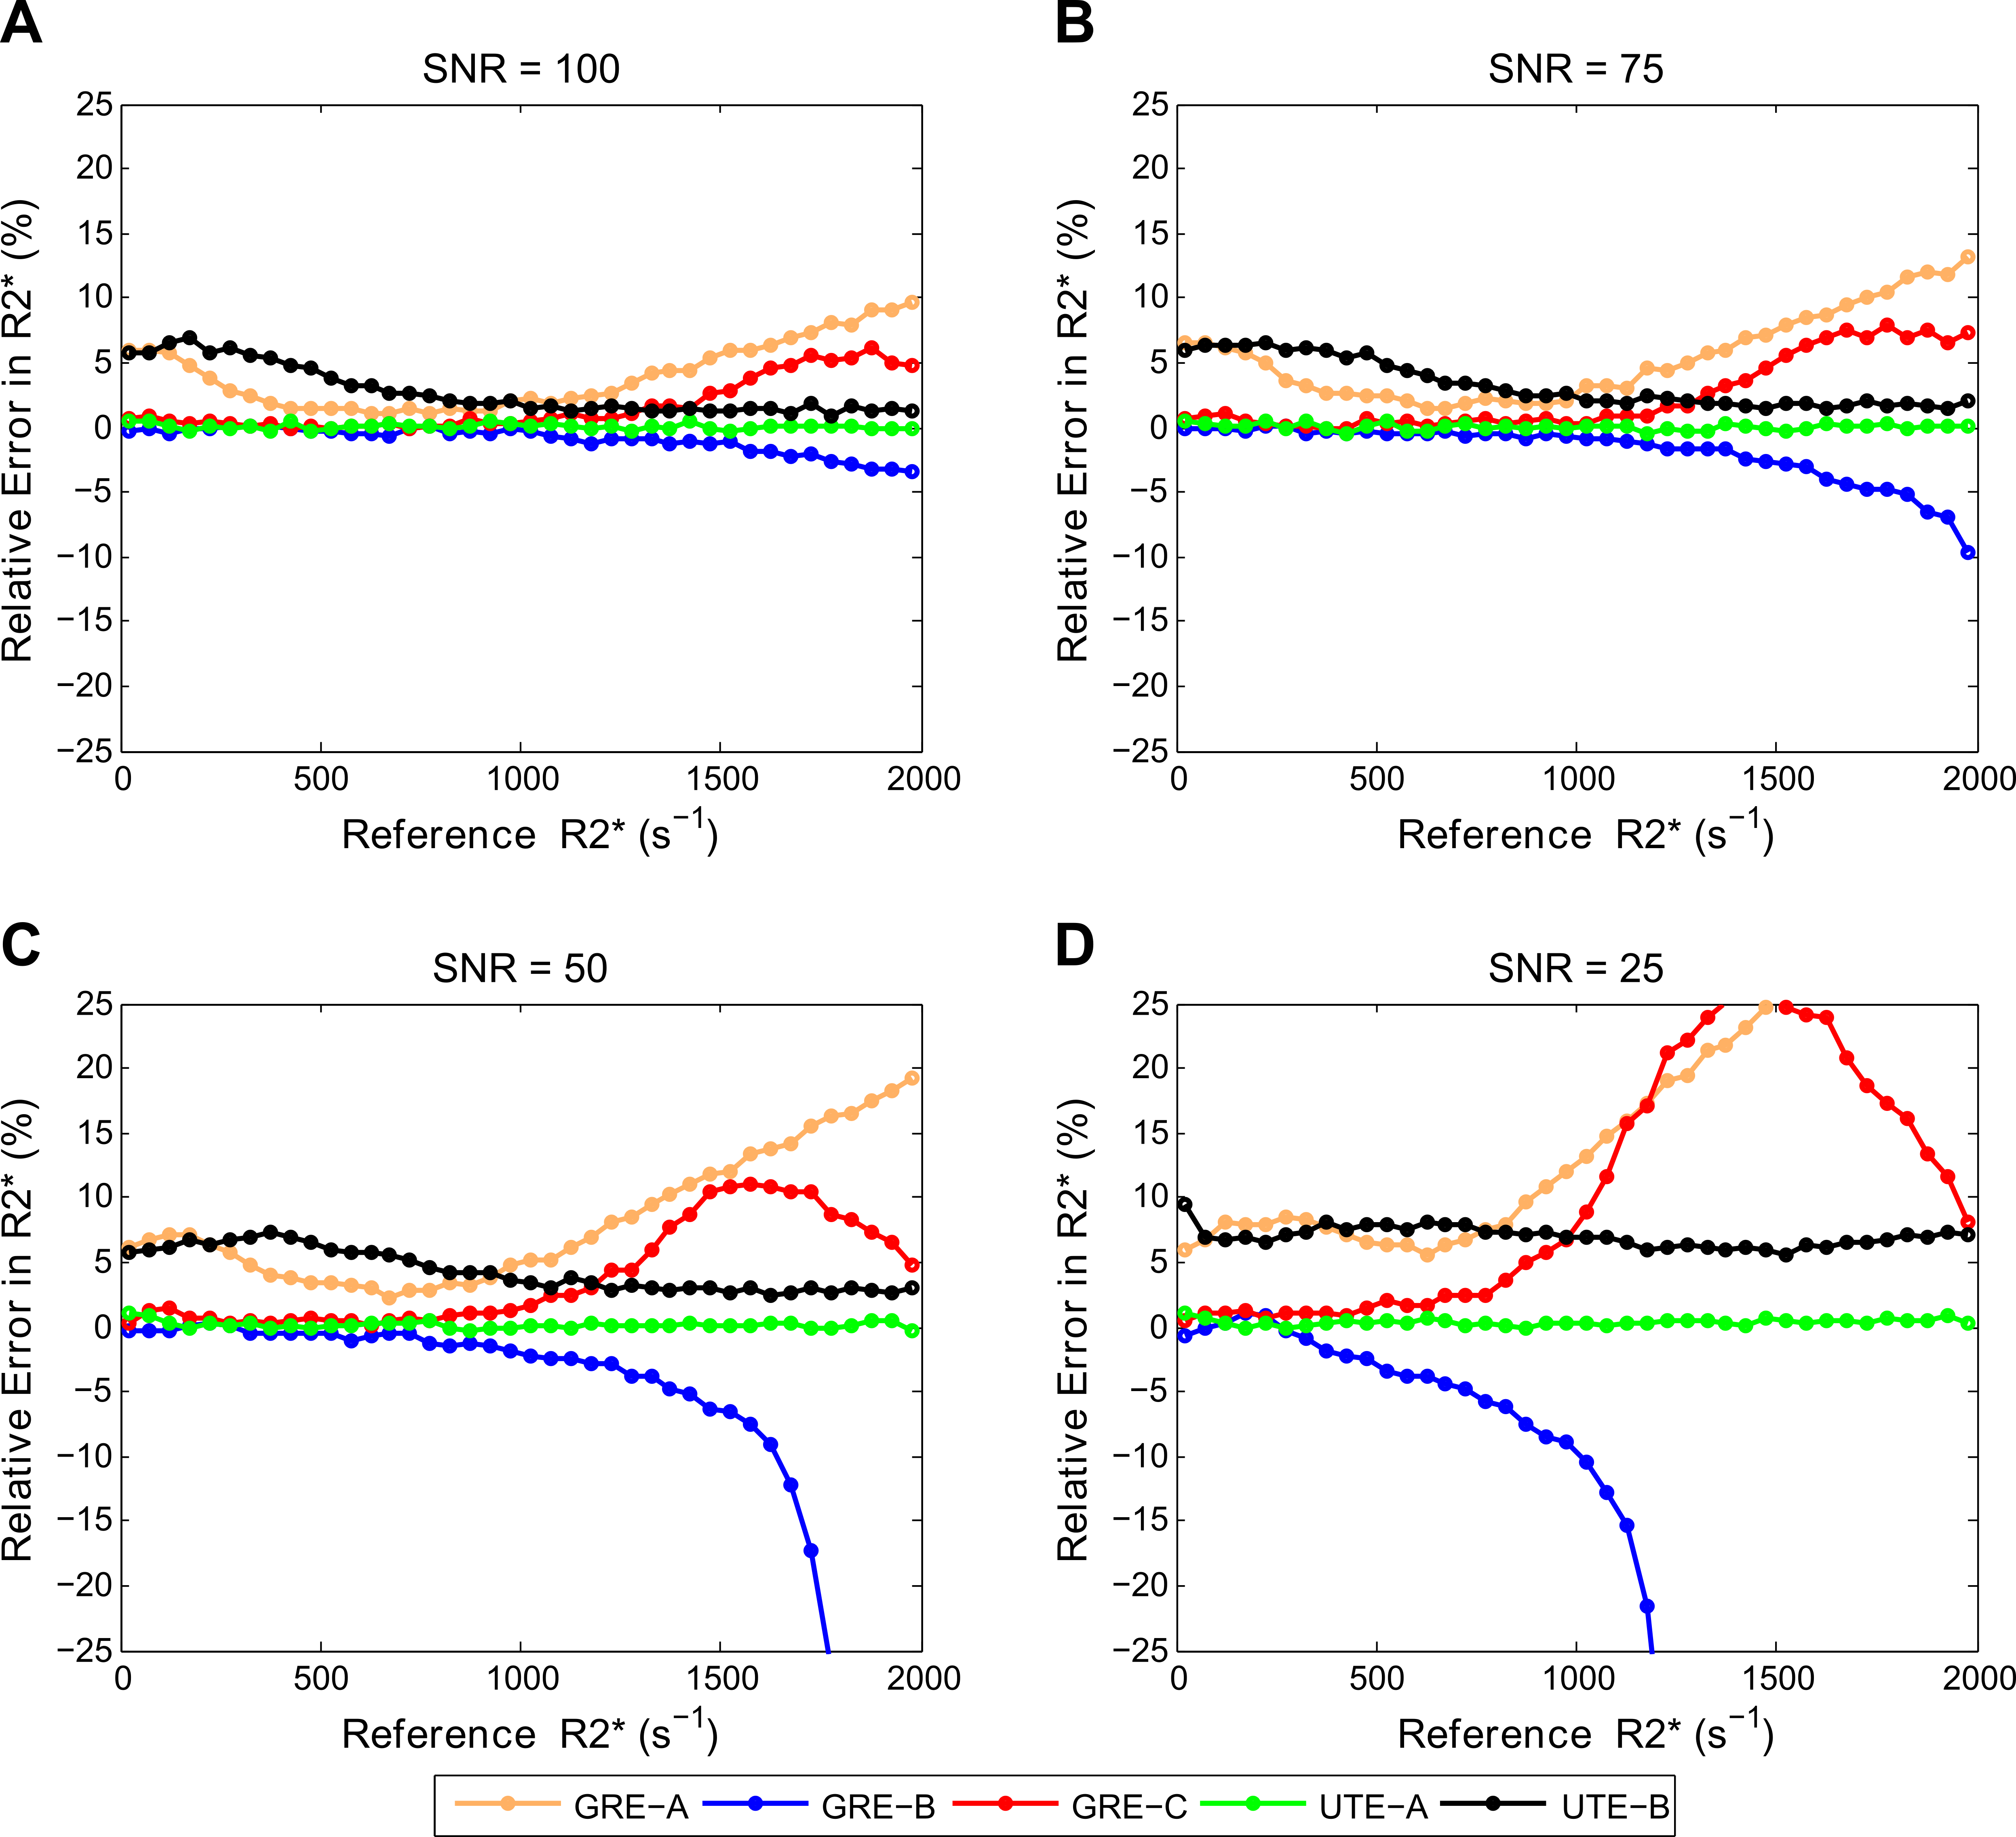
The precision calculations for GRE acquisition methods, as expected, showed an increase in CoV for high R2* values (>1000s-1), with the exception of GRE-A as it used a relatively short TE1 and smaller ∆TEs compared to other GRE methods. However, GRE-A lacked images with long TE (TEmax=4.8ms) and hence showed low precision for low R2* values (<250s-1). In contrast, both UTE acquisitions showed high precision for high R2* (>1000s-1). UTE-A showed high precision at all R2* above 50s-1, whereas UTE-B showed an increase in CoV with decreasing R2*<1000s-1 because of a shorter TEmax. Figure 2 displays the accuracy of the reported acquisition methods using their respective fit models. GRE-A and GRE-C models overestimated while GRE-B underestimated for high R2* values, with under/overestimation increasing with decreasing SNR. UTE-A showed high accuracy over the entire R2* range for all SNRs whereas UTE-B was accurate only for high R2* and SNR.
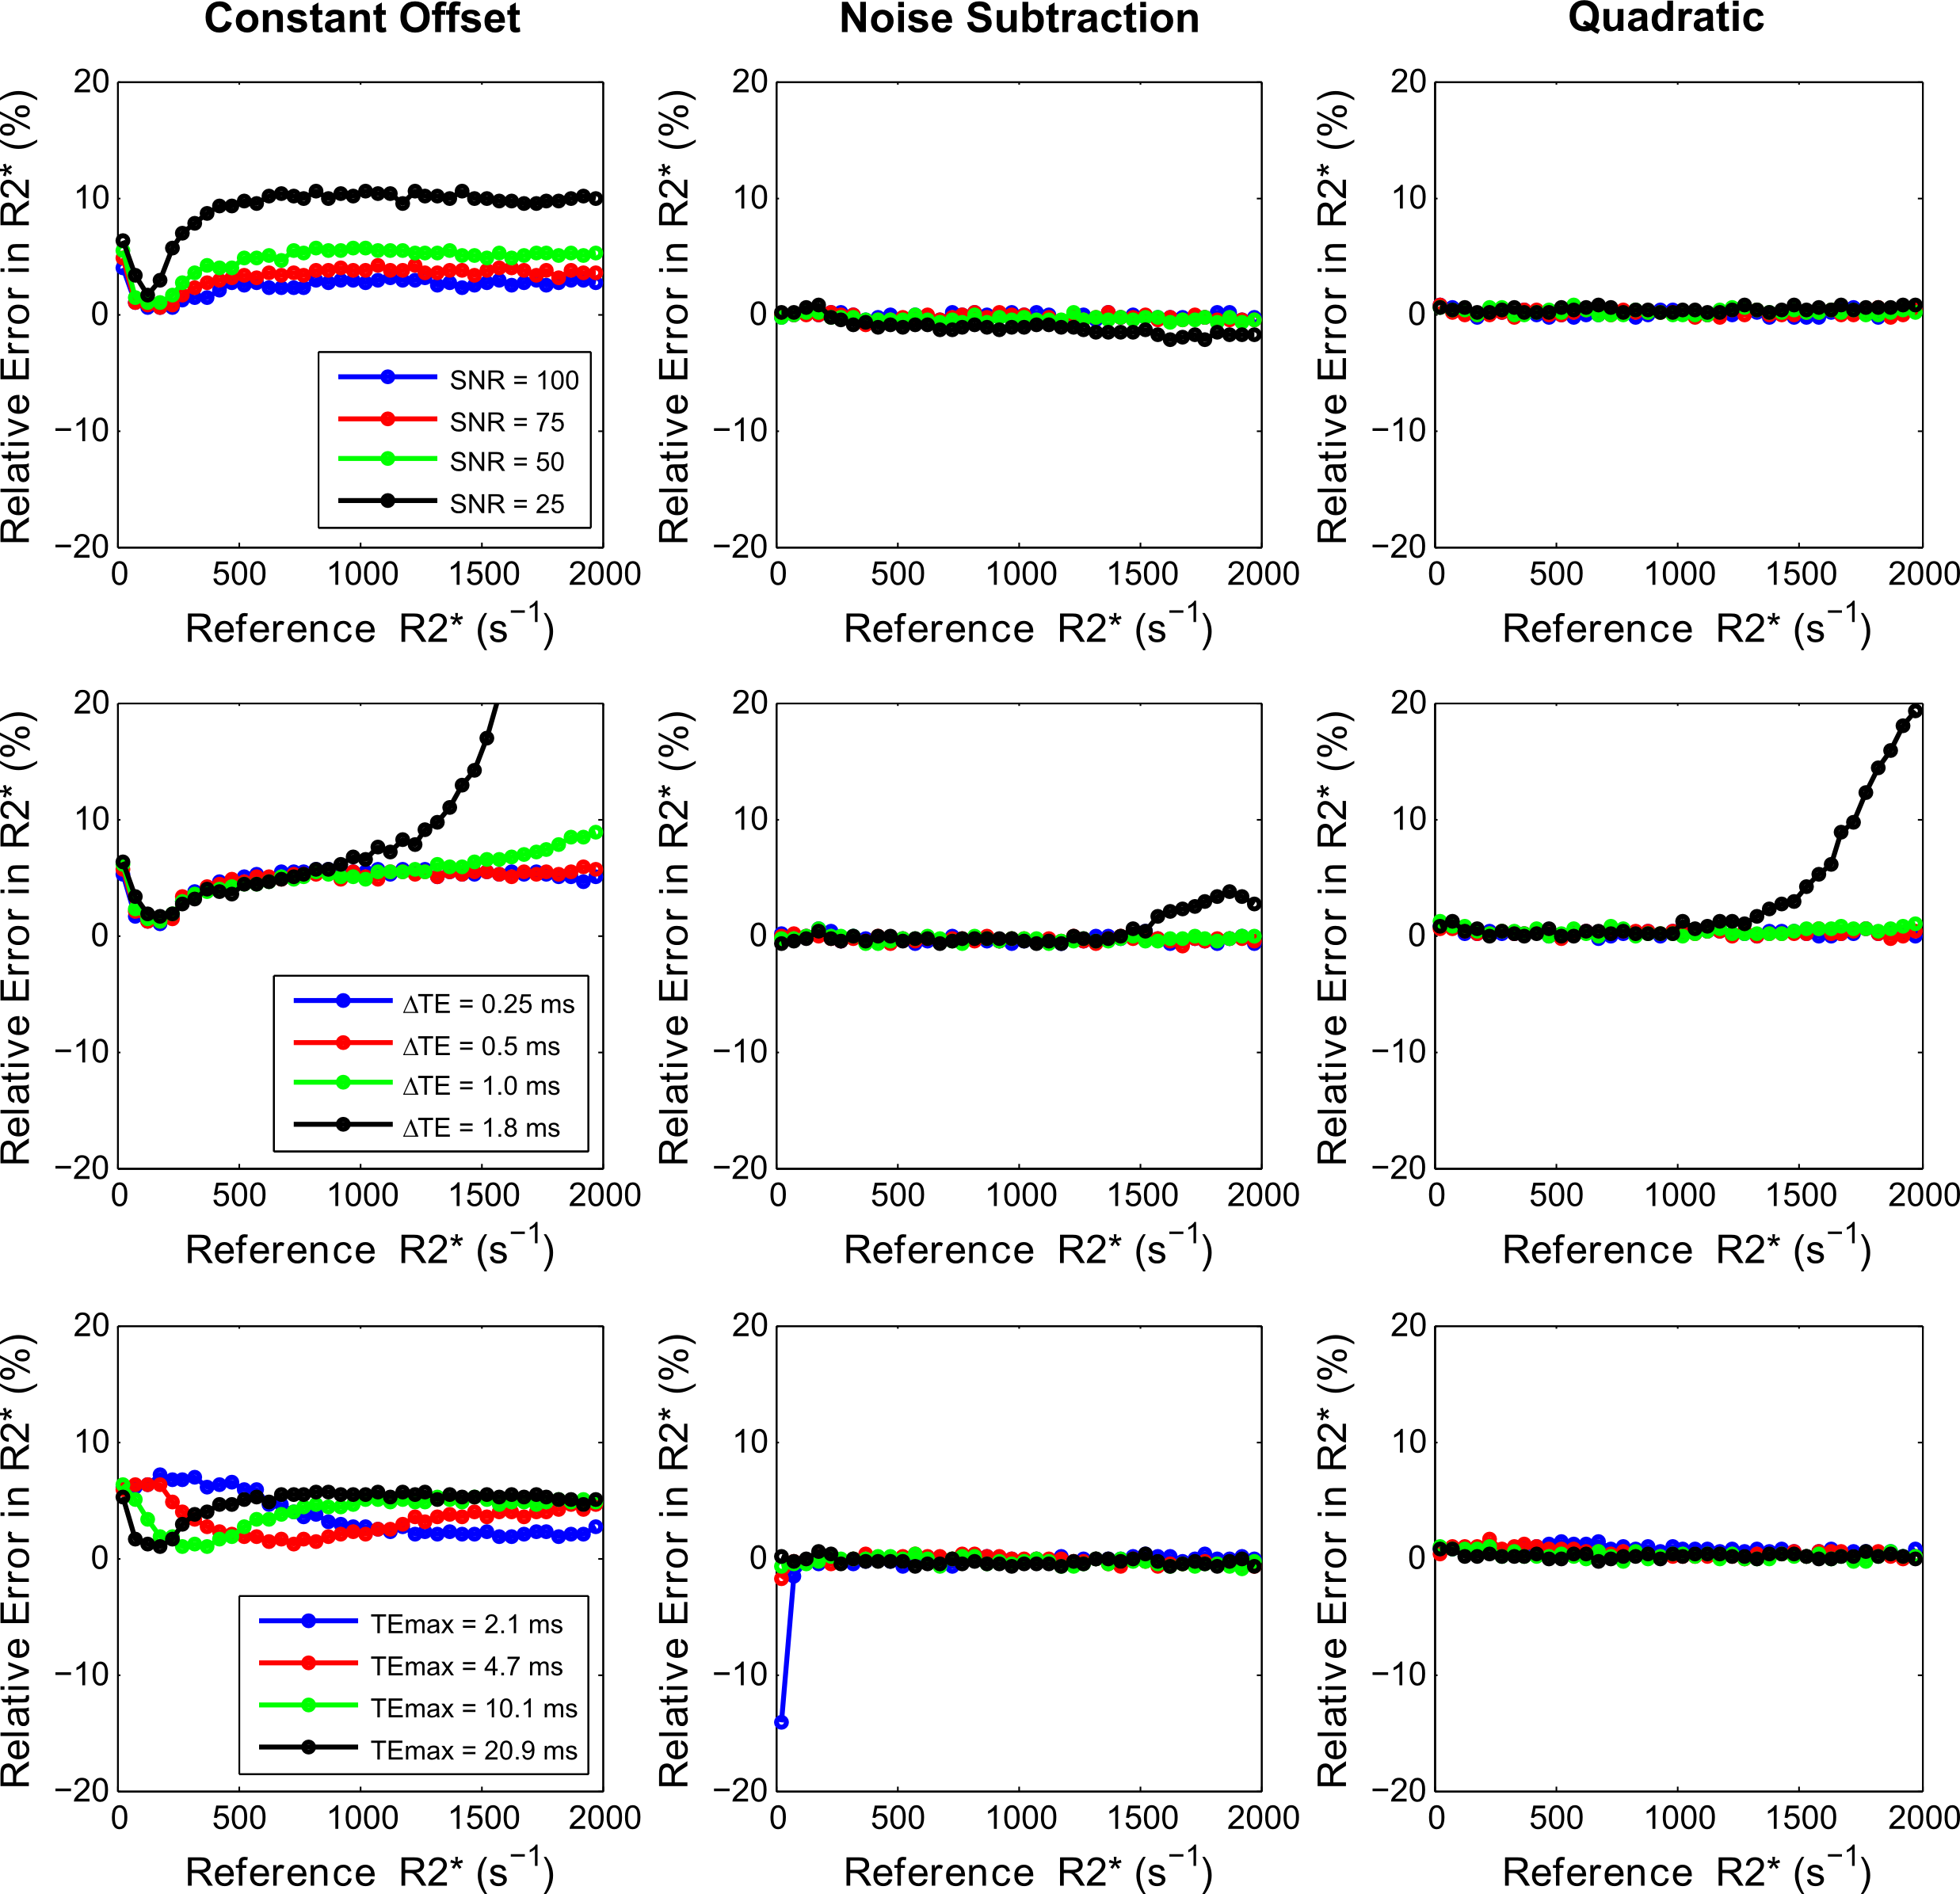
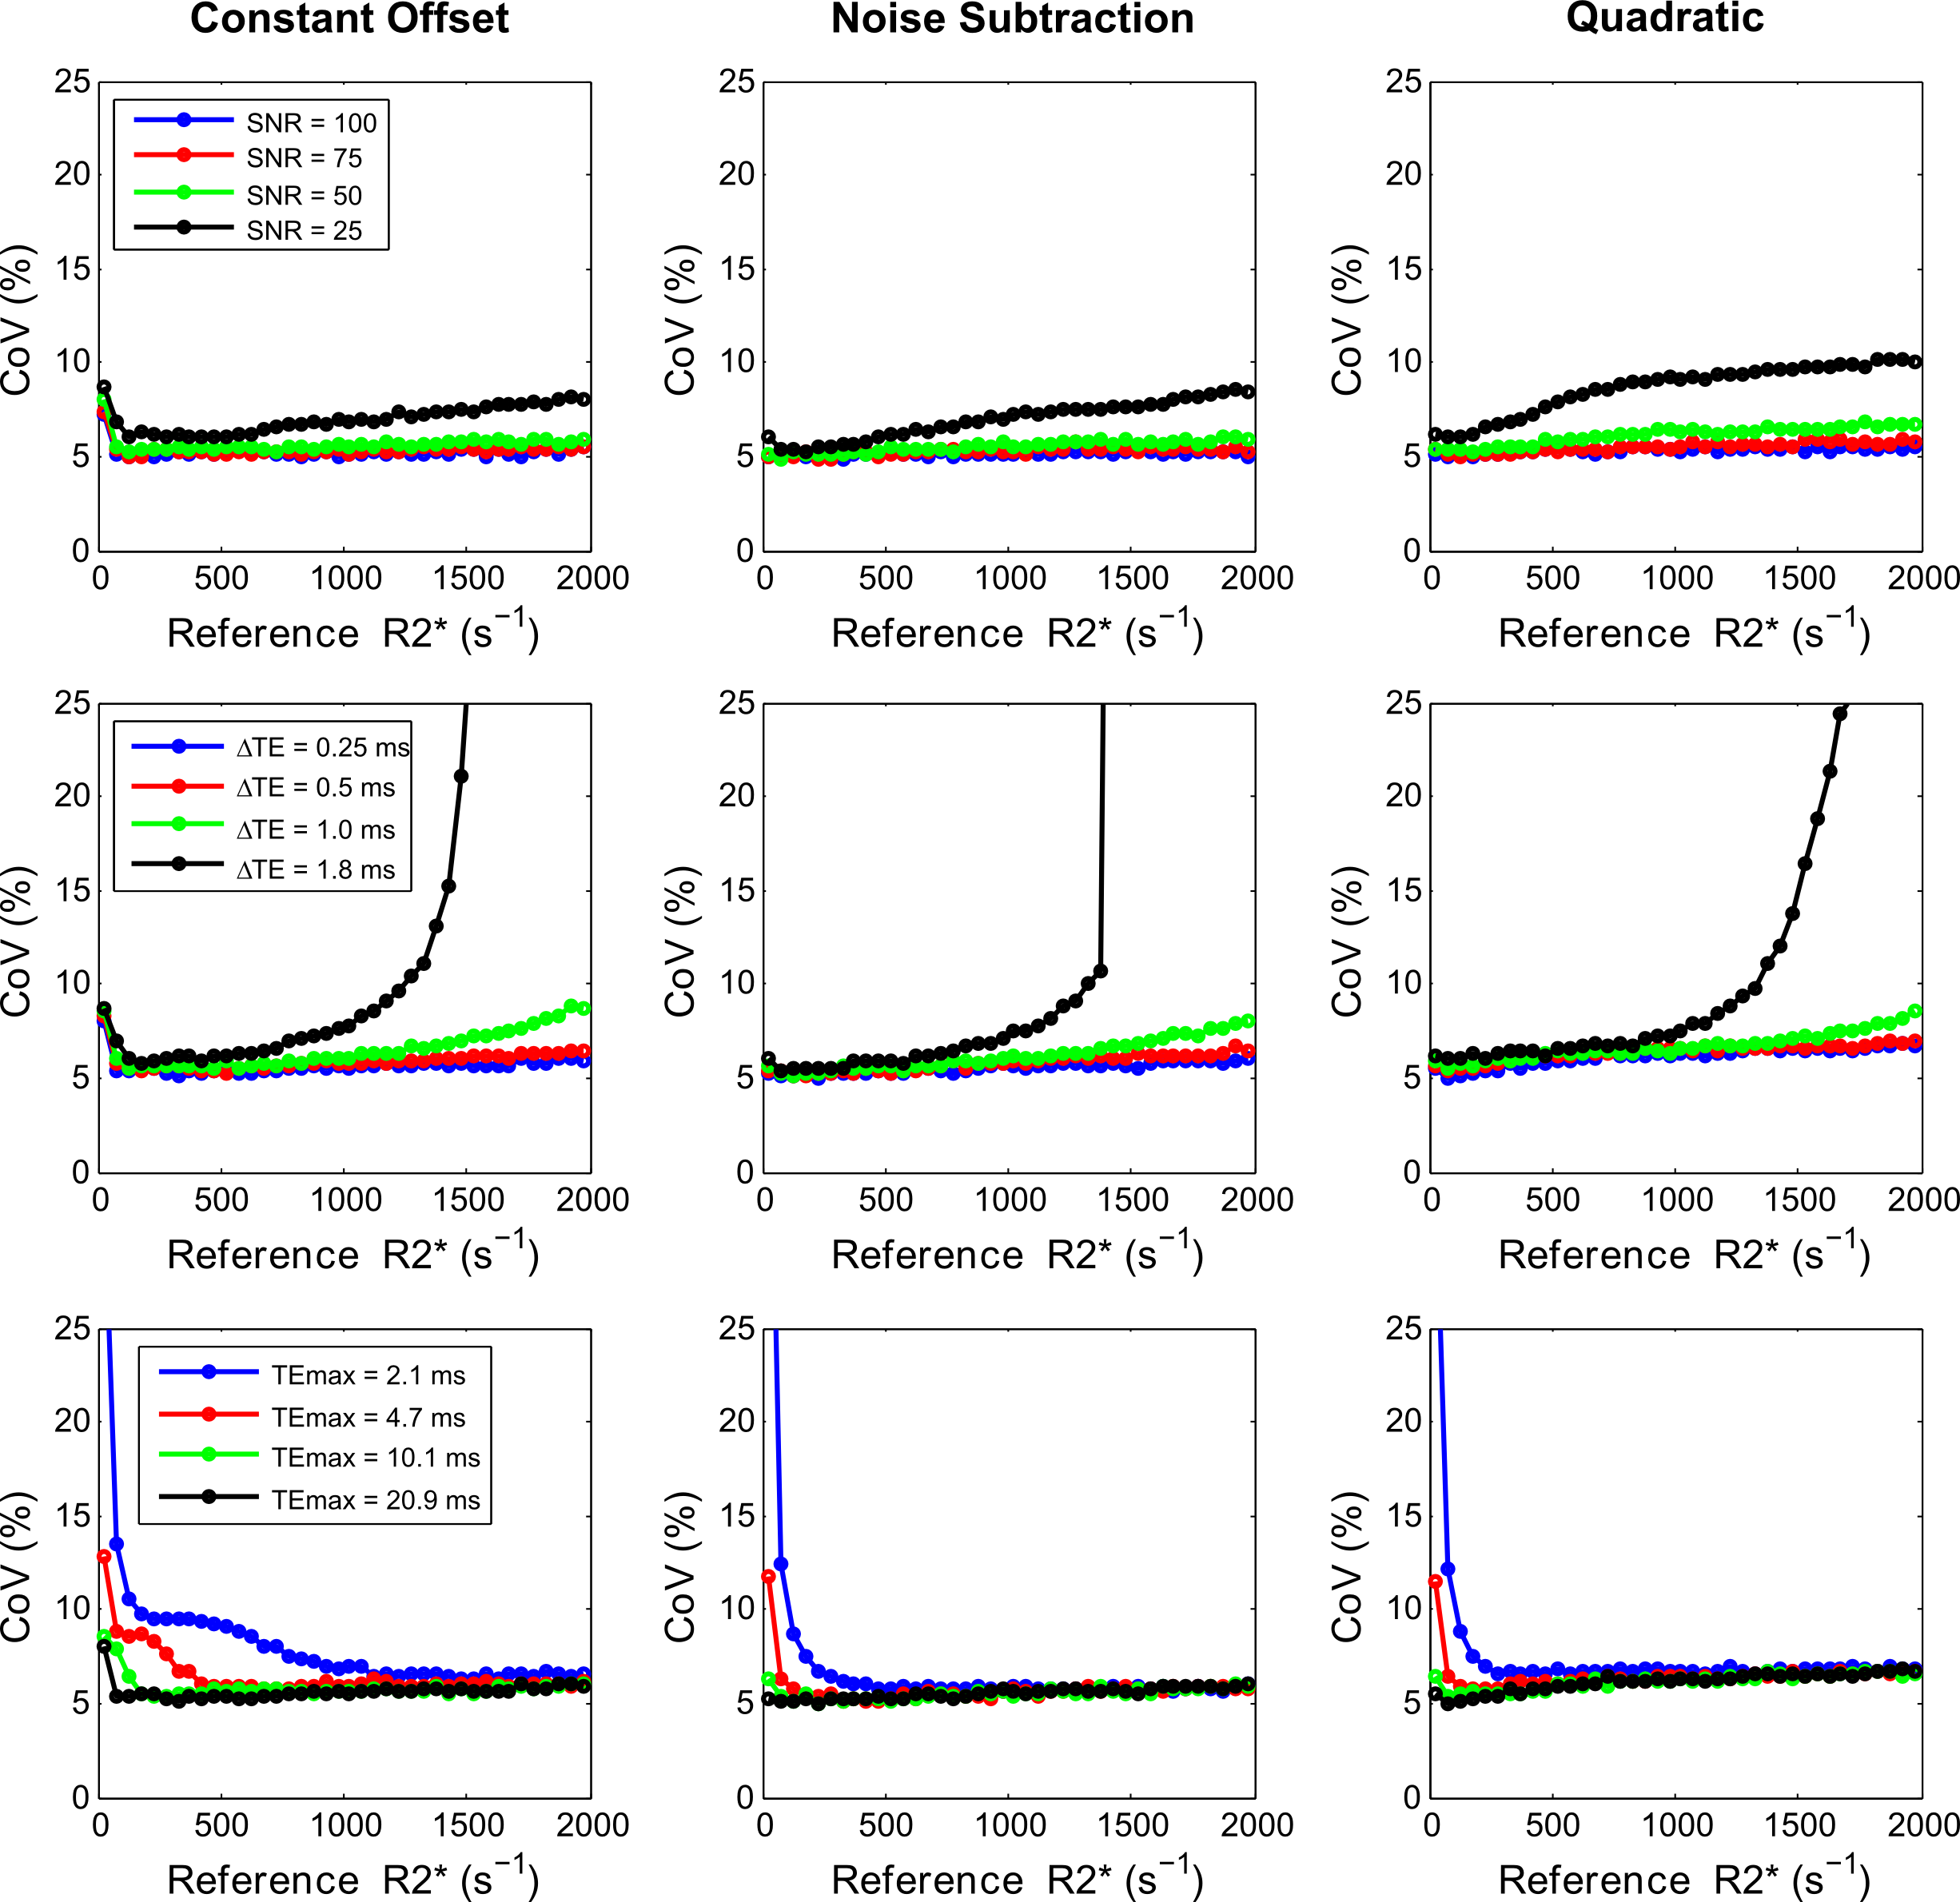
Figures 3 and 4 show accuracy and precision calculations of fitting models for varying UTE acquisition parameters using UTE-A as reference. The noise subtraction and quadratic models showed high accuracy and precision for all SNRs except that the CoV (>5%) increased for the lowest SNR. In contrast, the constant offset model slightly overestimated for high SNRs (≥75) but the overestimation increased to ~10% for the lowest SNR. All fitting models produced similar accuracy and precision for smaller ∆TEs (0.25, 0.5ms), however accuracy and precision became worse for high R2* values using larger ∆TEs (≥1ms). For the noise subtraction and quadratic models, decreasing TEmax did not affect the accuracy in R2* estimates but increased the CoV for lower R2* (<500s-1). The effect of TEmax on the constant offset model seem to be different; for shorter TEmax there is R2* overestimation and high CoV in the low R2*-range, and for longer TEmax there is overestimation in high R2*-range.
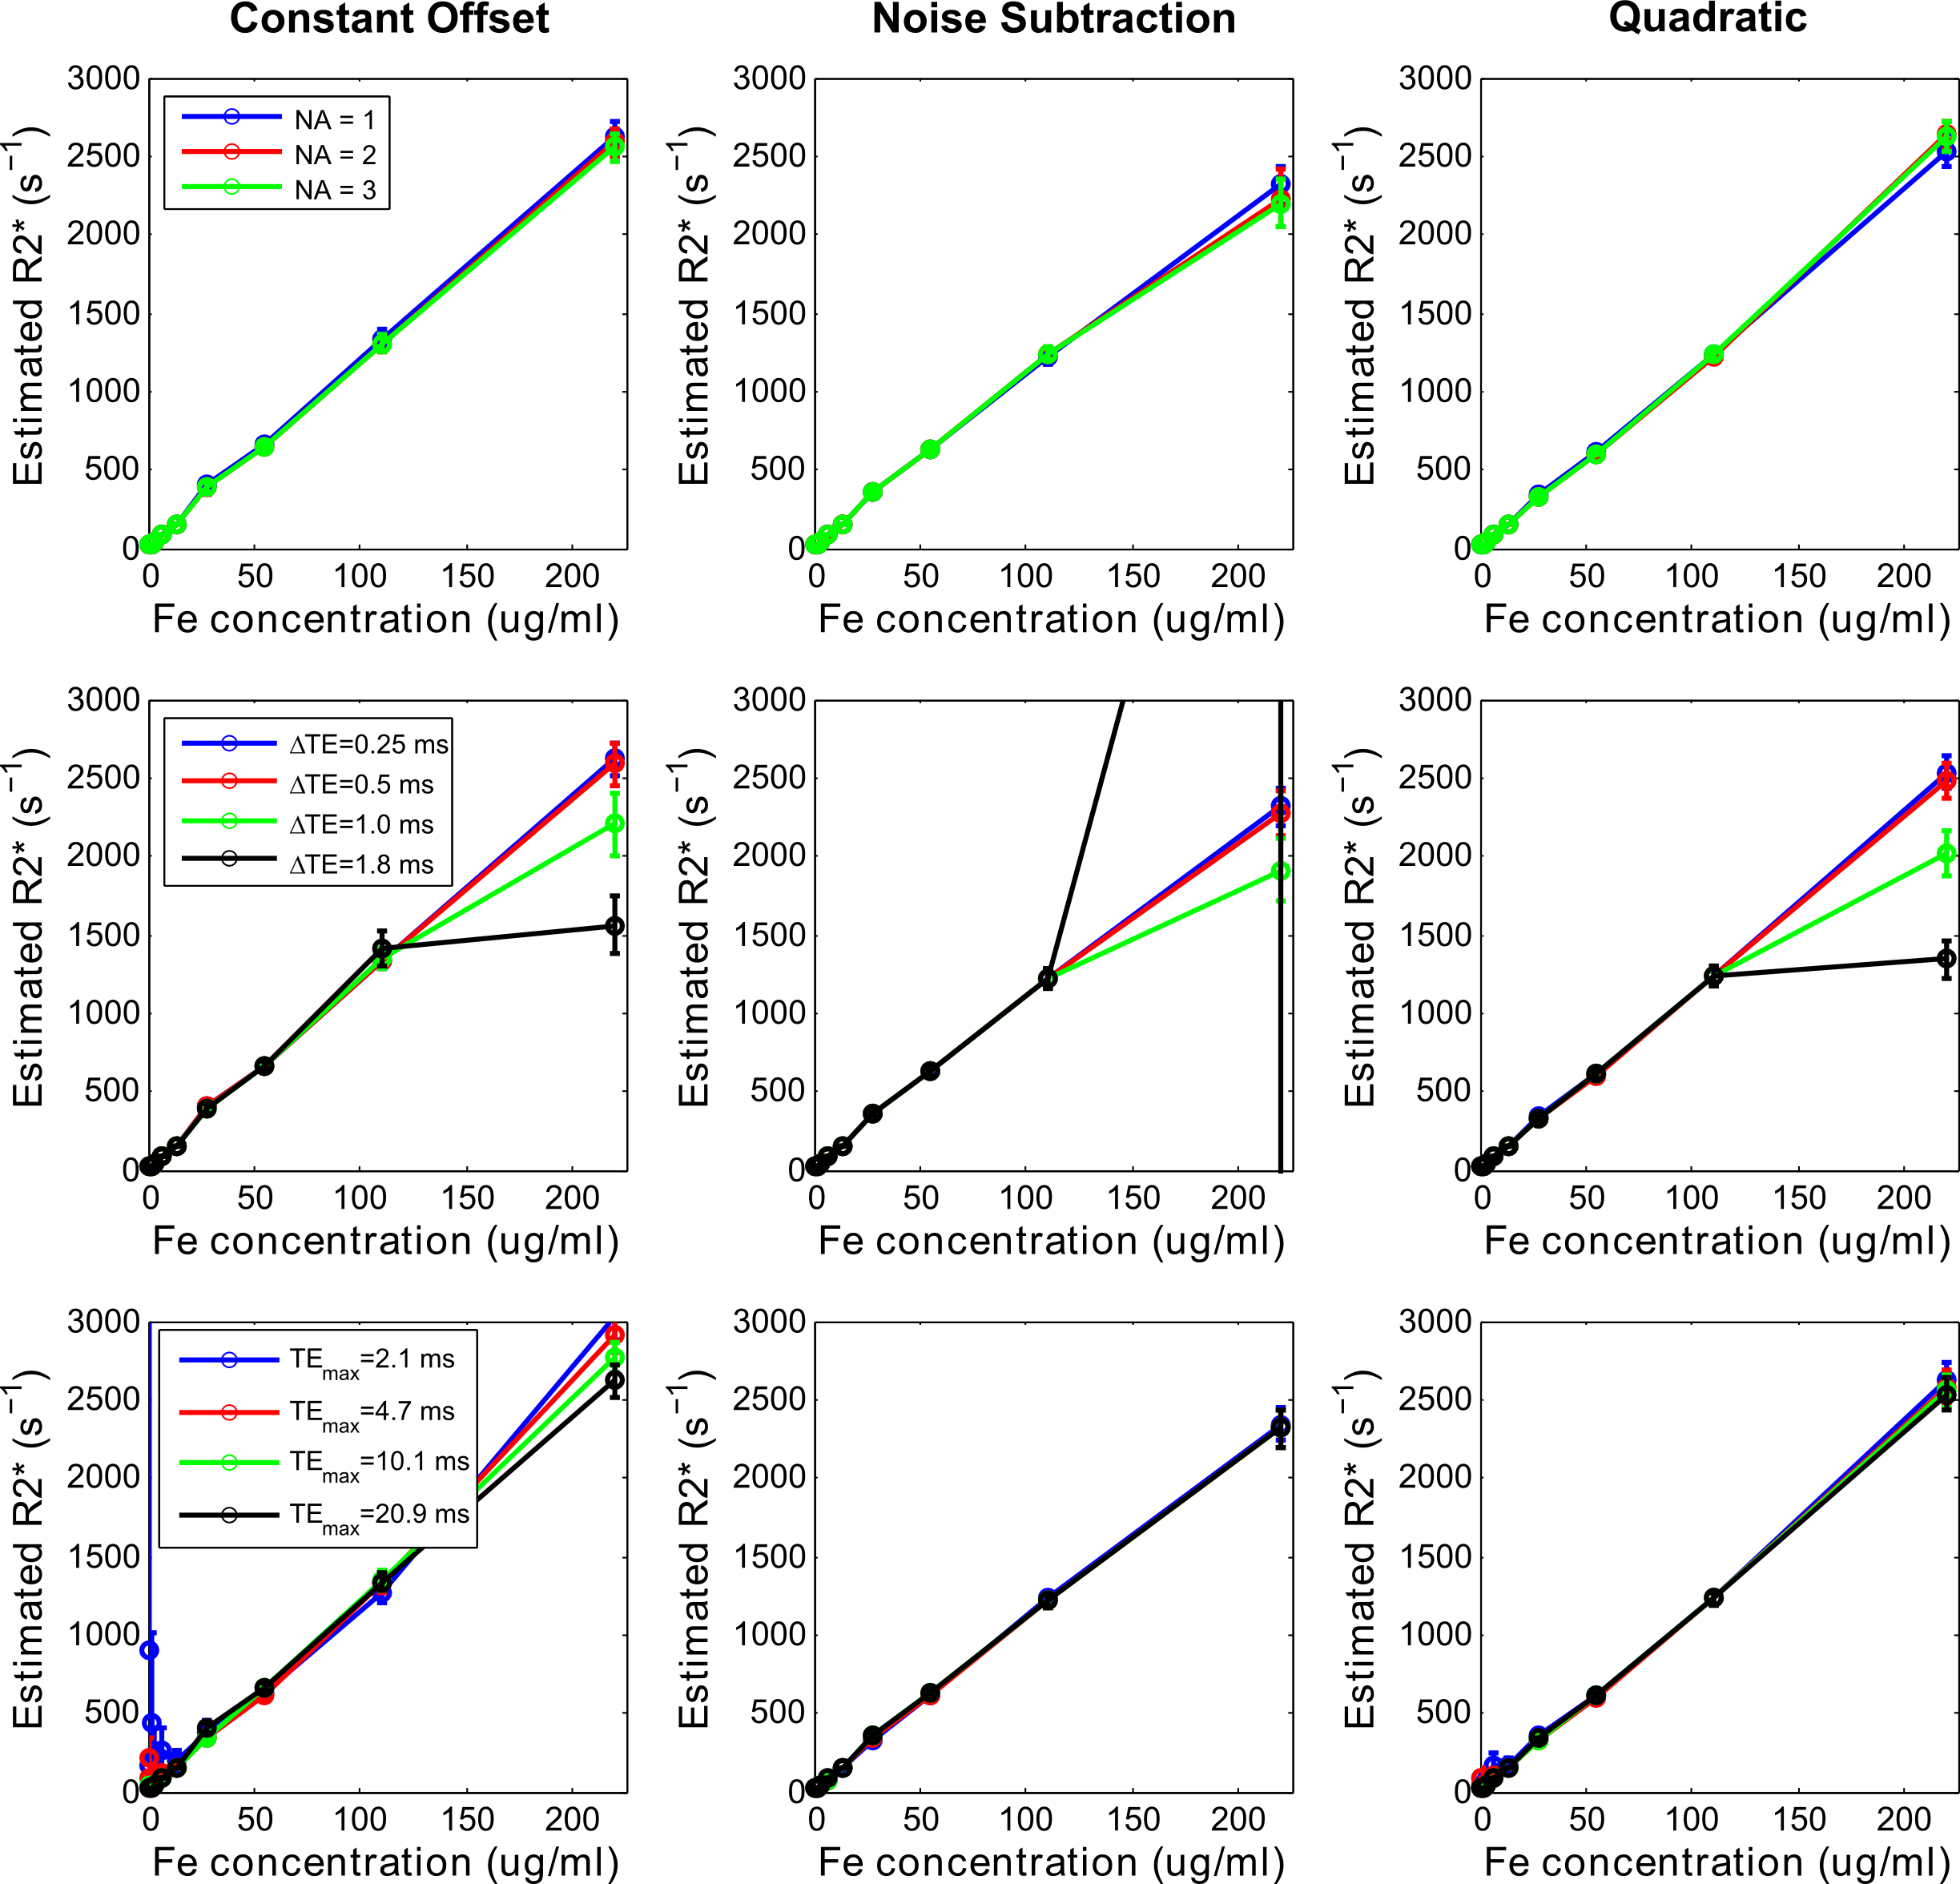
In phantoms, all fitting models produced similar R2* results for different NA and smaller ∆TEs. Using larger ∆TEs (≥1ms), the models caused R2* deviations for the highest iron concentration. Using shorter or longer TEmax produced similar R2* results for the noise subtraction model for all iron concentrations. However, using shorter TEmax produced R2* overestimation and high standard deviations for both quadratic and constant offset models for low iron concentrations; the results being much worse for the constant offset.
Conclusion
In summary, via simulations and phantom experiments, UTE with longer TEmax and a minimum ∆TE of 0.5ms might be the best acquisition method for providing accurate results over the entire clinical range of hepatic iron overload. Further, the choice of UTE acquisition parameters and its influence on fitting models for R2* estimation should be thoroughly investigated to make the right model selection for clinical use.Acknowledgements
No acknowledgement found.References
1. Krafft
AJ, Loeffler RB, Song R, et al. Quantitative ultrashort echo time imaging for
assessment of massive iron overload at 1.5 and 3 Tesla. Magn Reson Med. 2017; 78: 1839-51.
2. Doyle EK, Toy K, Valdez B, et
al. Ultra-short echo time images quantify high liver iron. Magn Reson Med. epub 2017.
3. Weins CN, Zhu A, Johnson KM, et
al. Accuracy and Reproducibility of Iron Quantification using Ultra-Short TE
Imaging at 1.5T and 3.0T. International
Society for Magnetic Resonance in Medicine. Honolulu, Hawaii 2017.
4. Tipirneni-Sajja A, Krafft AJ,
McCarville MB, et al. Radial Ultrashort TE Imaging Removes the Need for
Breath-Holding in Hepatic Iron Overload Quantification by R2* MRI. AJR Am J Roentgenol. 2017; 209: 187-94.
5. Wood JC, Enriquez C, Ghugre N,
et al. MRI R2 and R2* mapping accurately estimates hepatic iron concentration
in transfusion-dependent thalassemia and sickle cell disease patients. Blood. 2005; 106: 1460-5.
6. Hankins JS, McCarville MB,
Loeffler RB, et al. R2* magnetic resonance imaging of the liver in patients
with iron overload. Blood. 2009; 113:
4853-5.
7. Feng Y, He T, Gatehouse PD, et
al. Improved MRI R2 * relaxometry of iron-loaded liver with noise correction. Magn Reson Med. 2013; 70: 1765-74.
Figures