2602
Comparison of Hepatic Quantitative Susceptibility Mapping and R2* for Iron Measurement in Presence of Fat and Fibrosis; an Ex-Vivo StudyRamin Jafari1, Anne Koehne de Gonzalez2, Yi Wang1,3, Thanh Nguyen 3, Alexey Dimov1, Kofi Mawuli Deh3, Zhe Liu1, Gary Brittenham2, Martin Prince3, and Pascal Spincemaille3
1Cornell University, Ithaca, NY, United States, 2Columbia University Medical Center, New York, NY, United States, 3Weill Cornell Medicine, New York, NY, United States
Synopsis
Precise measurement of liver iron content (LIC) in patients with transfusional iron overload is important in iron-chelation therapy. MRI can be used as a non-invasive method to measure iron levels in the liver. Typically, R2 and R2* based methods are used for this purpose. In this work, we use human liver explants to demonstrate the degree to which steatosis and fibrosis are confounding factors for R2* and quantitative susceptibility mapping in LIC measurement.
INTRODUCTION
The ability to accurately measure liver iron content (LIC) is important for optimal chelation treatment in patients with transfusional iron overload. MRI R2 and R2* are typically used to estimate LIC, although suffer from errors and variability. Reasons for this variability include the presence of fibrosis and steatosis. An emerging technique for LIC measurement is quantitative susceptibility mapping. In this study, we present preliminary results using human liver explant MRI showing the degree to which fibrosis and steatosis affect R2* and QSM.METHODS
Histology and MR imaging was performed on 4 livers from patients with liver failure and different grades of fibrosis, steatosis and iron levels. Sections of the liver were cut, stained, and semi-quantitative grades of steatosis, fibrosis, and iron level were obtained. These sections were first fixed in formalin, then inserted together with a water balloon into a cylindrical agarose phantom, and imaged on a 3T scanner (GE MR750) using 3D gradient echo (GRE) with imaging parameters 0.6 mm3 isotropic resolution, 16 echoes with TE1= 1.8 ms and 1.5 ms echo spacing. For one case with high iron level, the 4 echoes with 0.75 ms echo spacing were acquired. Water, fat, R2* and proton density fat fraction (PDFF) maps were obtained using IDEAL (1) initialized using SPURS (2). Simultaneous background removal and local field estimation was performed using preconditioned total field inversion (TFI) (3) for susceptibility mapping. QSM values were normalized with reference to the water balloon. The susceptibility contribution from fat was removed from the susceptibility map as well (4). To compare values within a region, ROI analysis was performed by drawing an ROI within the largest homogenous region of the explant and the mean values of PDFF, QSM, and R2* were calculated.RESULTS
Table 1 compares histology results with the MRI measurements. Grade 0 steatosis corresponded to PDFF between 1.6% to 3.4%, while grade 1 steatosis corresponded to a higher 12% PDFF showing agreement. Iron grades varied from 1-3 and both R2* and QSM show sensitivity to increase in iron levels. R2* ranged between 21 Hz to 857 Hz for iron grades between 1 to 3 while QSM values range between -0.004 to 0.616 ppm. Figure 1 shows magnitude, water, fat, PDFF (%), QSM (ppm) and R2* (Hz) maps that were used in the ROI-analysis. Liver explants 1 and 2 were marked as grade 0 for both iron and fibrosis and show a relatively homogeneous signal (ignoring the areas with excess formalin appearing bright on R2*) on both QSM and R2*. Liver explant 3 was marked as grade 3 fibrosis with centrilobular perisinusoidal bridging. White markers indicate spatial variation in R2* (by as much as 20%) while the corresponding variation in QSM is limited. Liver explant 4 has significant iron content clearly seen as significant high signal on both QSM and R2* around the metastasis seen as the bright region in the magnitude image.DISCUSSION
This study demonstrated that both QSM and R2* methods are sensitive to iron level changes. However, R2* values depend on intravoxel contents in a nonlinear fashion (5,6) compared to the linear relationship between QSM and iron content. The data presented here also suggest R2* is more affected by fibrosis/cirrhosis than QSM. This study was limited to a few samples and more are required for definitive analysis. Quantitative analysis such as spectrophotometry method compared to histology will provide absolute LIC measurement, allowing more accurate comparison with QSM and R2*.CONCLUSION
While QSM and R2* methods are both sensitive to iron changes, fibrosis may be a more significant confounding factor for R2*.Acknowledgements
No acknowledgement found.References
1. Reeder SB, McKenzie CA, Pineda AR, Yu H, Shimakawa A, Brau AC, Hargreaves BA, Gold GE, Brittain JH. Water-fat separation with IDEAL gradient-echo imaging. J. Magn. Reson. Imaging 2007;25:644–652. doi: 10.1002/jmri.20831. 2. Dong J, Liu T, Chen F, Zhou D, Dimov A, Raj A, Cheng Q, Spincemaille P, Wang Y. Simultaneous phase unwrapping and removal of chemical shift (SPURS) using graph cuts: Application in quantitative susceptibility mapping. IEEE Trans. Med. Imaging 2015;34:531–540. doi: 10.1109/TMI.2014.2361764. 3. Liu Z, Kee Y, Zhou D, Wang Y, Spincemaille P. Preconditioned total field inversion (TFI) method for quantitative susceptibility mapping. Magn. Reson. Med. 2017;78:303–315. doi: 10.1002/mrm.26331. 4. De Rochefort L, Brown R, Prince MR, Wang Y. Quantitative MR susceptibility mapping using piece-wise constant regularized inversion of the magnetic field. Magn. Reson. Med. 2008;60:1003–1009. doi: 10.1002/mrm.21710. 5. Yablonskiy DA, Sukstanskii AL, He X. Blood oxygenation level-dependent (BOLD)-based techniques for the quantification of brain hemodynamic and metabolic properties - theoretical models and experimental approaches. NMR Biomed. 2013;26:963–986. doi: 10.1002/nbm.2839. 6. Jensen JH, Chandra R. Theory of nonexponential NMR signal decay in liver with iron overload or superparamagnetic iron oxide particles. Magn. Reson. Med. 2002;47:1131–1138. doi: 10.1002/mrm.10170.Figures
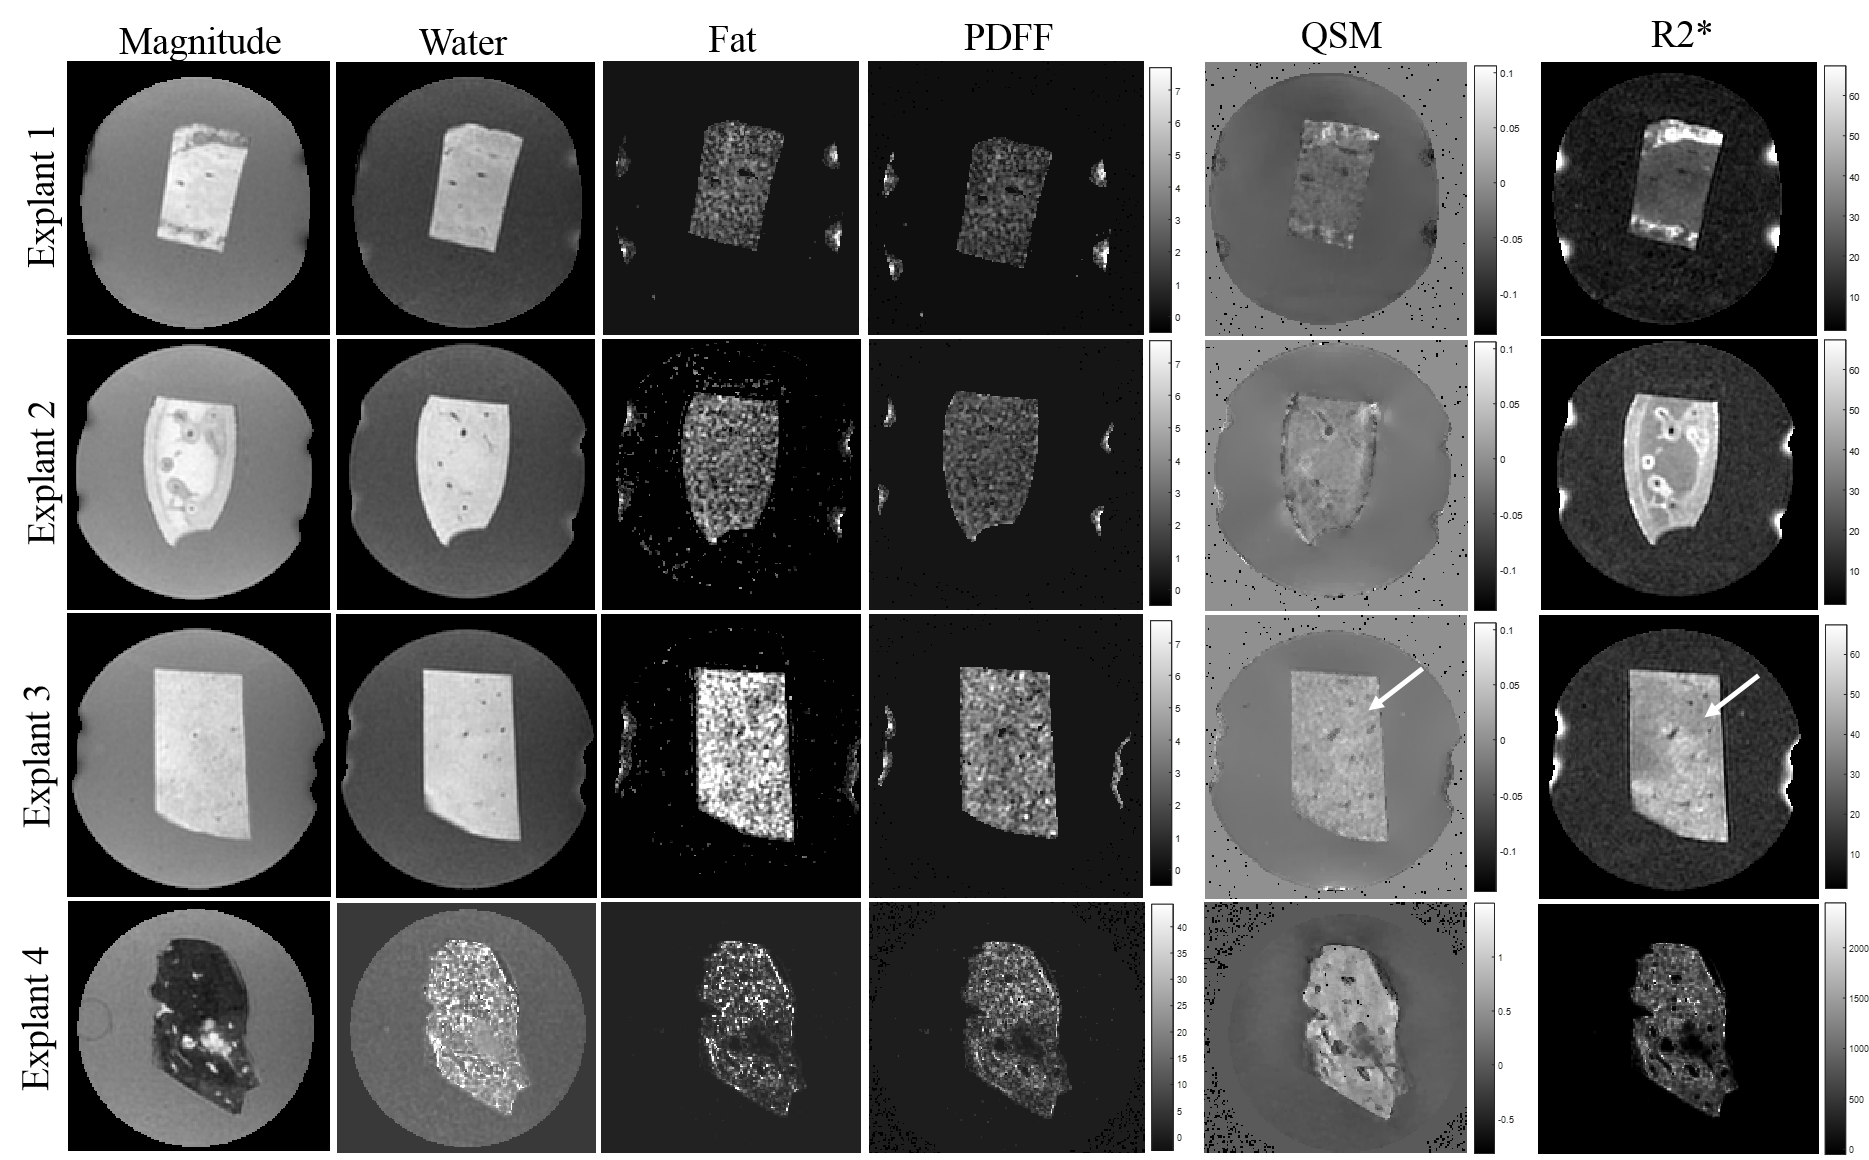
Figure 1: Image intensity, water, fat, proton density fat fraction (%), QSM (ppm), and R2* (Hz) maps for 4 liver explants are shown. In the third row the field-inhomogeneity corrected R2* for a liver explant with grade 3 fibrosis shows a nonuniform map while the QSM provides a uniform map.

Table 1: Comparison of histology
analysis and MR measurement in 4 human liver explants with different degrees of
steatosis, fibrosis, and iron level.