2601
Gradient-Echo MRI for Liver Iron Content Determination employing R2* Relaxometry: Influence of Gender and Disease1Diagnostic and Interventional Radiology, University Ulm, Medical Center, Ulm, Germany, 2Section for Experimental Radiology, University Ulm, Medical Center, Ulm, Germany, 3Department of Pediatrics and Adolescent Medicine, University Ulm, Medical Center, Ulm, Germany
Synopsis
To investigate the relation between R2* gained from gradient echo (GRE) MRI and liver iron concentration (LIC), we studied the influence of patient characteristics. 205 patients (92 f, 113 m; 98 with Thalassemia major, 31 with Sickle Cell Anemia, 15 with Diamond-Blackfan-Anemia) suspected for liver iron overload were scanned according to Ferriscan® with spin echo MRI to obtain reference LIC values, and GRE protocols suitable for LIC determination. GRE analysis based on manually drawn liver ROIs and relaxometry yielded R2* values. Correlation analysis of R2* to reference LIC revealed different correlation parameters between patient subgroups concerning disease and gender.
Purpose
To investigate dependence of correlation between liver iron content (LIC) and R2* relaxometry involving breathhold gradient echo (GRE) protocols on patient characteristics, e.g., underlying disease.Methods
205 patients (92 female, 113 male, age range 2 to 75 years, mean ± SD: 23.3 ± 14.3 years) suspected for liver iron overload were investigated by 1.5 T MRI (Siemens Avanto, Siemens Healthineers, Iselin, NY). Transversal liver slices were acquired with multi-echo GRE using the whole-body resonator as receiver coil, with four flip angles (FA) of 20°, 30°, 50° and 90° at TR of 120 ms. At each flip angle, two sets of echo times (TE) were acquired: one with minimum TE and echo spacing of 1.19 ms, the other with min. TE and echo spacing of 1.59 ms. R2* and its uncertainty was determined by conjoint fit of all TE and FA. T1 effects for different FAs were considered, as well as signal modulation by fat/water-dephasing. Analysis was performed in manually placed liver ROIs free of vessels and/or artefacts using ROI median signal intensities. LIC reference values were obtained by the spin-echo (SE) MRI based Ferriscan® method.1 Patients were divided into three subgroups according to diseases: 1) Diamond-Blackfan-Anemia (DBA; 15 pts.), 2) Thalassemia major (98 pts.), and 3) Sickle Cell Anemia (SCA; 31 pts.). Linear correlation of R2* to reference LIC values was analyzed for all patients together, as well as separated by disease patterns and gender.Results
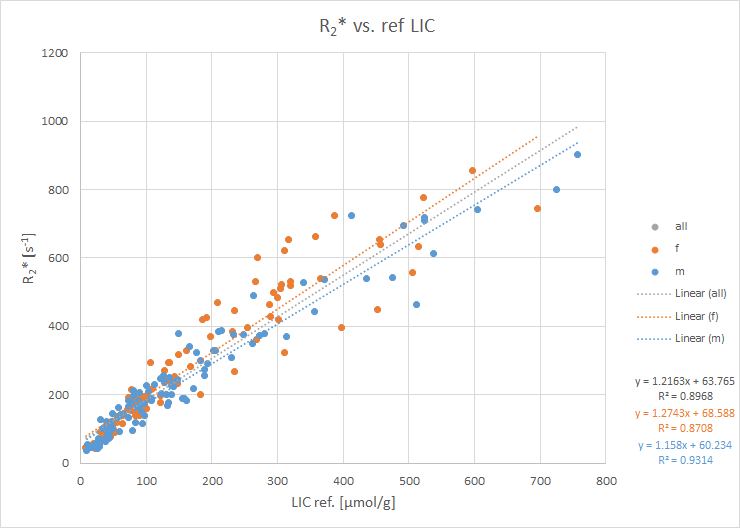
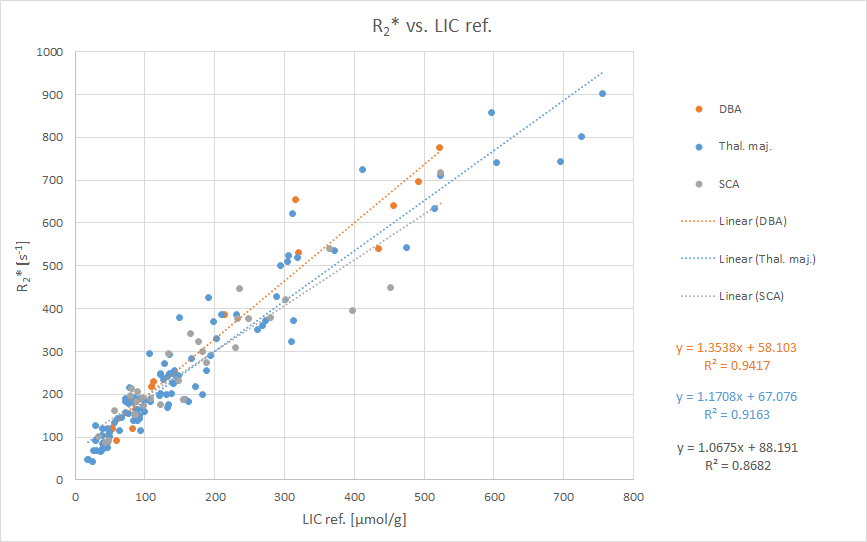
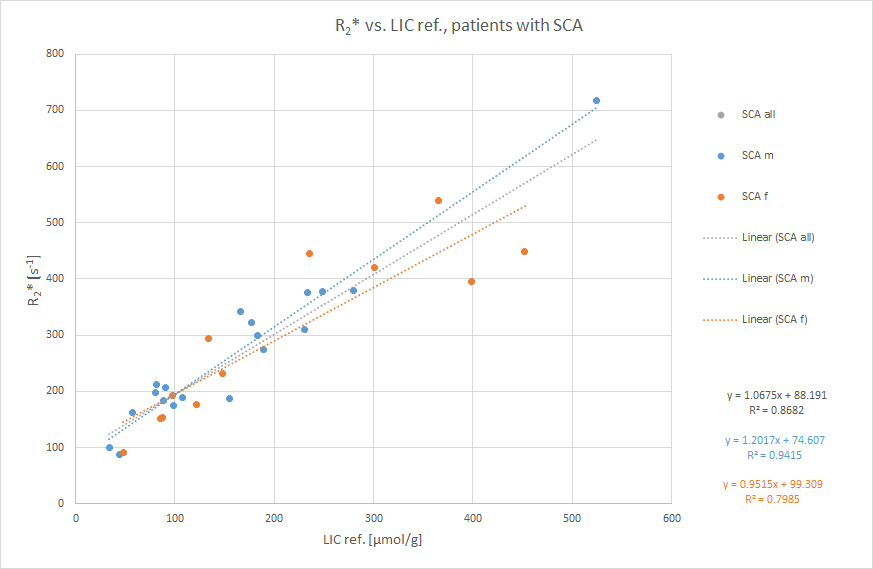
Linear correlation was good with coefficient of determination (R2) of 0.9 for all patients, yielding values for slope of 1.2 ± 0.03 g/(µmol*s) and intercept of 64 ± 7 s-1 (Fig. 1). No significant gender differences were found. For disease subgroups, cf. Fig. 2. Note that R2 was larger in subgroups than for all patients, except for SCA. The SCA group (12 females, 19 males) was further divided by gender, yielding R2 of 0.94, slope 1.2 ± 0.07 g/(µmol*s), and intercept 75 ± 14 s-1 for male patients, whereas females showed values of R2 = 0.8, slope 0.95 ± 0.15 g/(µmol*s), and intercept 99 ± 37 s-1 in this SCA subgroup.Conclusion
Correlation of R2* and reference LIC depended on disease pattern, in the SCA subgroup also on gender. It remains unclear whether deviations are caused a) by certain signal characteristics of SE MRI, which our reference method relies on, versus GRE, or b) by different analysis procedures – voxel-by-voxel for SE vs. involving ROI median signal intensity values for GRE. Anyway, R2*/R2 relaxometry based on GRE and SE sequences is sensitive not only to LIC, but also confounding effects, e.g. iron aggregation.2Clinical relevance
Underlying disease should be considered in GRE based MRI studies attempting to determine LIC involving R2* relaxometry.Acknowledgements
No acknowledgement found.References
1. St Pierre TG, Clark PR, Chua-anusorn W et al. Noninvasive measurement and imaging of liver iron concentrations using proton magnetic resonance. Blood. 2005;105(2):855-61
2. Jensen JH, Tang H, Tosti CL et al. Separate MRI quantification of dispersed (ferritin-like) and aggregated (hemosiderin-like) storage iron. Magn Reson Med. 2010;63(5):1201-09
Figures