2600
Noise-corrected R2* estimation using 3D multi-gradient-echo Dixon for hepatic iron overload: Comparisons with 2D multi-gradient-echo sequences1Ruijin Hospital, Shanghai Jiaotong University School of Medicine, Shanghai, China, 2MR Application Predevelopment, Siemens Healthcare, Erlangen, Germany, 3Application Development, Siemens Shenzhen Magnetic Resonance Ltd., Shanghai, China
Synopsis
Different combinations of acquisition and postprocessing for R2* estimation were compared: 3D multi-gradient-echo Dixon vs. 2D multi-gradient-echo, with/without fat saturation (FS); noise-corrected (NC) vs. fat-and-noise-corrected (FNC) fitting. Twenty patients suspected of hepatic iron overload, but not having steatosis, were included. 3D_NC_R2* showed excellent agreement with 2D_NC_R2*. Up to medium R2*, this
Introduction
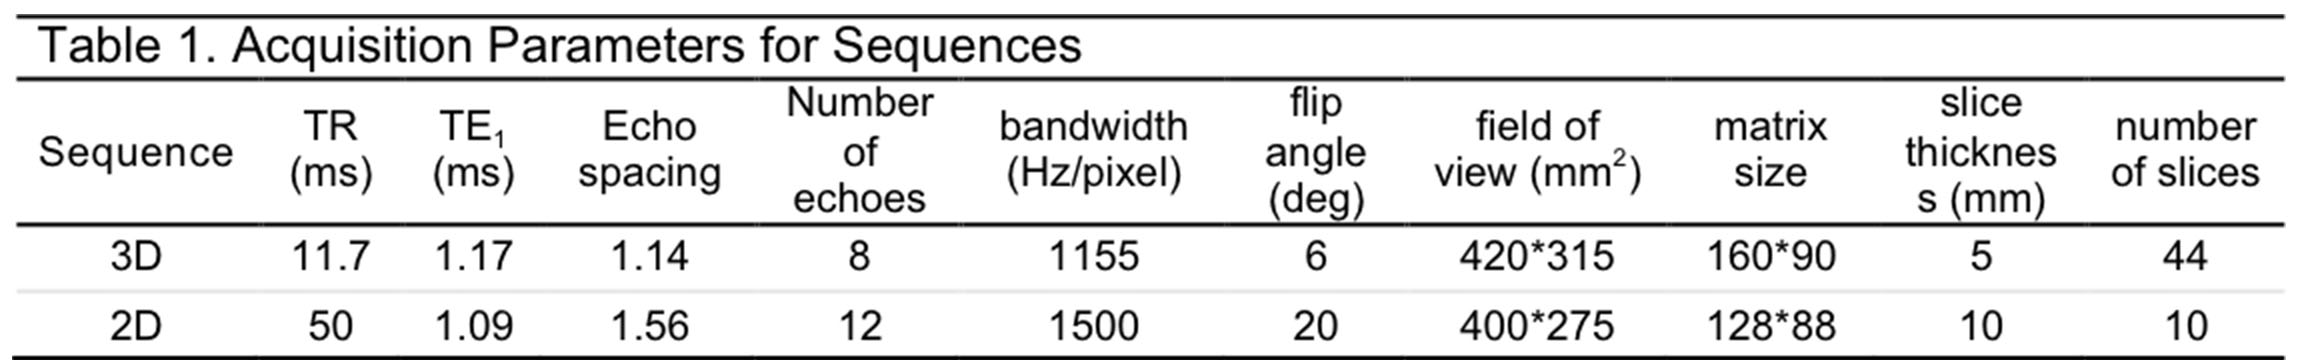
Material and Methods
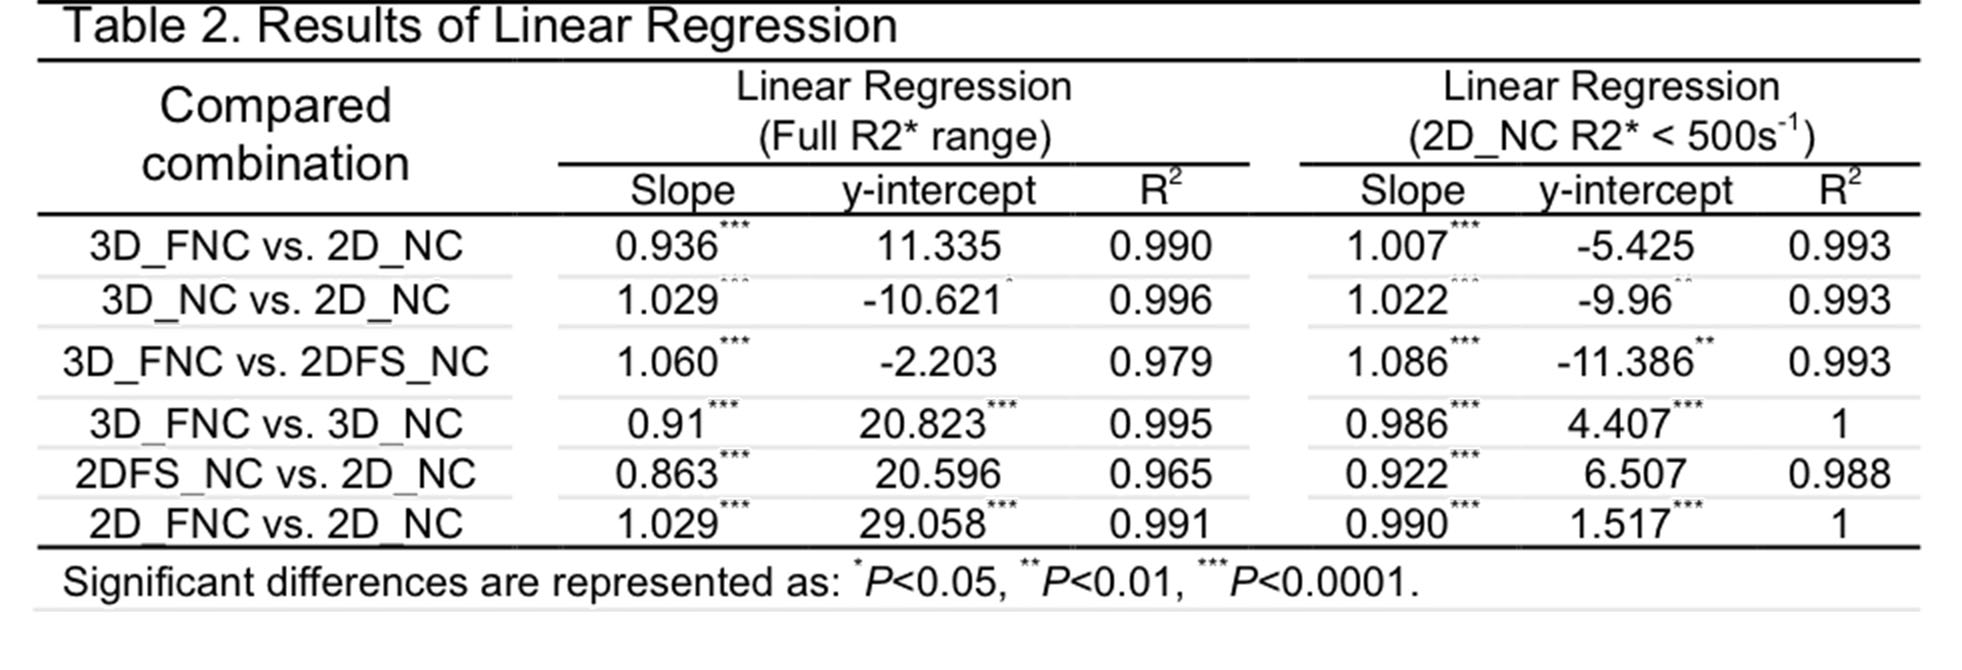
This retrospective study was approved by our institutional review board, and informed consent was obtained from all patients. Twenty patients suspected of hepatic iron overload, i.e. with an elevated serum ferritin level >1500 mg/L, were scanned on a 1.5 T MR system (MAGNETOM Aera; Siemens Healthcare, Erlangen, Germany). All patients included in the study, had a fat fraction below 5.56%, which was confirmed by multi-echo MRS5. A prototype 3D multi-echo GRE Dixon sequence6 and a 2D multi-echo GRE sequence with and without fat saturation were performed for all the patients. The 2D sequence with identical parameters was repeated with additional application of spectral fat saturation (2DFS). Table 1 lists the relevant parameters for each acquisition. Three elliptical ROIs per patient were drawn manually in co-localized regions, with maximum possible size while avoiding vessels, borders, and artifacts. Pixel-wise R2* fitting was implemented in Matlab (MathWorks, Natick, MA, USA) using magnitude image values, with optional modeling of the spectral complexity of fat and/or the expectation value of magnitude noise (“M1NCM” in 7): Noise corrected (NC) and fat-and-noise-corrected (FNC) R2* estimates were calculated, as well as a relative fitting error. Bland-Altman plots were used to test pairwise differences in mean R2* for corresponding ROIs among the combinations of acquisition and postprocessing variants. Linear regression was performed separately for a low-to-intermediate R2* range (2D_NC R2* < 500s-1) and the full R2* range. P<.05 was considered significant.Results
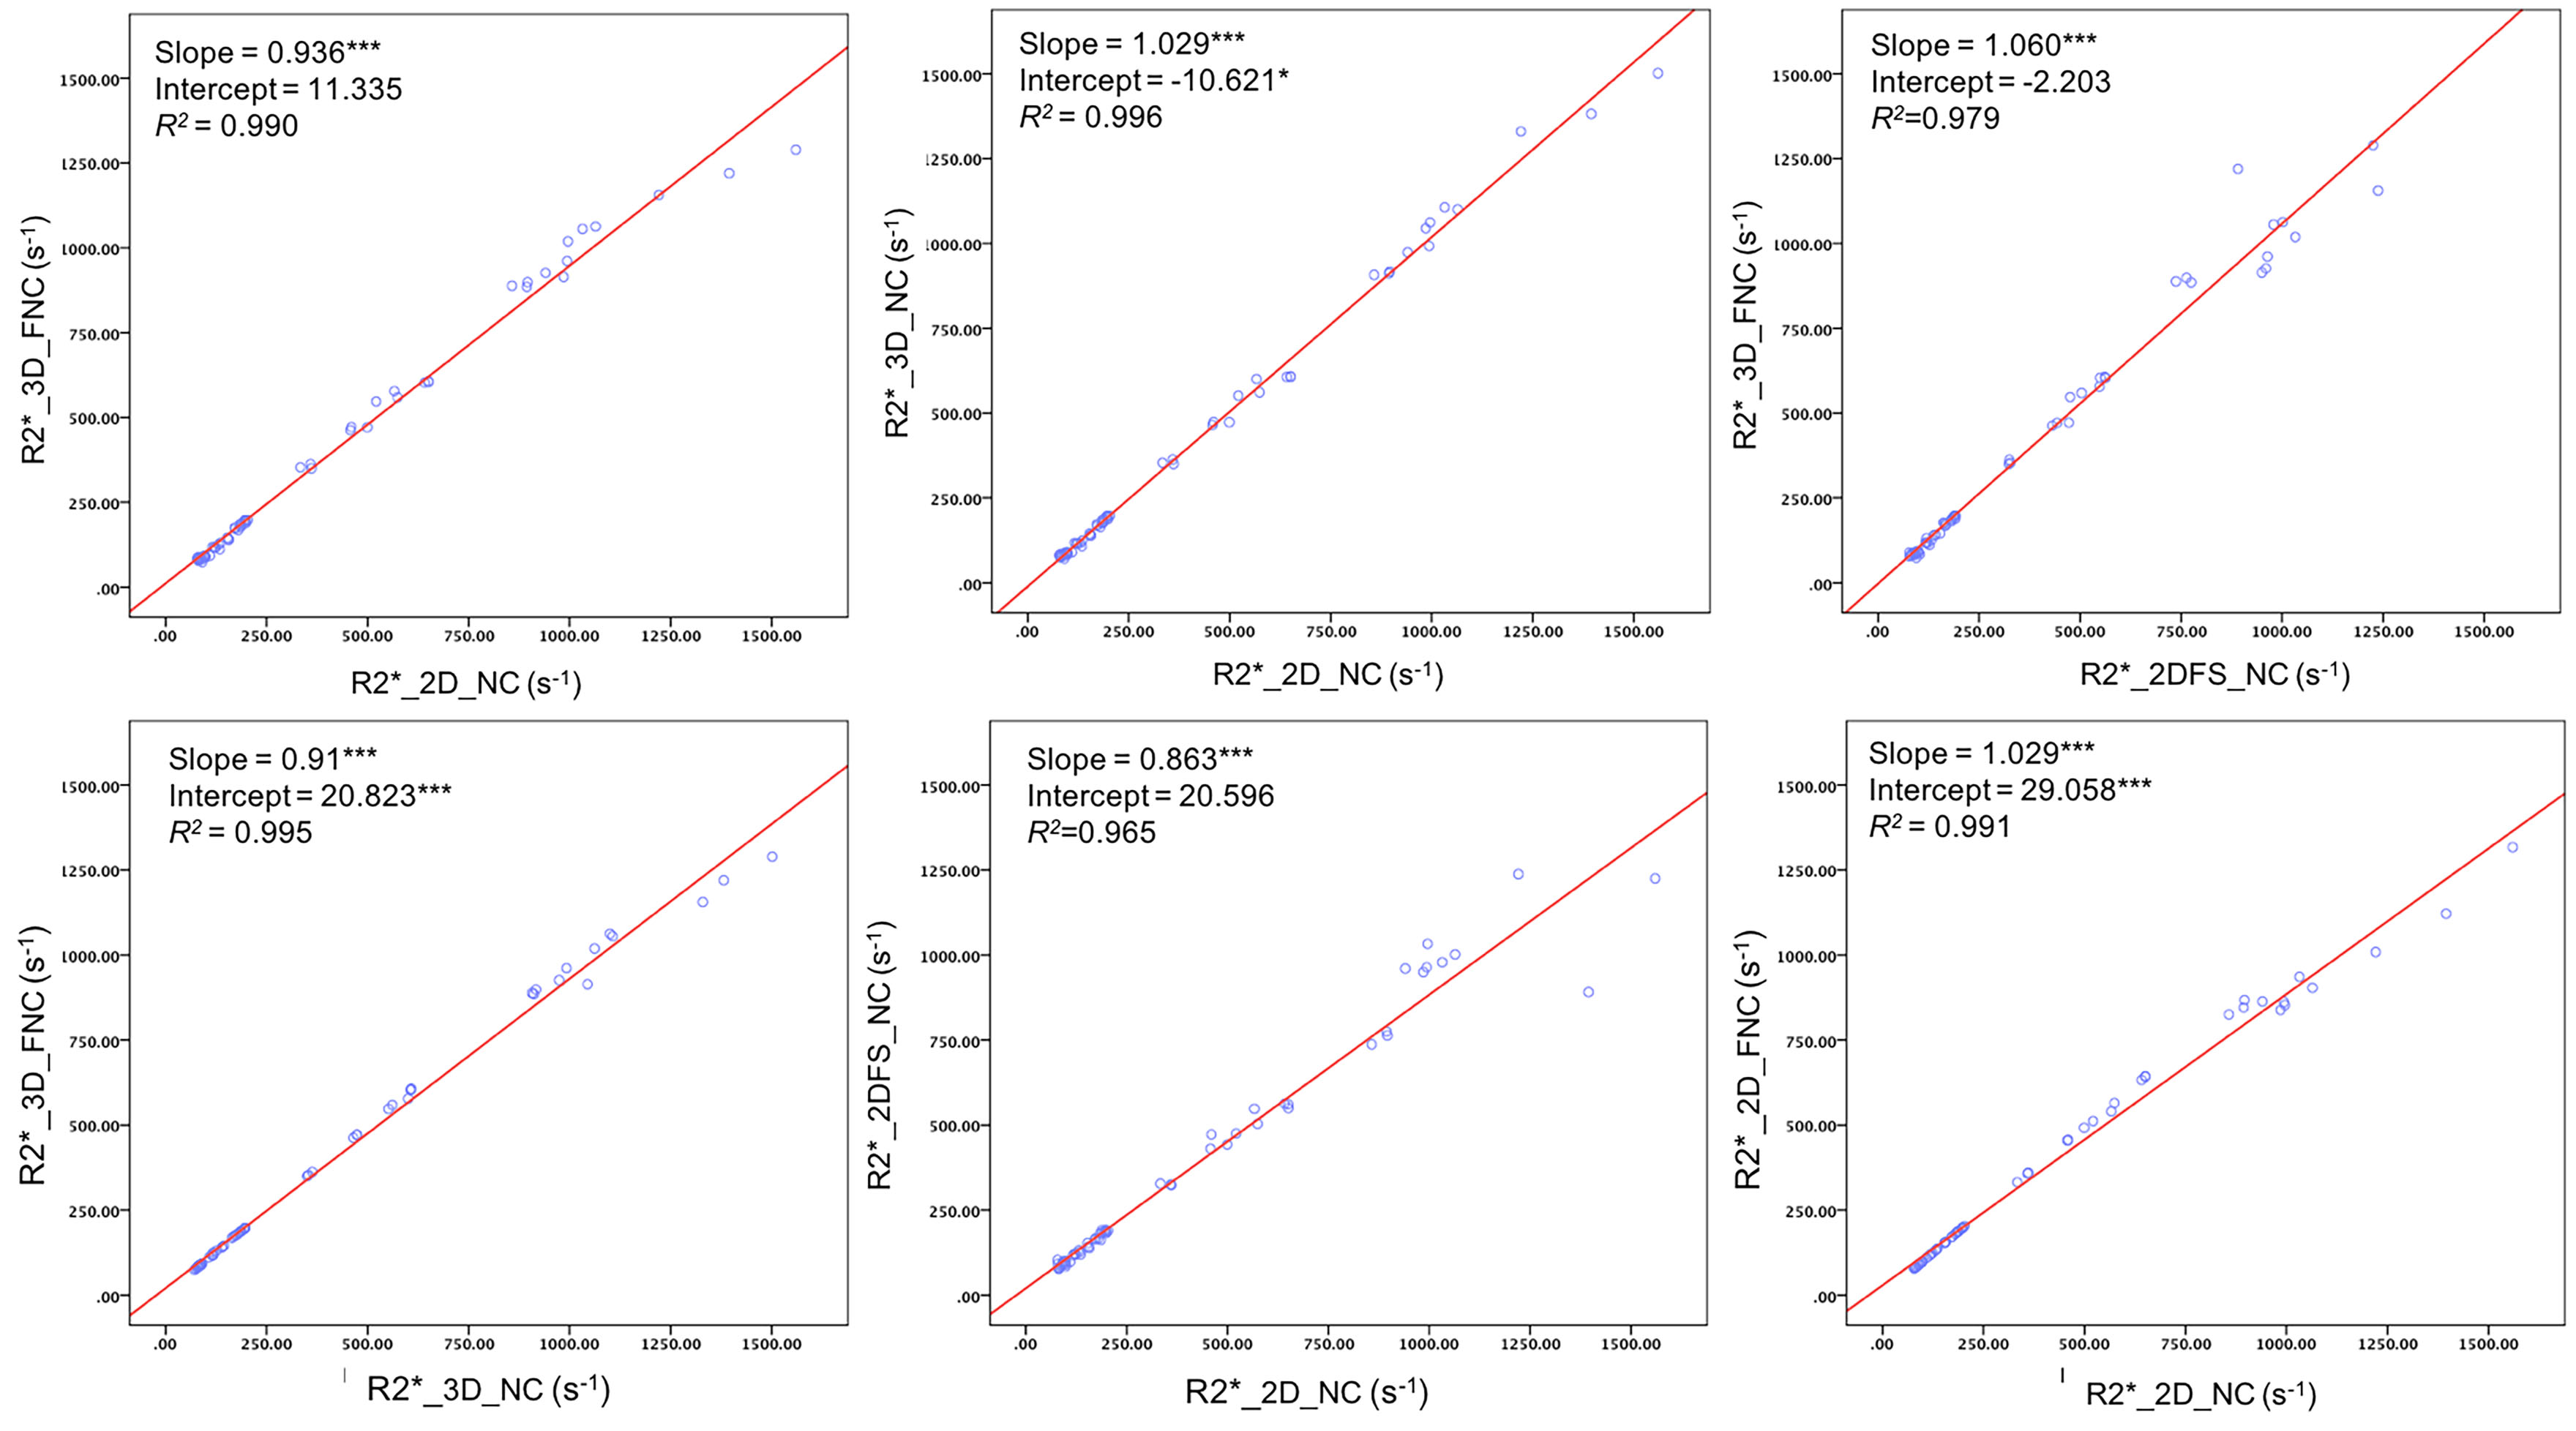
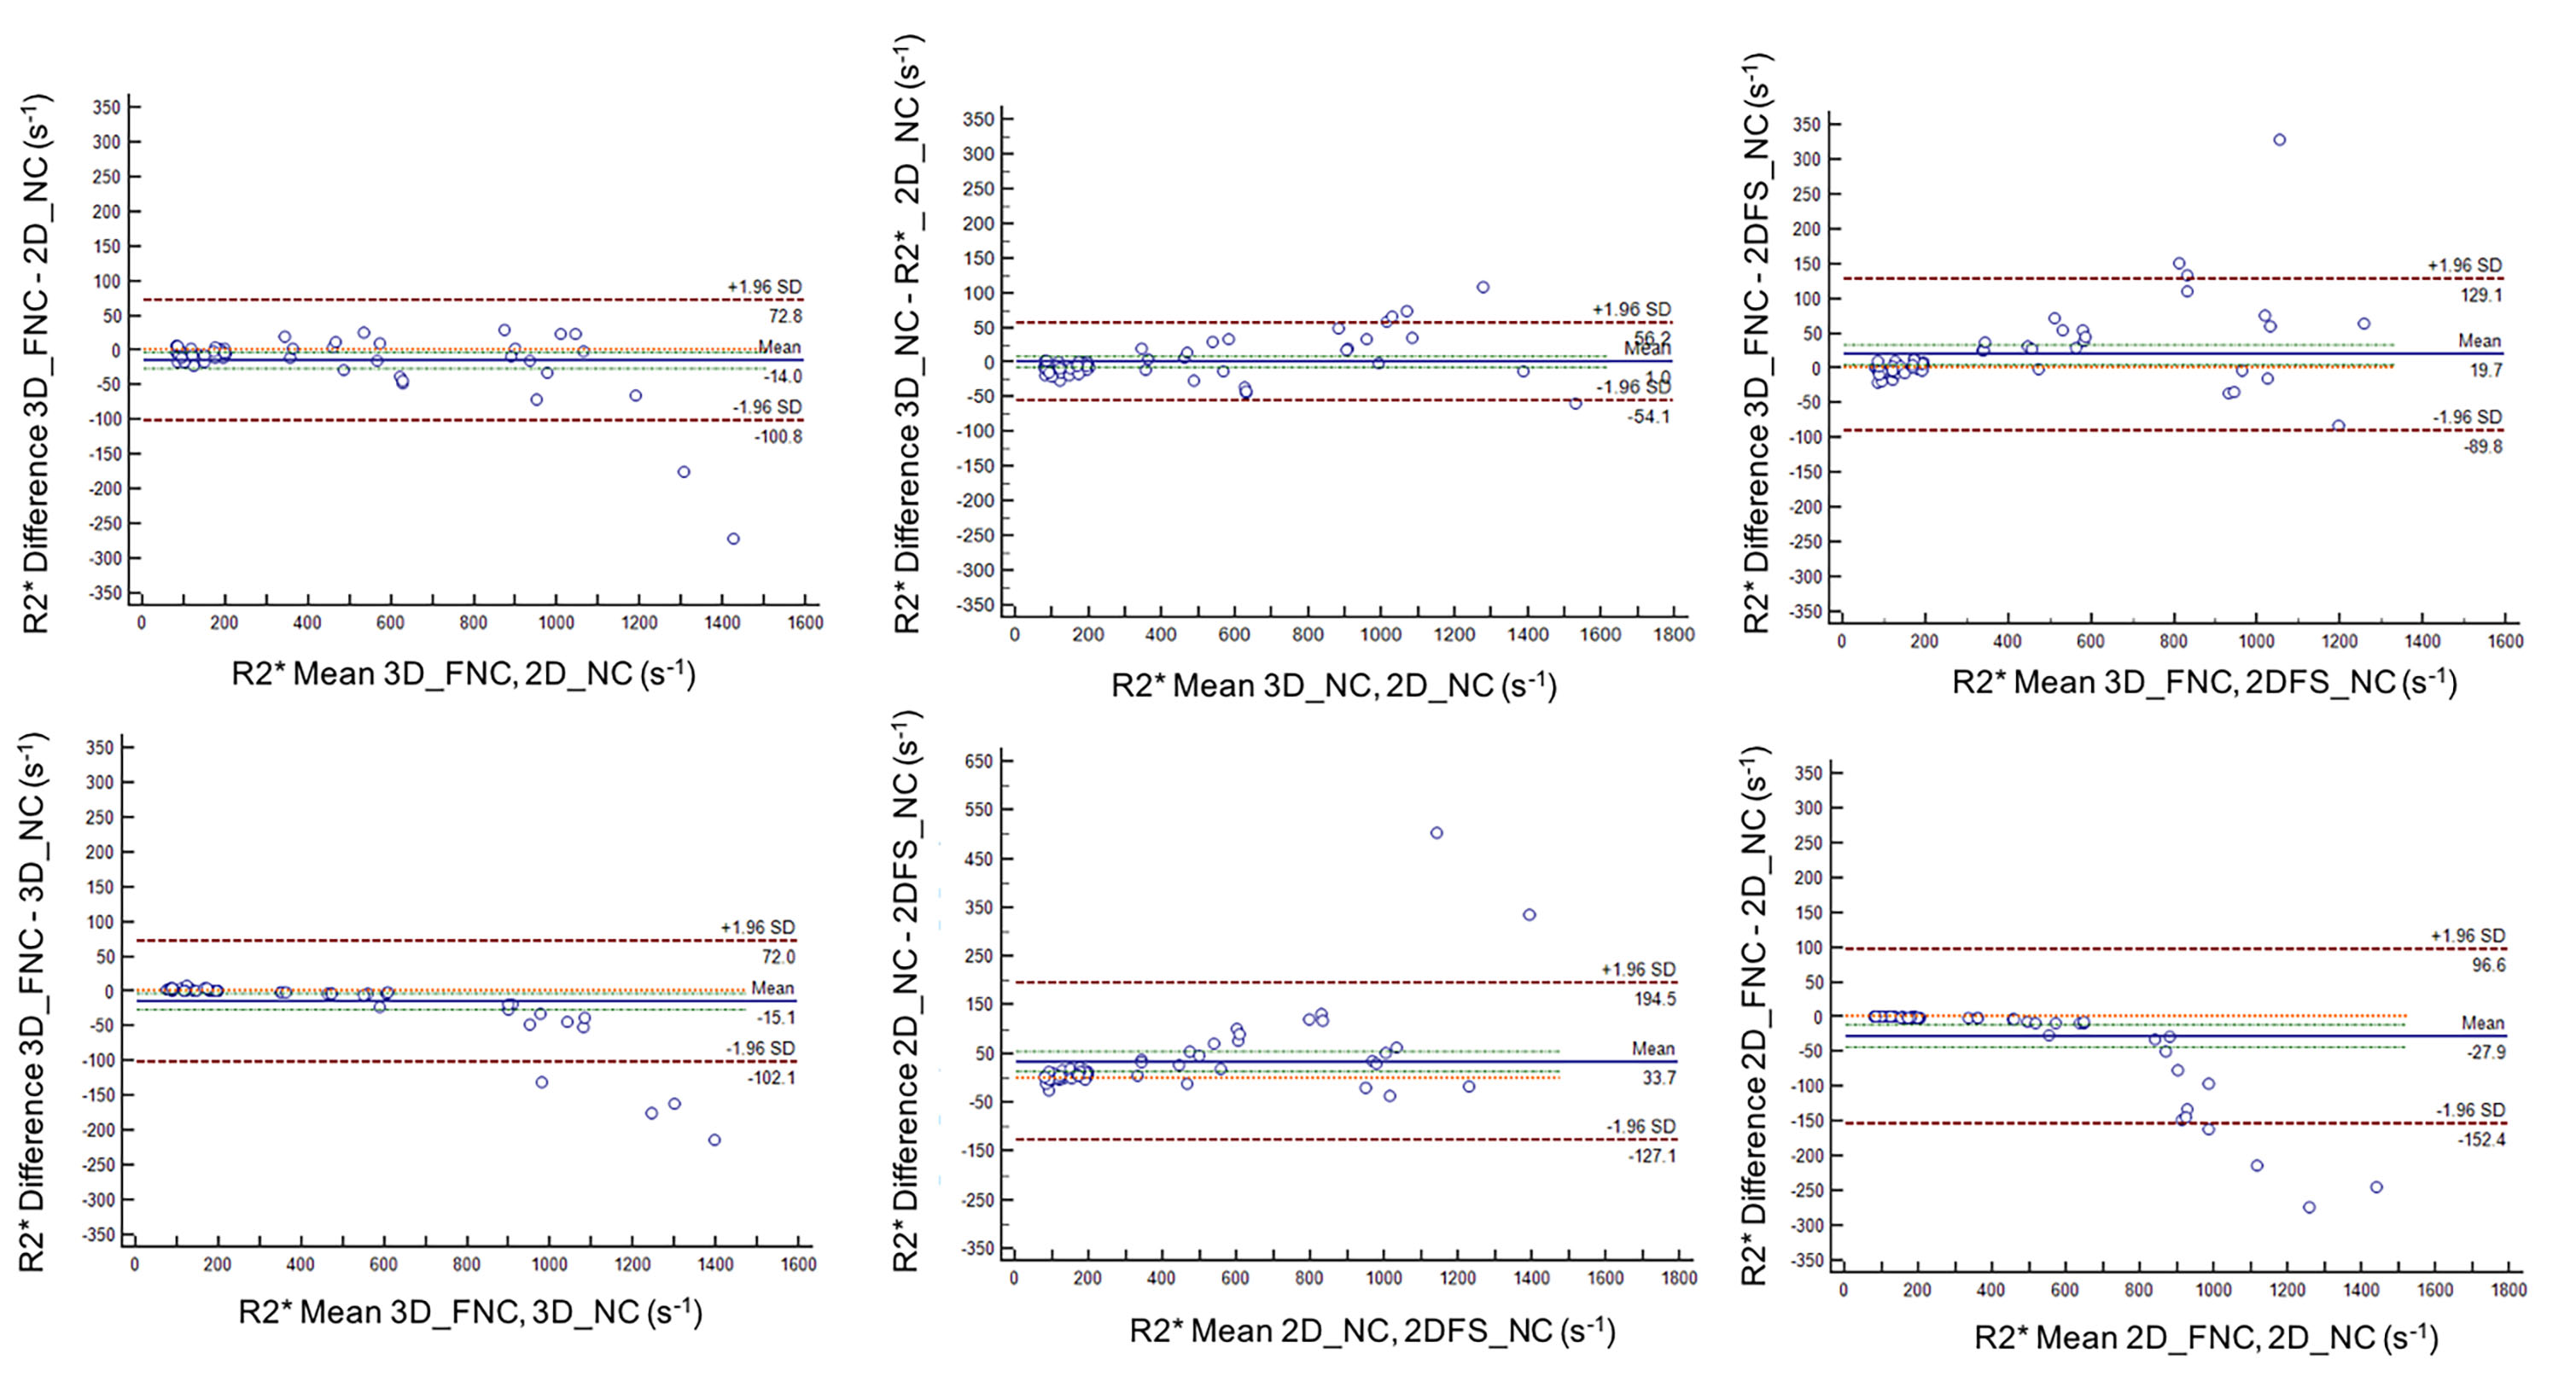
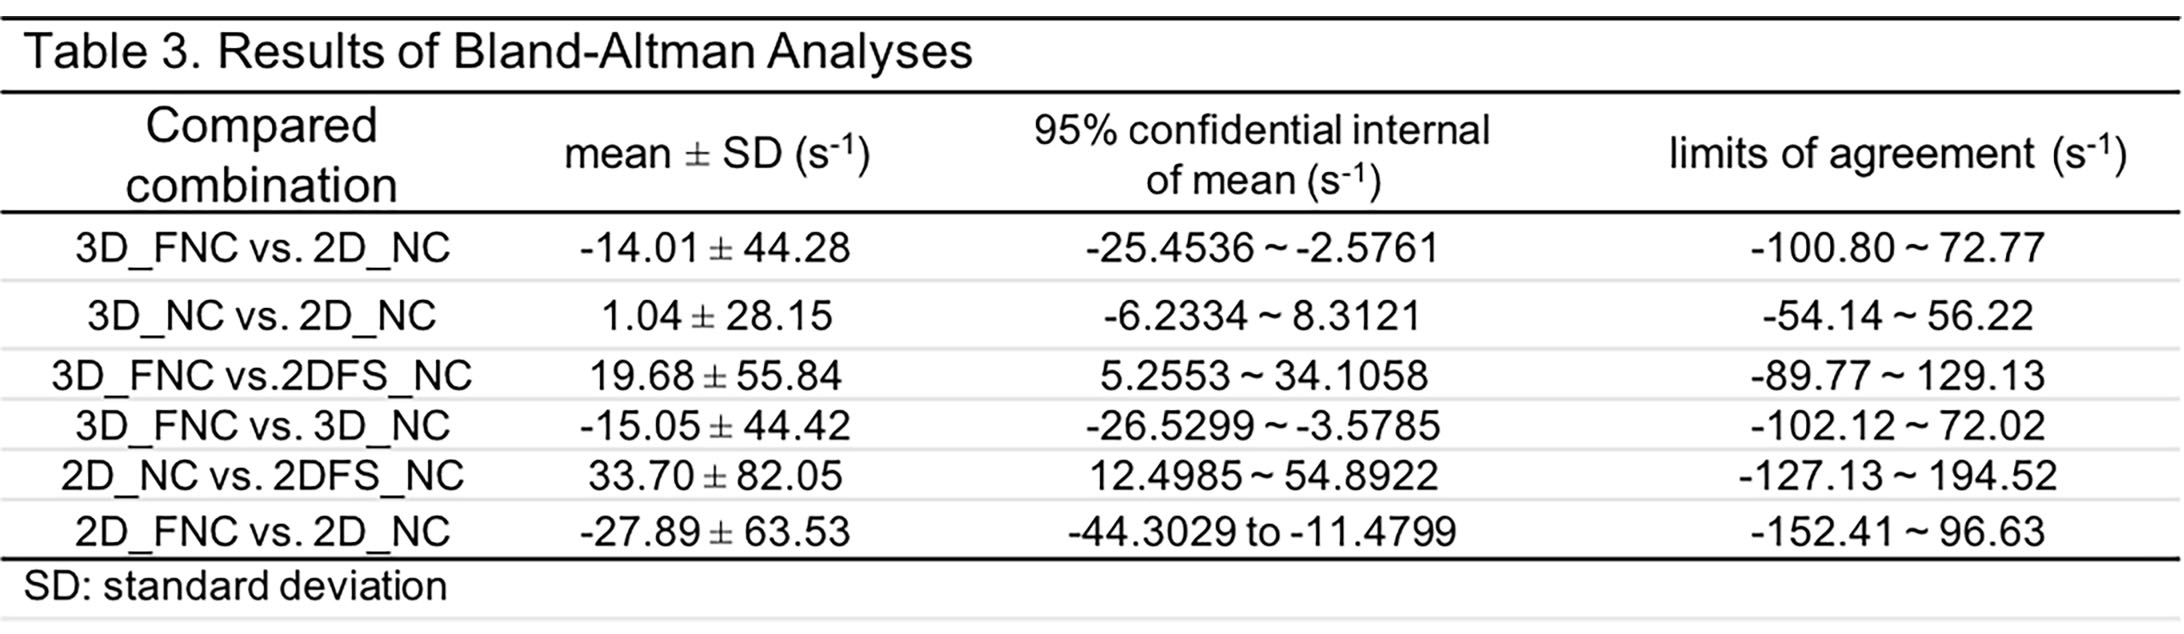
Figure 1 shows scatter plots and linear regression comparing different acquisition and postprocessing options. Figure 2 shows Bland-Altman plots comparing the same combinations. Tables 2 and 3 show the corresponding statistical results of linear regression and Bland-Altman analyses.
Up to approximately 750s-1, both 3D_NC and 3D_FNC R2* showed excellent agreement with 2D_NC R2*. Beyond ~750s-1, R2* was reduced with fat modeling, but 3D_NC and 2D_NC remained equivalent. Compared with both 3D and 2D_NC, 2DFS R2* was significantly lower, but still well-correlated. R2* standard deviation was lowest in 3D_FNC (51.00±79.27s-1), and highest in 2DFS_NC (72.46±123.12s-1). For the same postprocessing, the fitting error was higher for 2D than for 3D (NC and FNC), and highest for 2DFS (NC).
Discussion and conclusion
In a previous study2, a strong correlation was also found between fat-corrected 3D R2* and 2DFS R2*, but with higher R2* for 2DFS, contrary to our results, while lower R2* with fat saturation for 2D, consistent with our results, has been found elsewhere8; this needs further investigation. We found in the current study that, given the same acquisition parameters, R2* were equivalent between NC and FNC up to a certain value. Beyond that, fat-corrected postprocessing lowered R2* in this non-steatotic patient group. Similar results were found between 3D_FNC and 2D_NC. It may be necessary to remove fat from the signal model at high R2*, as has been reported in a similar context9. In conclusion, 3D multi-gradient-echo Dixon in combination with noise correction is a promising technique for rapid, whole-liver iron quantification also at high R2*, and it appears possible to cross-calibrate it to previous biopsy-based studies.Acknowledgements
No acknowledgement found.References
1. Brittenham GM, et al., Blood 2003;101(1):15-19.
2. Henninger B, et al., J Magn Reson Imaging 2017;46(3):793-800.
3. Hernando D, et al., J Magn Reson Imaging 2014;40(5):1003-1021.
4. Henninger B, et al., Rofo 2015;187(6):472-479.
5. Pineda N, et al., Radiology 2009;252(2):568-576.
6. Zhong X, et al., Magn Reson Med 2014;72(5):1353-1365.
7. Feng Y, et al., Magn Reson Med 2013;70(6):1765-1774.
8. Krafft AJ, et al., Magn Reson Med 2016;76(2):591-601.
9. Wiens CN, et al., Proc ISMRM 2017;25:371.
Figures