2599
Dynamic Monitoring of Liver Iron Overload and Chelation Therapy using Magnetic Resonance Imaging1Physics and Astronomy, University of Georgia, Athens, GA, United States, 2Bio-Imaging Research Center, University of Georgia, Athens, GA, United States, 3Pharmaceutical & Biomedical Sciences, University of Georgia, Athens, GA, United States
Synopsis
Many diseases have been associated with excessive iron in the liver. Therefore, the non-invasive detection of liver iron overload and the monitoring of iron chelation therapy is highly desirable. Presented here is a method to demonstrate the feasibility of this using MR-based $$$R^{*}_{2}$$$ and magnetic susceptibility quantification. Significant increases in $$$R^{*}_{2}$$$ and susceptibility (Glass’ Δ values in the ranges of [-4.29 -3.23] and [-2.55 -2.23], respectively) are observed in iron overloaded livers in comparison to baseline measurements. After six doses of Polyrotaxane conjugated with Deferoxamine (rPR-DFO) iron chelation therapy administered over twelve days, Δ values of 0.13 and -0.09 are observed for $$$R^{*}_{2}$$$ and susceptibility, respectively, indicating that the differences are no longer significant and the treatment is effective.
Purpose
To explore, at a high field strength of 7T, the feasibility of dynamically monitoring liver iron overload and chelation therapy in an in vivo mouse model using $$$R^{*}_{2}$$$ and quantitative susceptibility mapping (QSM).Methods
Four six week old female Balb/C mice were used in this study. On Day 1, three mice were administered 50 mg/kg (Fe/mouse mass) of Fe-Dextran solution using single tail vein injections to induce liver iron overload, while one mouse received 10 µl/g of saline to serve as the control. On Day 8 and every other day following for a total of six doses, one of the iron overloaded mice was administered 100 mg/kg of Deferoxamine mesylate (DFO) (an iron chelation agent), and one was administered Polyrotaxane (rPR)-DFO at an equivalent concentration of 100 mg/kg DFO. All mice were switched to an iron-deficient powder diet ad libitum on Day 8.
Using a 7T Varian Magnex MRI Scanner, the mice were scanned on Days 0, 7, 14, and 21 using a 3D multi-gradient-echo sequence (repetition time TR = 15 ms, flip angle FA = 5 degrees, initial echo time TEi = 1.7 ms, echo spacing ΔTE = 0.67 ms, 8 echoes, field of view FOV = 60x30x30 mm, a matrix size of 64x128x128, and 6 acquisitions for averaging).
The 1H NMR spectrum of a normal (non-iron overloaded) liver sample was also acquired using a 600 MHz Varian Inova Spectrometer. Assuming a 9-peak fat spectral model,1 the relative concentrations of the fat peaks were determined by performing multiplet analysis using MNOVA (Mestrelab Research) to generate a mouse liver fat spectral model to be used as a priori information in the following field map $$$f_{B}$$$ and $$$R^{*}_{2}$$$ estimation methods.
First, an initial $$$f_{B}$$$ estimate was obtained using a 3D graphcut algorithm,2,3 and its contribution was removed from the signals prior to initial $$$R^{*}_{2}$$$ estimation, which was performed on a voxel by voxel basis using variable projection.2,3 Final estimates of $$$f_{B}$$$ and $$$R^{*}_{2}$$$ were obtained by using the initial estimates and a Levenberg-Marquardt algorithm (Matlab, Mathworks Inc.) to perform complex NLLS fitting of the signals on a voxel-by-voxel basis, while simultaneously estimating the water and fat signal densities.4
Using the final $$$f_{B}$$$ estimate, QSM was performed, which consists of two main steps: 1) background
field removal and 2) local field to susceptibility dipole inversion. The
background field was removed from the final $$$f_{B}$$$ estimate using a projection onto dipole fields method,5 and dipole inversion
was performed using the remaining local field and a morphology enabled dipole
inversion method.6 Final susceptibility
estimates were obtained by finding the solution to the inversion problem using an
iterative conjugate gradient method.7
Results
The 1H NMR spectrum for the normal (non-iron overloaded) liver sample is shown in Figure 1 and displays the chemical shifts (with respective to water) and measured relative amplitudes of the 9 fat resonance peaks that were used as a priori information in the $$$f_{B}$$$ and $$$R^{*}_{2}$$$ estimation methods.
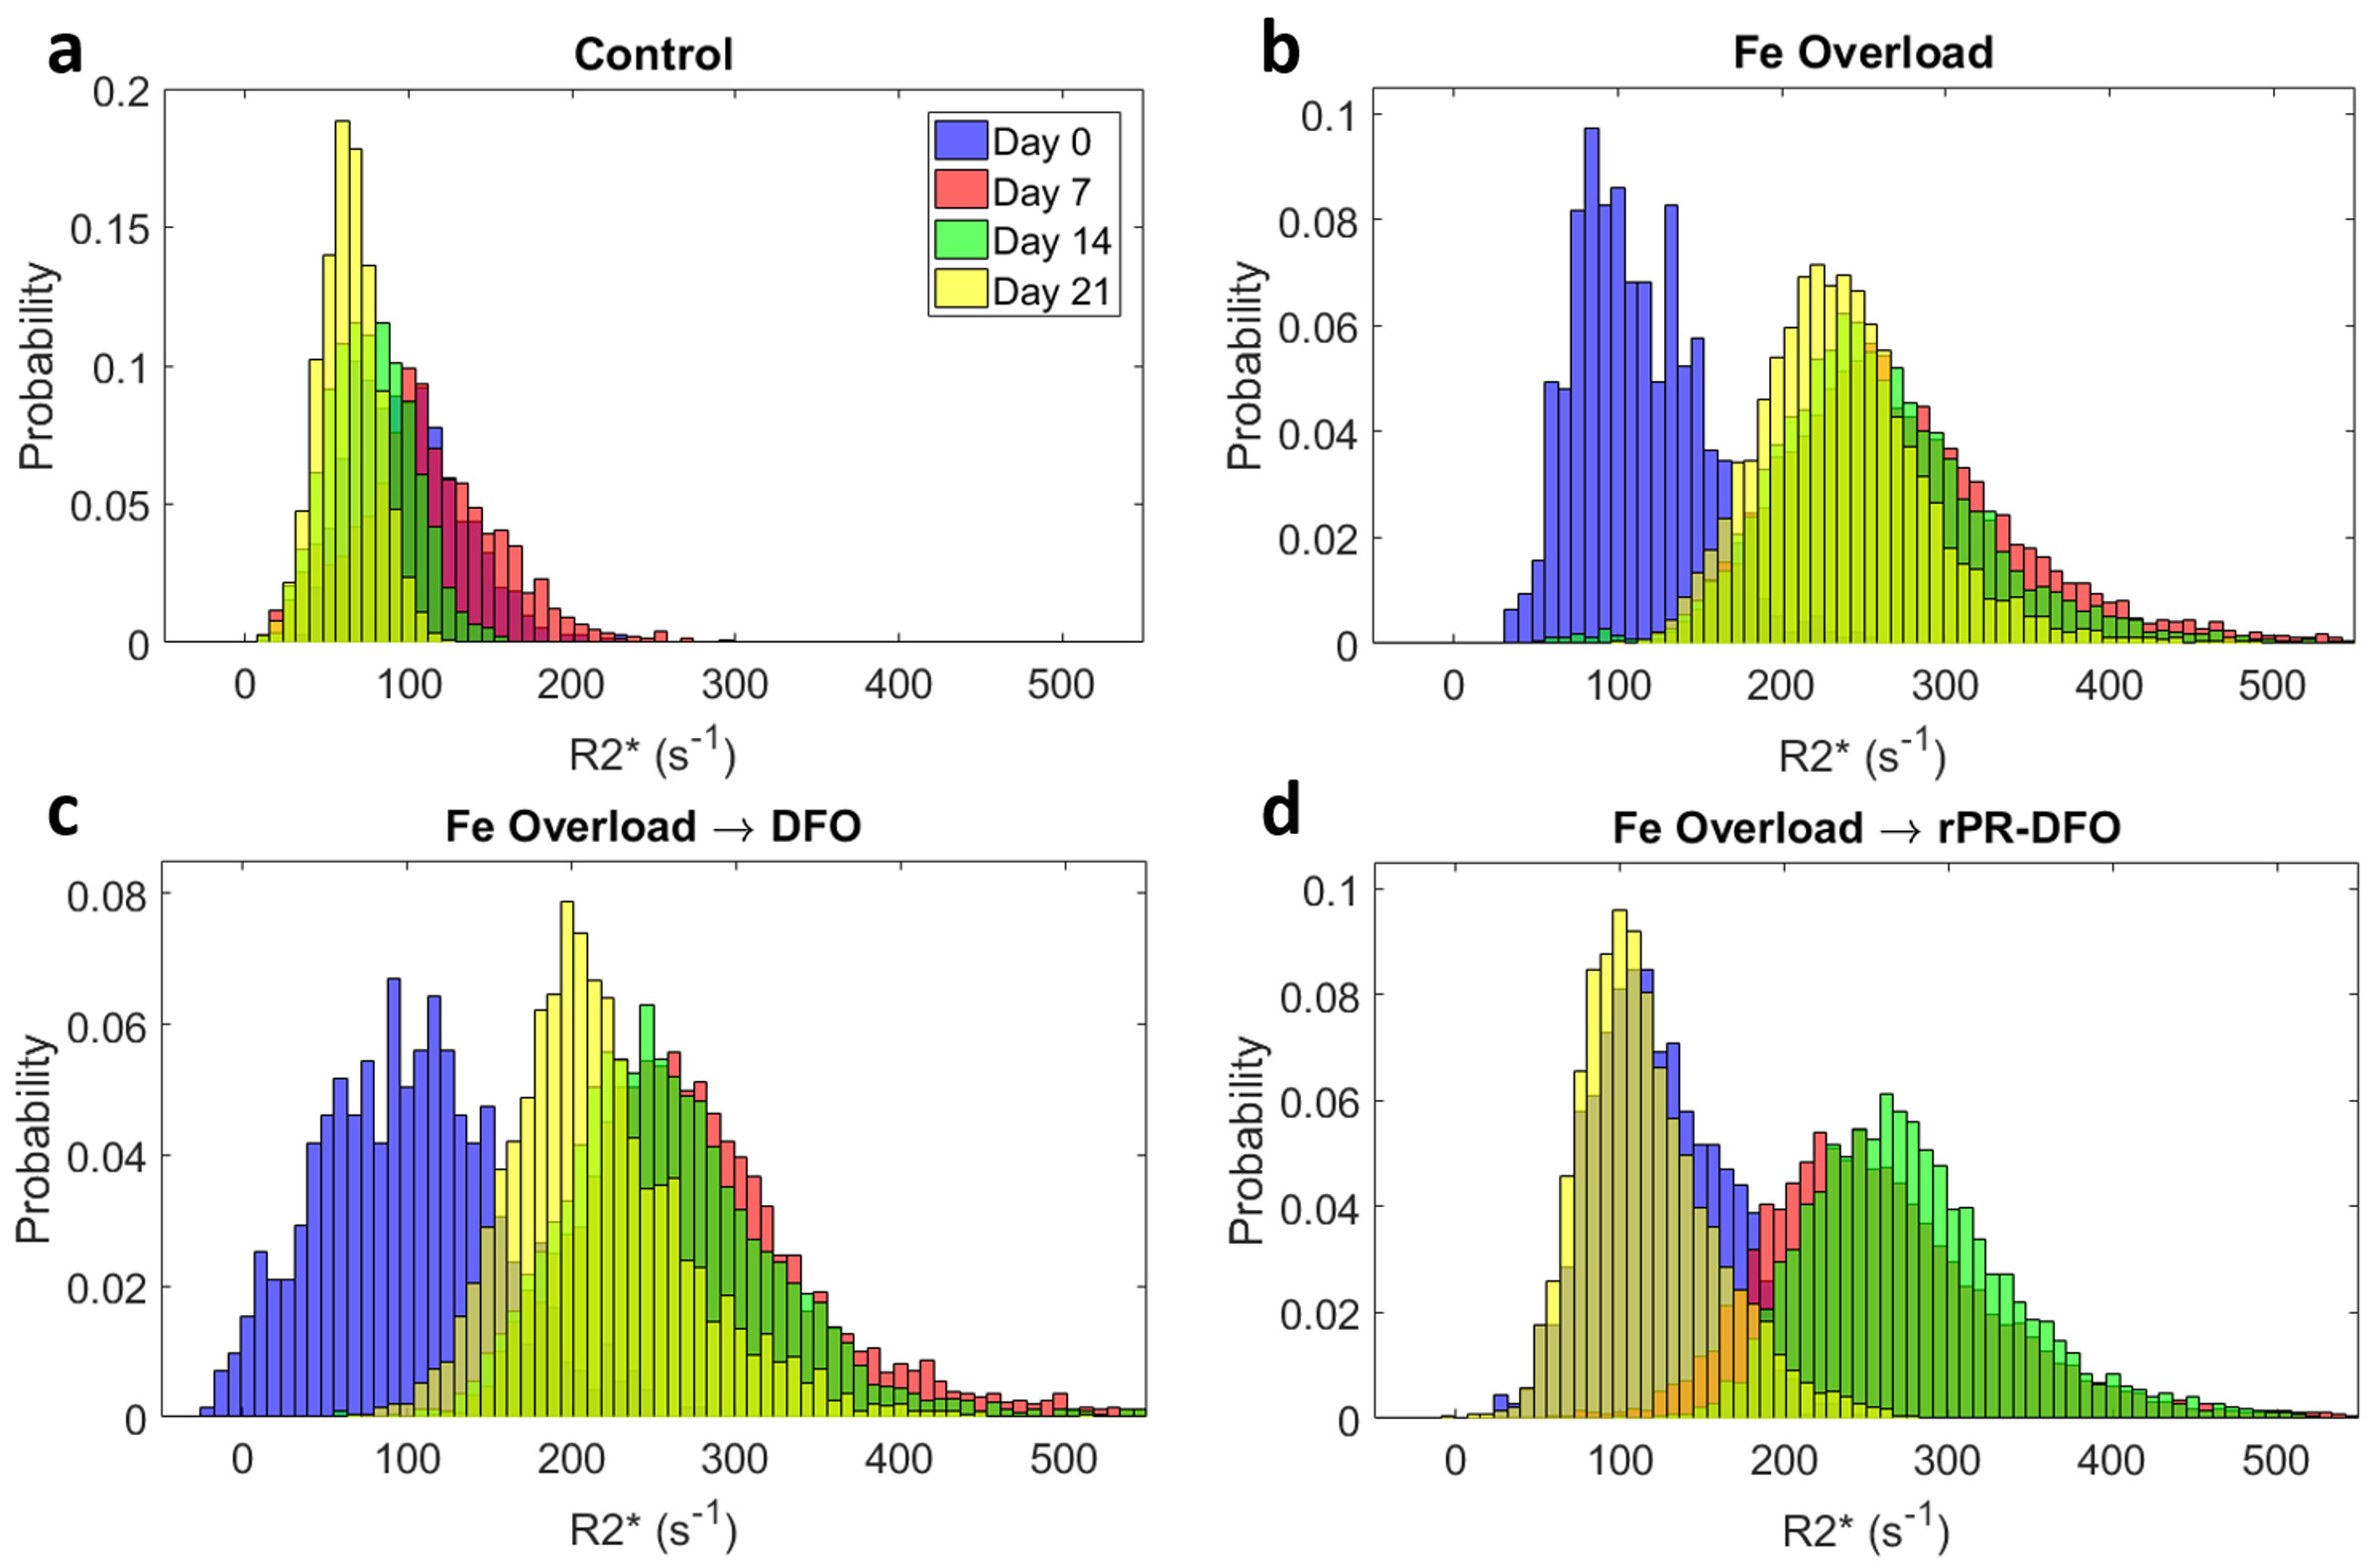
The distributions of measured liver $$$R^{*}_{2}$$$ and susceptibility values for all mice at each of the four time points are displayed in Figures 2 and 3, respectively. Following the administration of Fe-Dextran, clear increases in $$$R^{*}_{2}$$$ and susceptibility are observed (Day 7), and by Day 21 the mouse treated with rPR-DFO appears to have returned to baseline (Day 0), while the mouse treated with just DFO appears to have only partially returned to baseline.
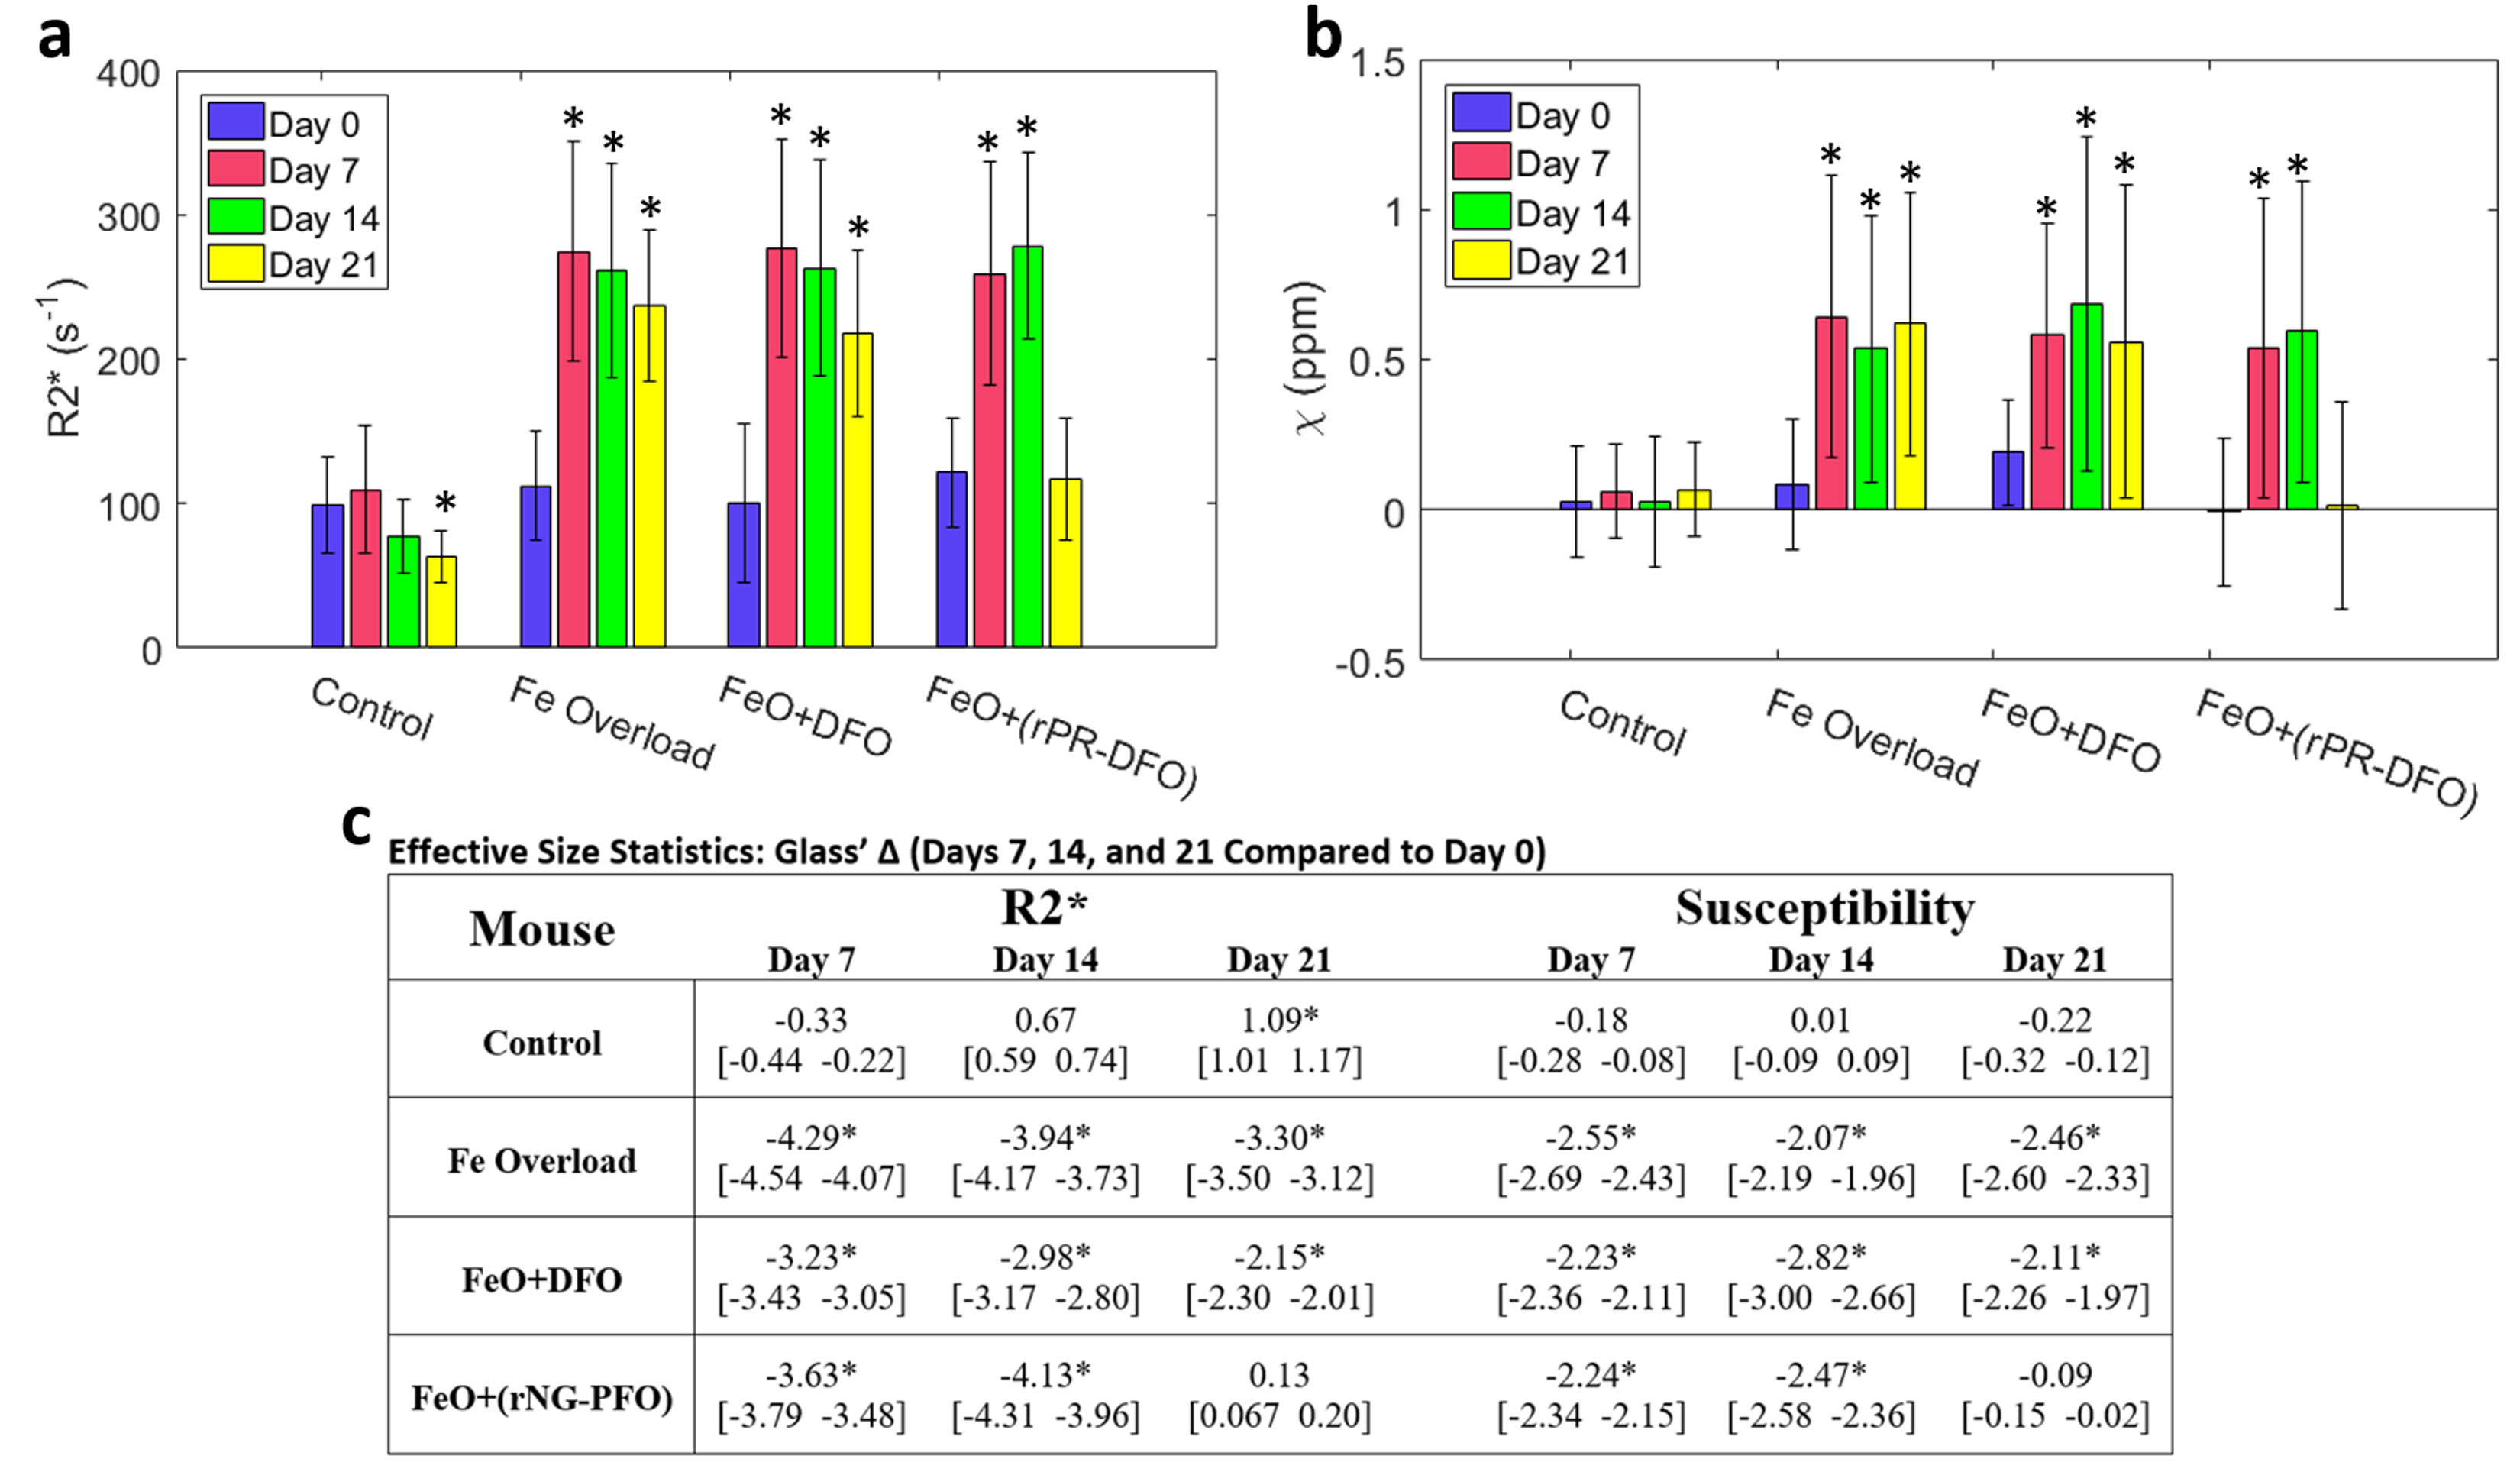
To determine whether the differences in the measurements on Days 7, 14, and 21 were significantly different from the baseline measurements, Glass’ Δ was used (Fig. 4c), which is an effect size statistic (emphasizes the size of the difference between measurements while remaining independent of sample sizes).8 For the three iron-overloaded mice, significant differences (|Δ| > 0.8) are seen in both $$$R^{*}_{2}$$$ and susceptibility on Day 7, and at Day 21, the measurements from the mouse administered rPR-DFO iron chelation therapy are no longer significantly different. Figure 5 displays representative images of the rPR-DFO treated mouse liver on Day 7 (iron overloaded) and Day 21 (returned to baseline).
Discussion and Conclusion
The proposed methodology demonstrates the feasibility of controllably generating liver iron overload in a mouse model and the feasibility of dynamically monitoring liver iron overload and chelation therapy using high field MRI (7T). Significant differences in liver $$$R^{*}_{2}$$$ and susceptibility are observed for the iron overloaded cases in comparison to baseline measurements, and after administration of rPR-DFO iron chelation therapy, the differences in the measurements are no longer significant showing effectiveness of the treatment. For the iron overloaded cases, the differences in the $$$R^{*}_{2}$$$ measurements are more significant than the differences in the susceptibility measurements (larger absolute Δ values in Fig. 4c).Acknowledgements
The authors would like to thank Dr. Diego Hernando for providing Matlab code to assist in the estimations of the field maps and $$$R^{*}_{2}$$$ and the Cornell MRI Research Lab, as we acknowledge the use of their QSM Toolbox (http://weill.cornell.edu/mri/pages/qsm.html) for some of the estimation methods performed in this work. This work was supported in part by NIH grants R01DK099596 and S10RR023706.References
1. Hamilton G, Yokoo T, Bydder M, Cruite I, Schroeder ME, Sirlin CB, Middleton MS. In vivo characterization of the liver fat (1)H MR spectrum. NMR Biomed 2011;24(7):784-90.
2. Hernando D, Haldar JP, Sutton BP, Ma J, Kellman P, Liang ZP. Joint estimation of water/fat images and field inhomogeneity map. Magn Reson Med 2008;59(3):571-80.
3. Hernando D, Kellman P, Haldar JP, Liang ZP. Robust water/fat separation in the presence of large field inhomogeneities using a graph cut algorithm. Magn Reson Med 2010;63(1):79-90.
4. Sharma SD, Hernando D, Horng DE, Reeder SB. Quantitative susceptibility mapping in the abdomen as an imaging biomarker of hepatic iron overload. Magnetic resonance in medicine 2015;74(3):673-683.
5. Liu T, Khalidov I, de Rochefort L, Spincemaille P, Liu J, Tsiouris AJ, Wang Y. A novel background field removal method for MRI using projection onto dipole fields. NMR in Biomedicine 2011;24(9):1129-1136.
6. Liu J, Liu T, de Rochefort L, Ledoux J, Khalidov I, Chen W, Tsiouris AJ, Wisnieff C, Spincemaille P, Prince MR. Morphology enabled dipole inversion for quantitative susceptibility mapping using structural consistency between the magnitude image and the susceptibility map. Neuroimage 2012;59(3):2560-2568.
7. Nocedal J, Wright SJ. Conjugate gradient methods. Numerical optimization 2006:101-134.
8. Hentschke H, Stüttgen MC. Computation of measures of effect size for neuroscience data sets. European Journal of Neuroscience 2011;34(12):1887-1894.
Figures