2598
R2*-Relaxometry Can Replace Histology for Detecting Slight Iron Overload in Patients with Early Stage Chronic Liver Disease: A Comparison of R2*, Histology, and Mass-Spectrometry1Department of Radiation Physics, and Department of Medical and Health Sciences and Center for Medical Image Science and Visualization (CMIV), Linköping University, Linköping, Sweden, 2Department of Medical and Health Sciences and Department of Gastroenterology and Hepatology, Linköping University, Linköping, Sweden, 3Center for Medical Image Science and Visualization (CMIV), Linköping University, Linköping, Sweden, 4Department of Medical and Health Sciences and Center for Medical Image Science and Visualization (CMIV), Linköping University, Linköping, Sweden
Synopsis
R2*-relaxometry can be used to non-invasively detect hepatic iron overload. However, most previous studies included patients with very high iron content. We sought to investigate if relaxometry reliably can detect lower levels of hepatic siderosis. R2* was therefore measured in patients with suspected chronic liver diseases of varying etiologies. We compared the relaxation rates to histological semiquantitative assessment as well as total liver iron content using mass spectrometry. There was good correlation between R2* and liver iron content. We also showed that R2*-relaxometry is better than histology when detecting slight iron overload.
Purpose
Liver iron overload can be caused by blood cell transfusions, hereditary hemochromatosis, as well as other chronic liver diseases (CLD) such as non‑alcoholic fatty liver disease and chronic hepatitis. The current method for assessing liver iron overload is to perform a liver biopsy, which can be used to directly measure liver iron content (LIC). Alternatively, the iron load can be semi-quantitatively assessed by a pathologist. However, a biopsy is invasive and suffers from sampling variability.
A non-invasive alternative is R2*-relaxometry, which has shown promising results for staging iron overload in transfusion patients1-3. However, such patients often have an LIC 10-30 mg/g dry weight; whereas the typical CLD patients referred to a hepatology department have a much lower LIC, with LIC<1.2 mg/g dry weight is considered normal4.
The purpose of this work was to evaluate if R2*-relaxometry can be used to determine LIC and also to detect slight iron overload in a cohort of patients with chronic liver disease of varying etiologies and to compare the relaxation rates to both histological semiquantitative assessment and LIC. Furthermore, we also sought to investigate if the R2*-measurements are confounded by fat, as has been reported previously5-6.
Methods
Eighty-one patients with suspected CLD, of different etiologies, referred to our hepatology department due to chronically (>6 months) elevated serum levels of alanine aminotransferase, and/or aspartate aminotransferase, and/or alkaline phosphatase, and scheduled for liver biopsy, were prospectively included. All patients underwent an MRI examination (Philips Achieva 1.5T) prior to obtaining two liver biopsies, on the same occasion. The first biopsy underwent histopathological semiquantitative assessment of iron content using Perl´s Prussian blue stain. Iron content was graded on a scale from 0-4, where zero is considered healthy and one to four are different stages of overload. The second biopsy was analyzed for LIC by inductively coupled plasma sector field mass spectrometry.
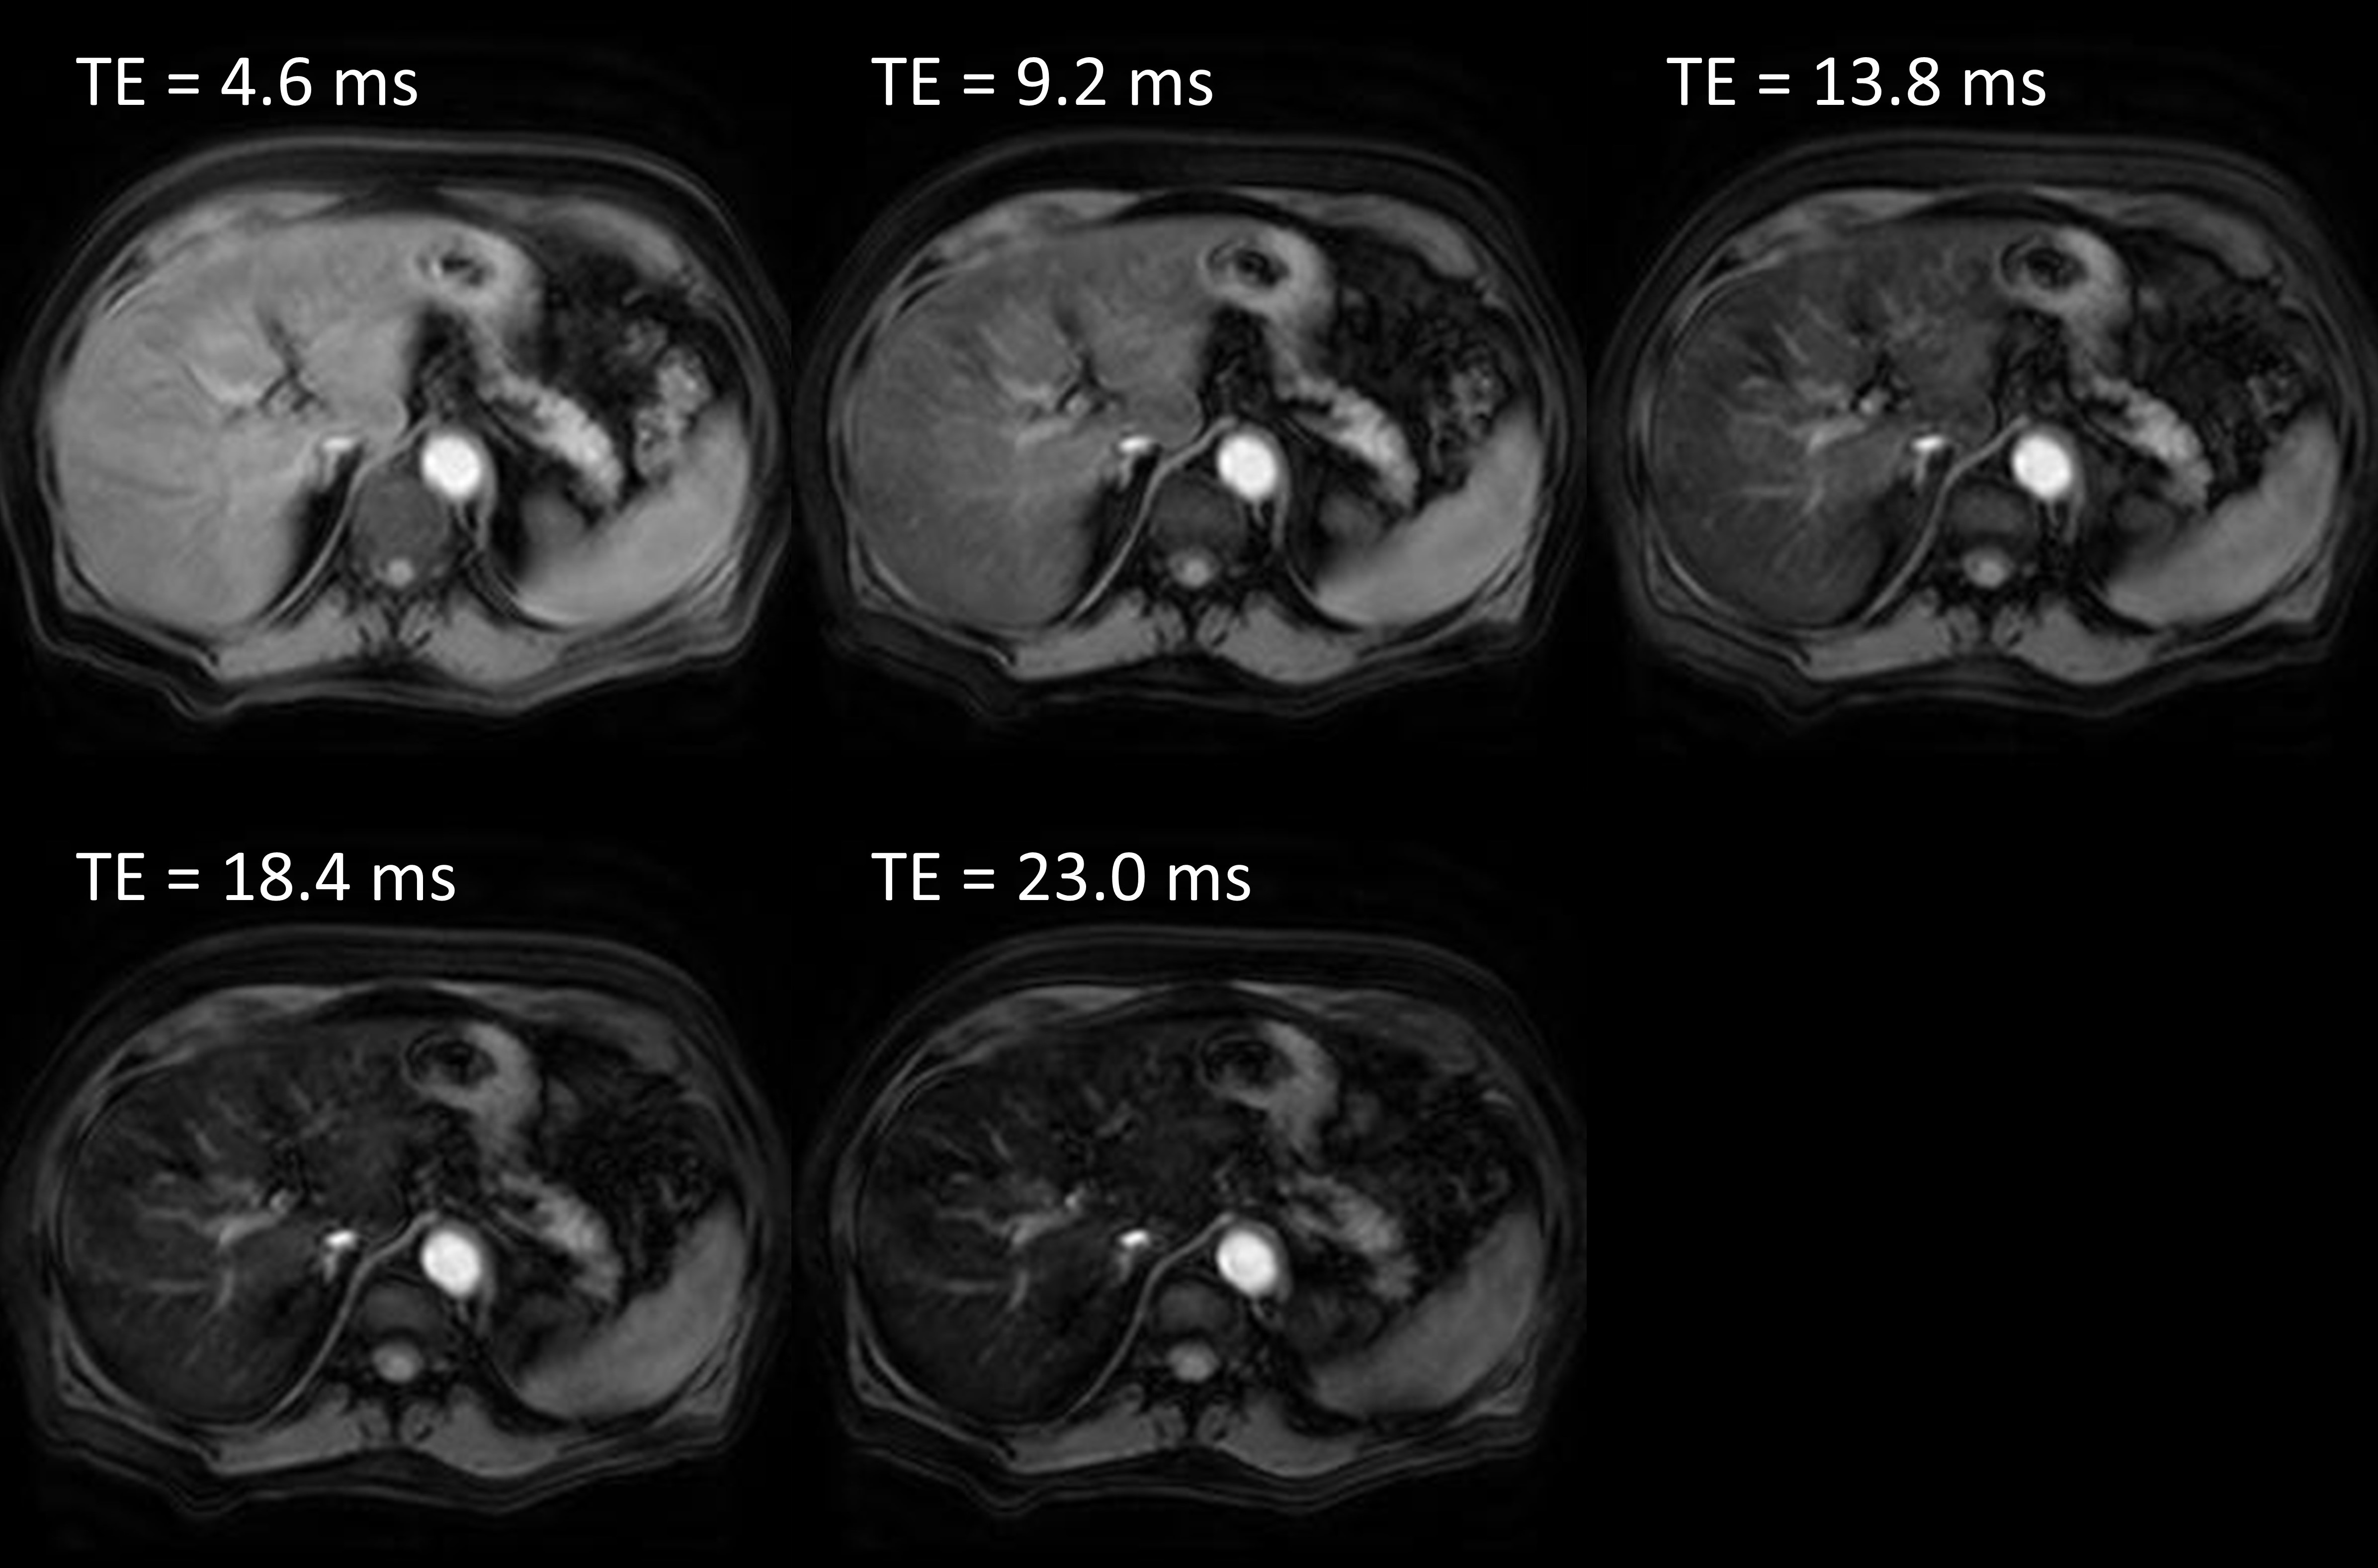
R2* was measured using an axial 3D fat‑saturated multi-echo turbo field echo sequence (Fig 1; TR=26ms, TE=4.6/9.2/13.8/18.4/23.0ms, FA=20°, resolution=1.25x1.25x5mm3, FOV=320x290x80mm3). A region of interest was placed in the liver and R2* was calculated by fitting the mean signal intensities at the different echo times to a mono-exponential decay function.
Liver proton density fat fraction (PDFF) was measured by MR spectroscopy (PRESS sequence, TR=1500ms, TE=35ms, VOI=30x30x30mm3, NSA=8). The spectra were analyzed using jMRUI and the AMARES-algorithm. The resonances were corrected for sequence parameters, the different T1- and T2-relaxation times, and the lipid resonances hidden under the water resonance.
Results
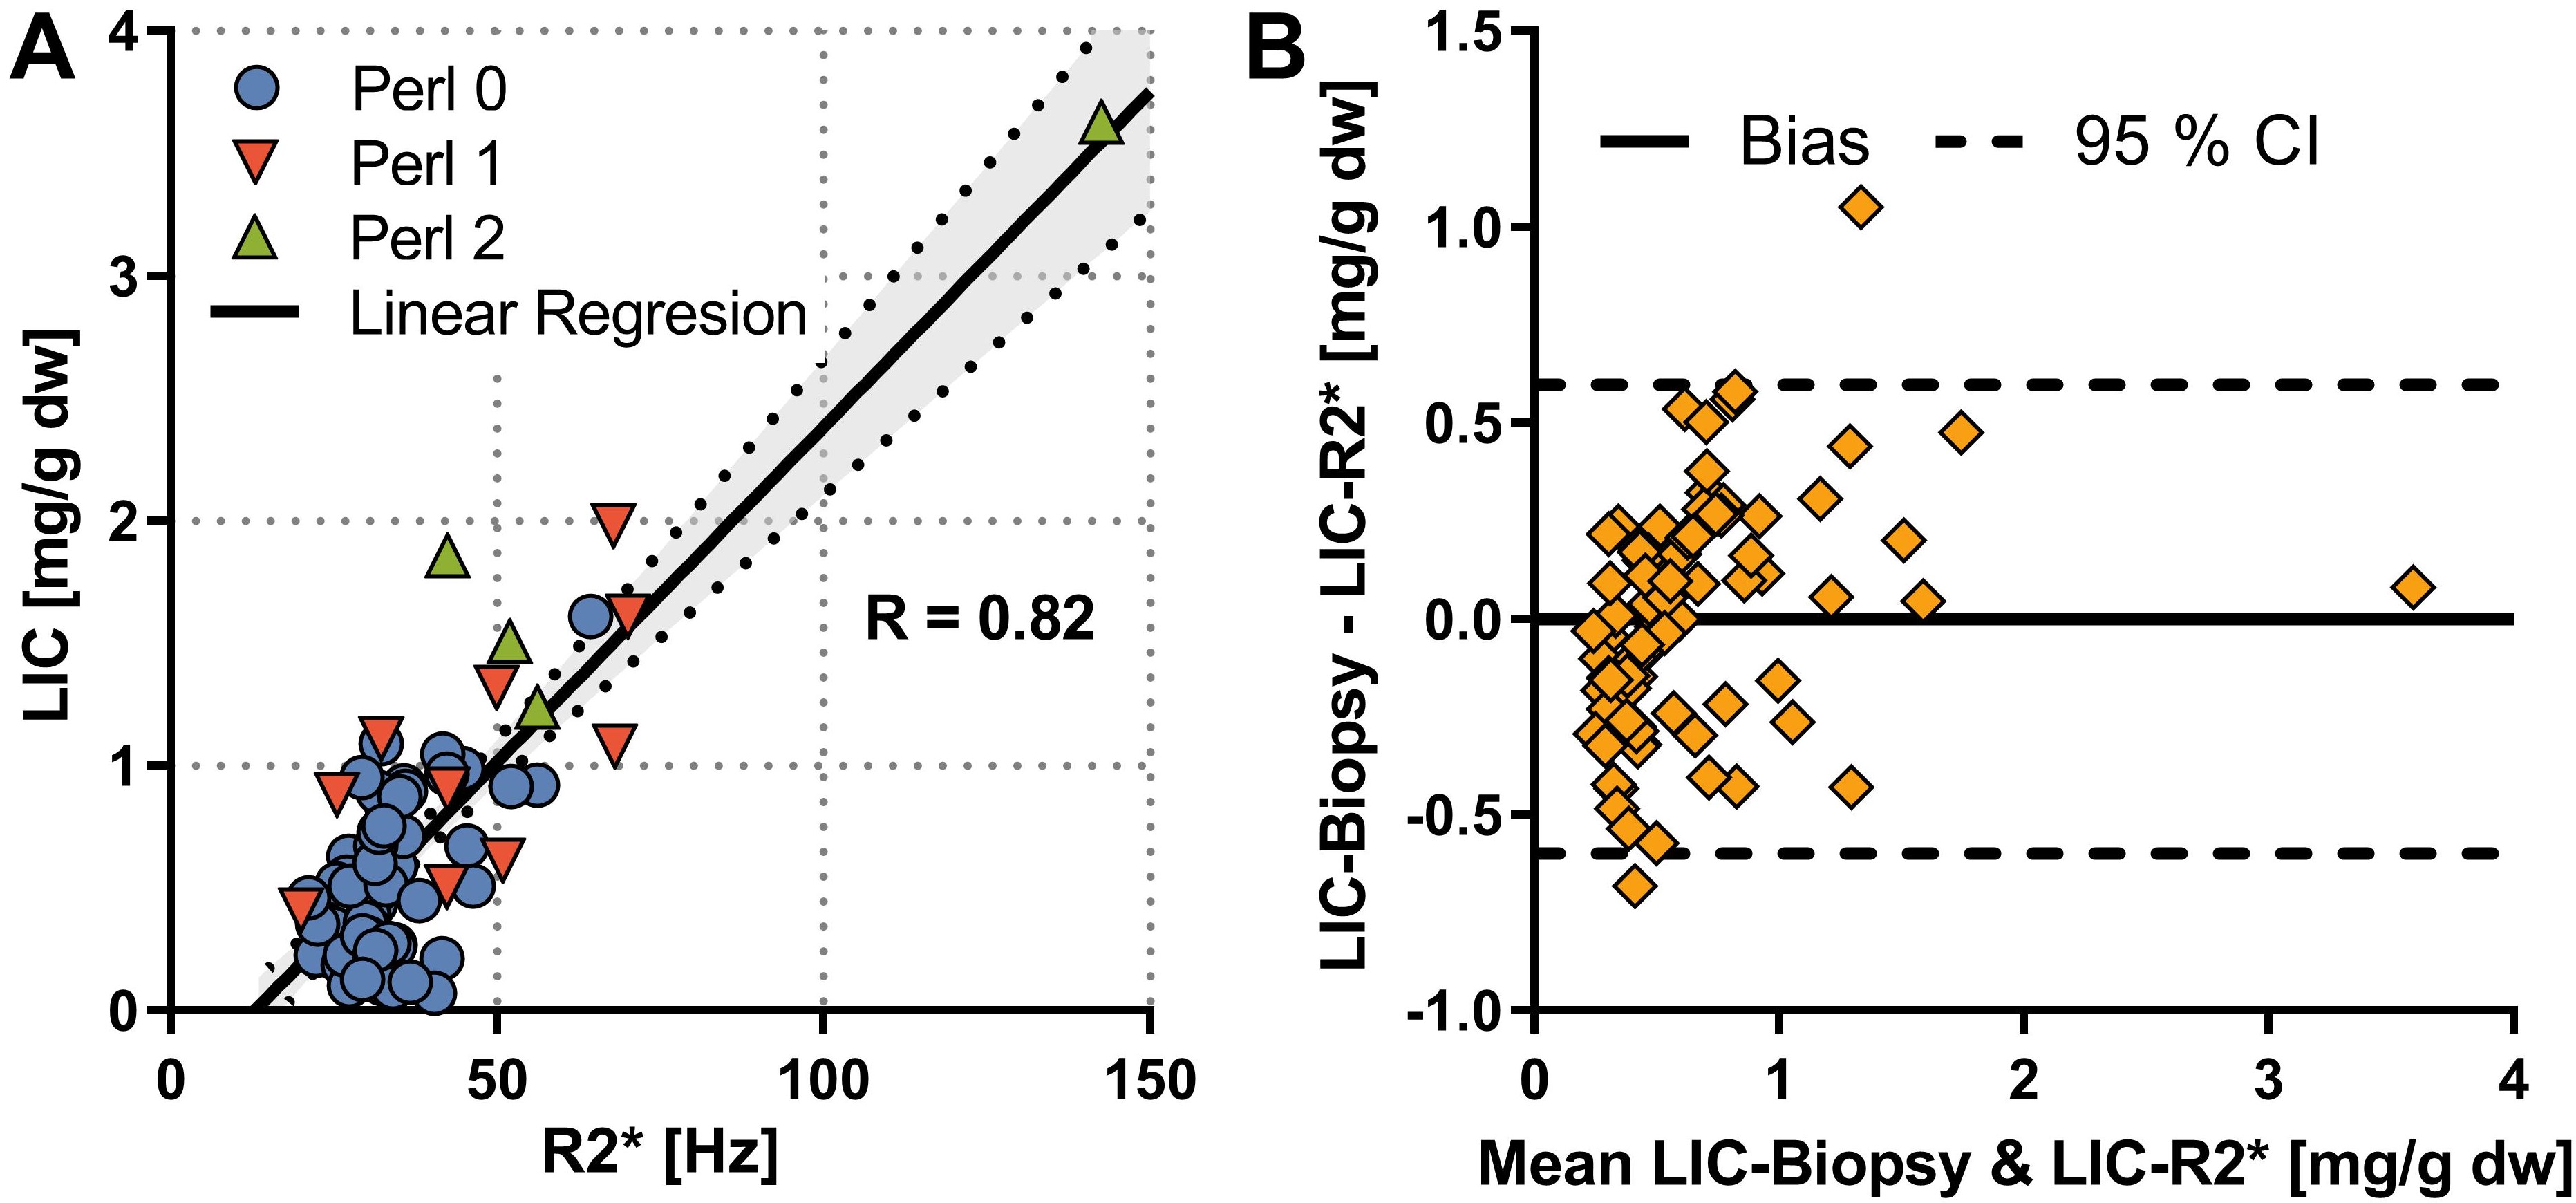
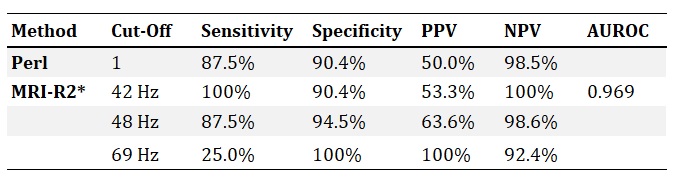
Fig 2A shows correlation between R2* and LIC (R=0.82). The different markers in the figure represent the different Perl´s Score given by the pathologist. Just like in other studies, whcih included patients with a higher range of LIC, there was a clear linear relation between R2* and LIC, except at the very low end of the scale. The pathologist seems to overestimate hepatic iron content in some cases, as several of the patients with grade 1 have a LIC<1.2 mg/g. Furthermore, Table 1 shows the diagnostic performance of different R2* out‑off levels, compared to histology. In summary, R2* shows better sensitivity and specificity than histology.
A Bland‑Altman analysis (Fig 2B) of the actual LIC and the LIC estimated using the linear regression in Fig 2A shows that the error when estimating LIC using R2* is around 0.5 mg/g dry weight.
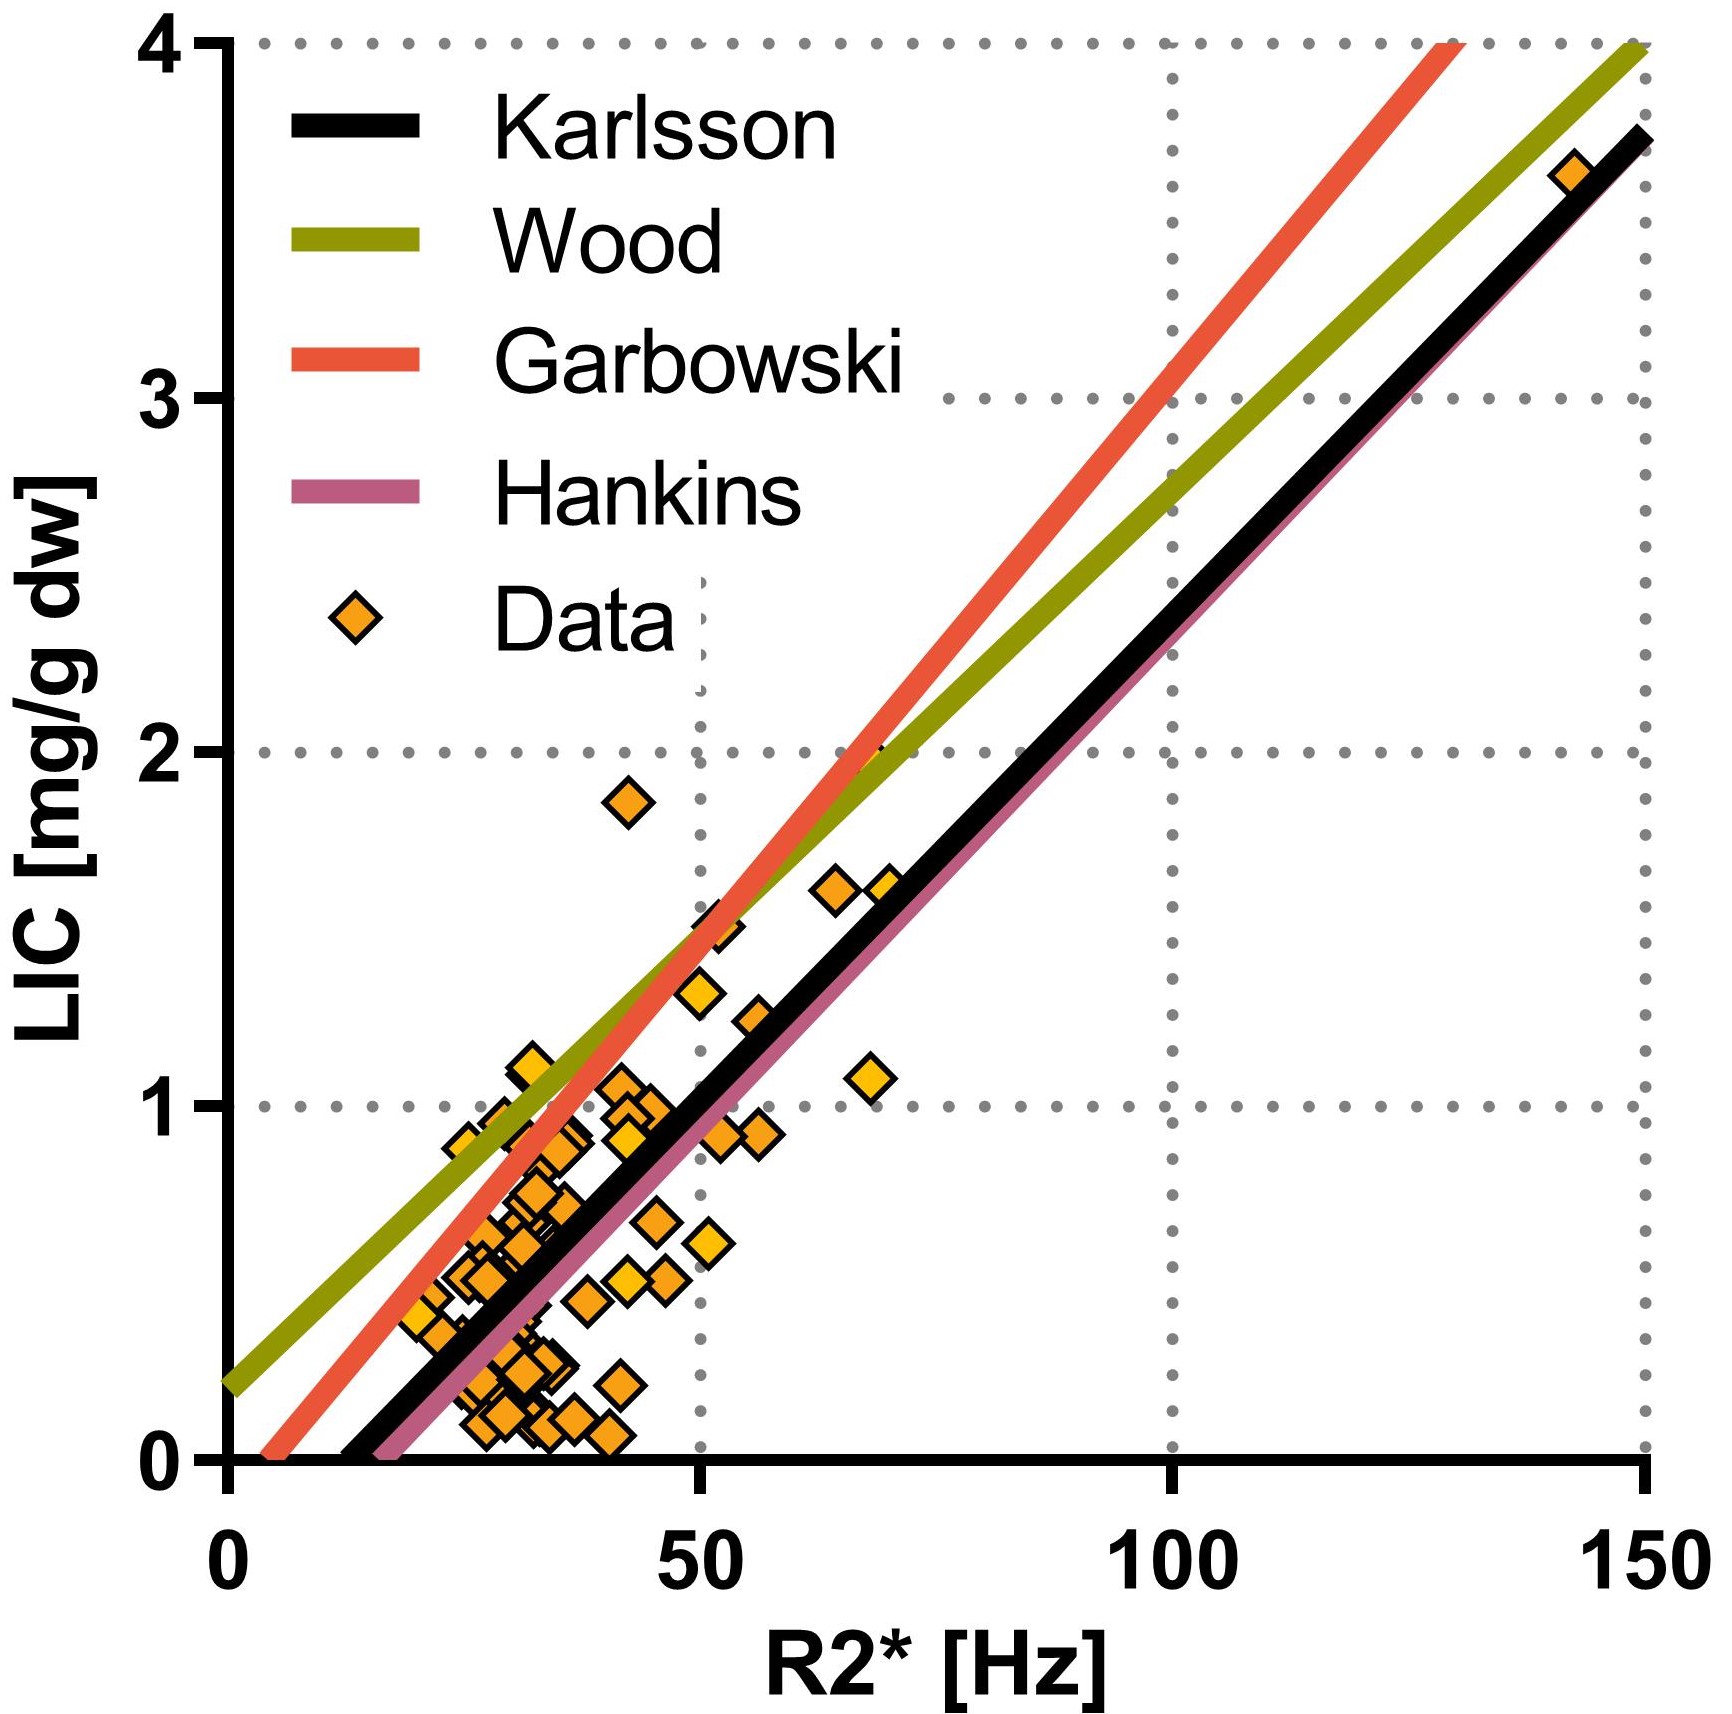
Fig 3 shows our calibration curve compared to other reported calibration curves1-3. Those studies mainly included patients that received blood cell transfusions. Even though those patients had much higher LIC the calibration curves were still equivalent, in particular the slopes.
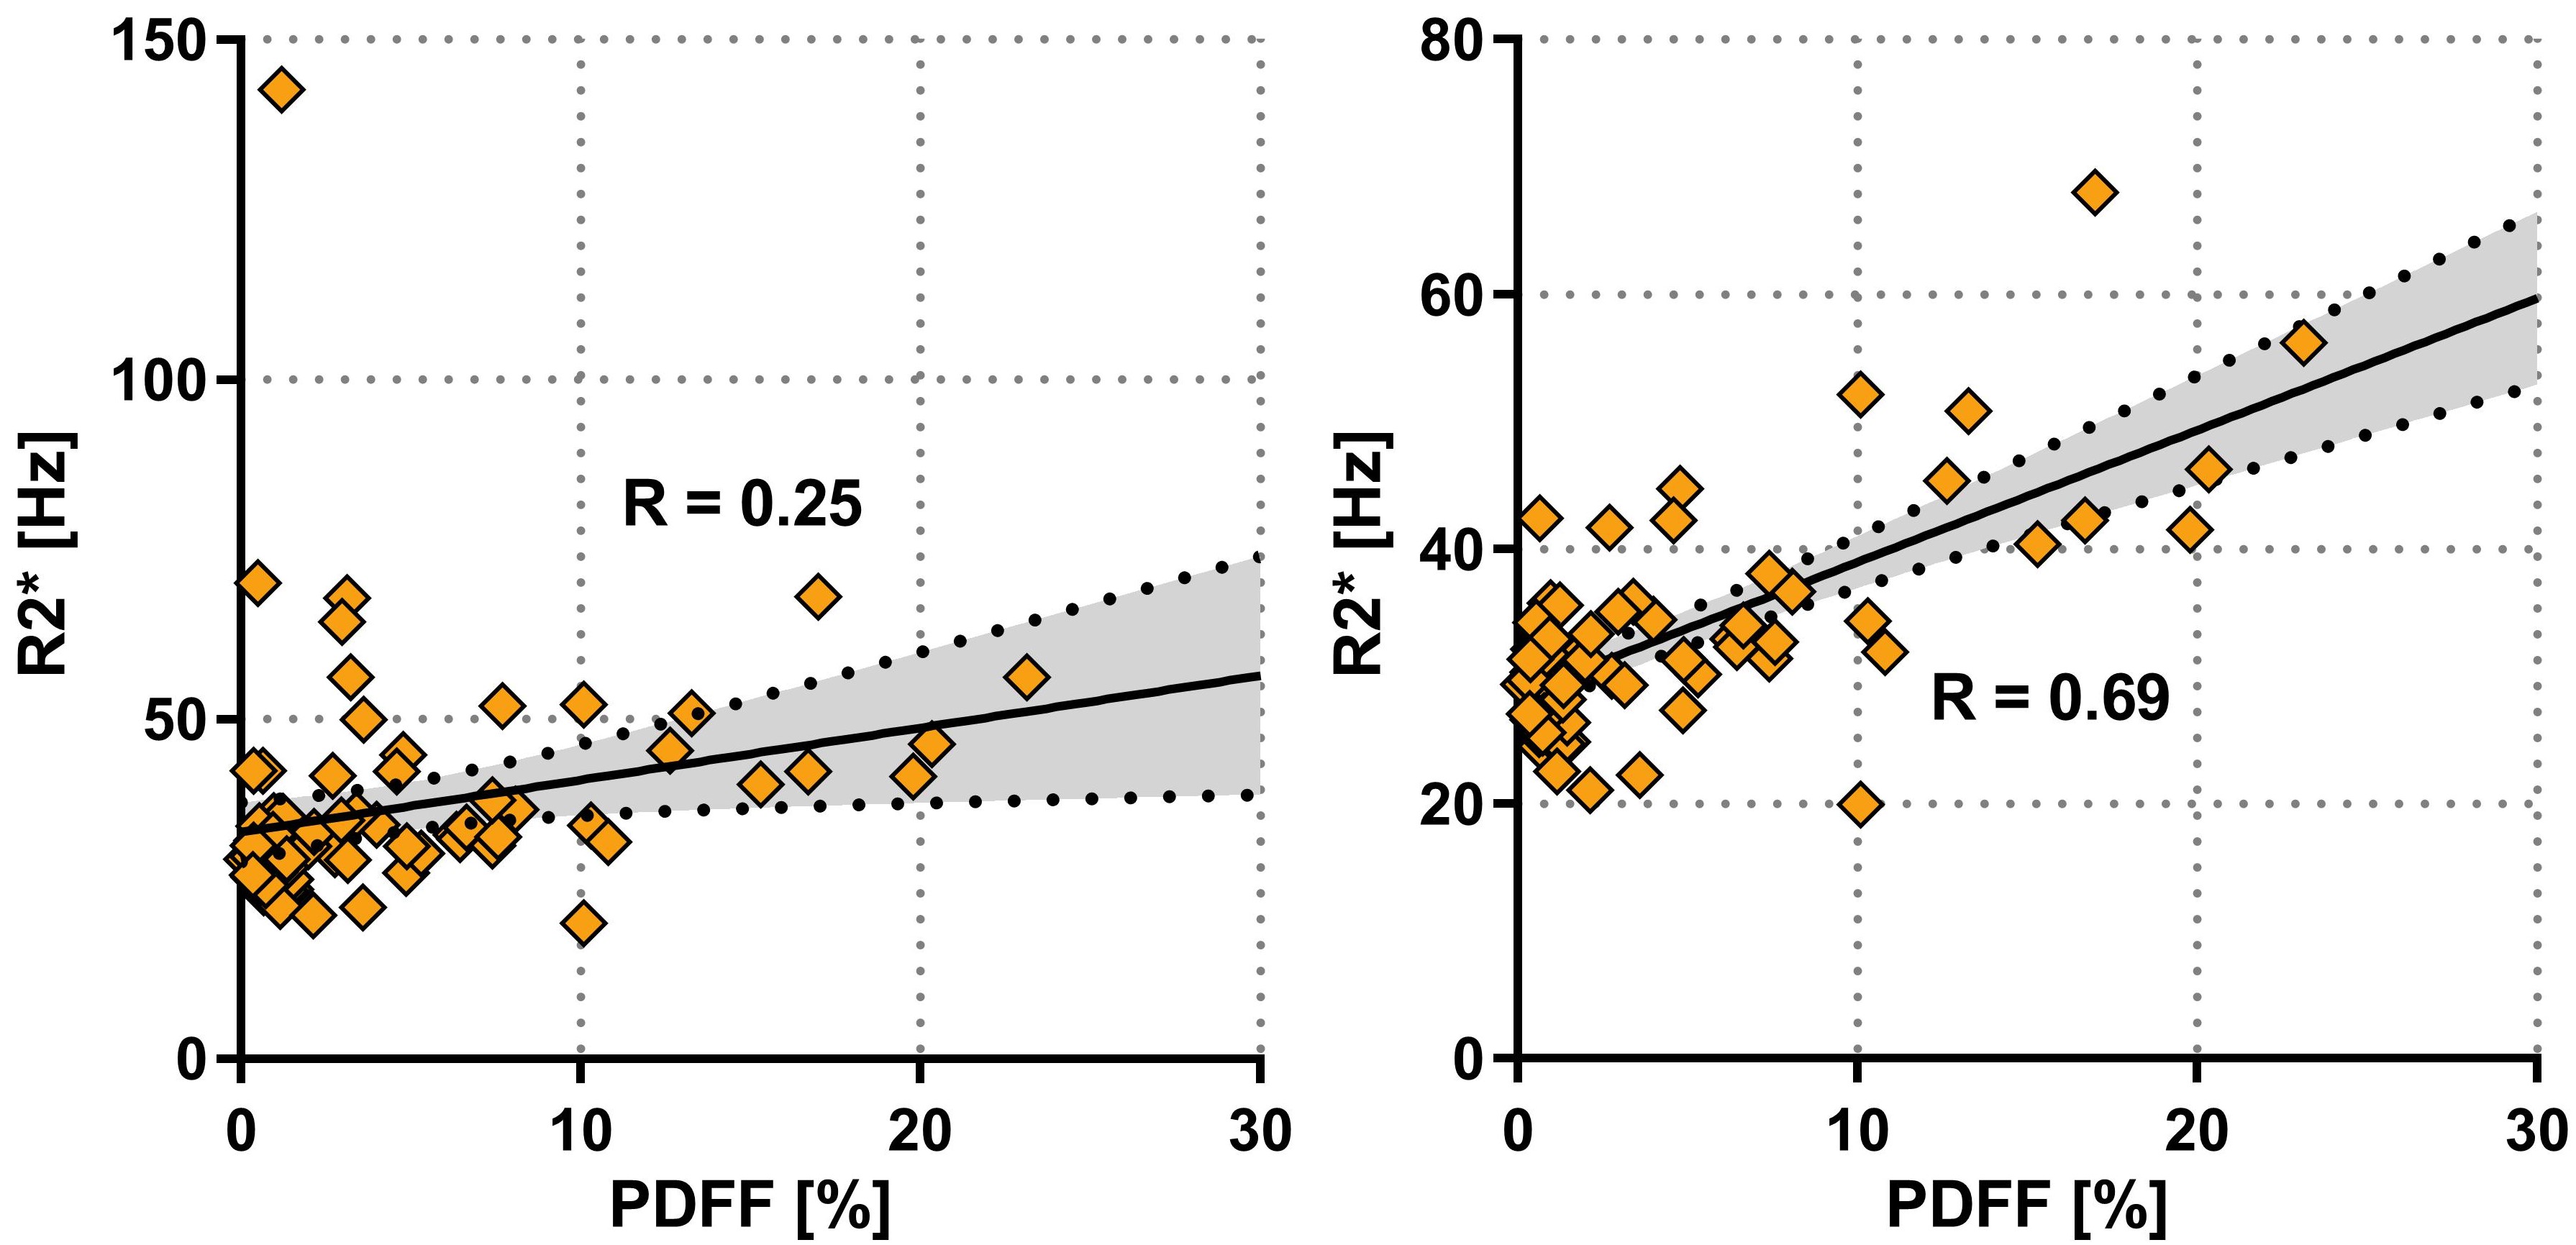
Moreover, there was a significant correlation between R2* and PDFF (Fig 4A; R=0.25; p<0.05). In addition, the correlation increased if patients with LIC>1.2 were excluded (Fig 4B; R=0.69; p<0.05), showing that the effect of fat on R2* is smaller than the effect of iron.
Discussion
R2*‑relaxometry gave a good correlation with LIC. R2* also provided better accuracy than histology for diagnosing slight iron overload. Our results were strengthened because our calibration curve was similar to other curves estimated using a very different range of LIC. As the curves were not identical, we recommend that each site should establish their internal calibration curve, especially when examining patients with as low iron levels as those that were included in this work.
The correlation between R2* and liver fat faction indicated that fat confounded the R2* measurement. However, the effect seems to be so small that it was only visible when iron levels were very low.
Conclusion
R2*-relaxometry can replace histopathologic staging of invasive liver biopsies when investigating iron overload.Acknowledgements
No acknowledgement found.References
1. Wood JC et al. MRI R2 and R2* mapping accurately estimates hepatic iron concentration in transfusion-dependent thalassemia and sickle cell disease patients. Blood 2005, 106(4):1460-1465.
2. Garbowski MW et al. Biopsy-based calibration of T2* magnetic resonance for estimation of liver iron concentration and comparison with R2 Ferriscan. J Cardiovasc Magn Reson 2014, 16:40.
3. Hankins JS et al. R2* magnetic resonance imaging of the liver in patients with iron overload. Blood 2009, 113(20):4853-4855.
4. Imbert-Bismut F et al. Low hepatic iron concentration: evaluation of two complementary methods, colorimetric assay and iron histological scoring. Journal of Clinical Pathology 1999, 52(6):430-434.
5. Bashir MR et al. Quantification of hepatic steatosis with a multistep adaptive fitting MRI approach: prospective validation against MR spectroscopy. American Journal of Roentgenology 2015, 204(2):297-306.
6. Mamidipalli A et al. Cross-sectional correlation between hepatic R2* and proton density fat fraction (PDFF) in children with hepatic steatosis. Journal of Magnetic Resonance Imaging 2017.
Figures