2597
Inter-method Reproducibility of Biexponential R2 Magnetic Resonance Relaxometry for Estimation of Liver Iron Concentration1Radiology, UT Southwestern Medical Center, Dallas, TX, United States, 2Radiology, Advanced Imaging Research Center, UT Southwestern Medical Center, Dallas, TX, United States, 3Radiology, Medical Physics, University of Wisconsin, Madison, WI, United States, 4Radiology, Medical Physics, Biomedical Engineering, Medicine, Emergency Medicine, University of Wisconsin, Madison, WI, United States
Synopsis
Non-invasive estimation of liver iron concentration (LIC) by R2-MRI is often used for detection, grading and treatment monitoring in patients with suspected or known iron overload. The only current R2-MRI LIC estimation method with regulatory clearance is FerriScan®, a proprietary analysis for biexponential R2-relaxometry. We implemented a nonproprietary biexponential R2-relaxometry using a "dictionary-search" algorithm, to reproduce the FerriScan® results. In 38 patients with known or suspected iron overload, we demonstrated excellent reproducibility (by linearity and absolute agreement) in R2 and LIC between FerriScan® and dictionary-search analyses, suggesting generalizability of the R2-MRI approach for LIC estimation.
Introduction
Quantification of body iron burden, assessed by estimation of liver iron concentration (LIC) [1-5], is commonly used for detection, grading and treatment monitoring in patients with suspected or known iron overload [5-8]. LIC estimation using R2-relaxometry magnetic resonance imaging (R2-MRI) has been validated against liver biopsy [9, 10]. Currently, the only R2-MRI method to estimate LIC with regulatory clearance is FerriScan® (Resonance Health Ltd., Claremont WA, Australia), which utilizes a proprietary biexponential R2-relaxometry analysis. To date, the reproducibility of R2-MRI using different relaxometry methods has not been investigated. Therefore, we assessed the inter-method reproducibility of R2-MRI for LIC estimation in patients with known or suspected iron overload.Methods
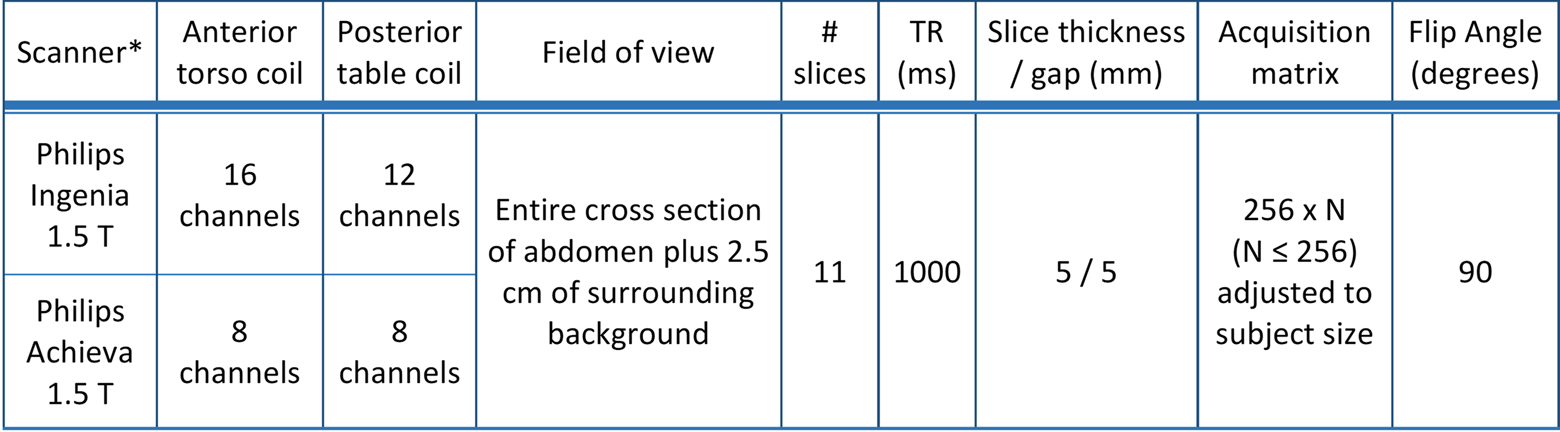
This single-center retrospective study, approved by Investigational Review Board and compliant with Health Insurance Portability and Accountability Act, included 40 MRI exams in 38 patients with a clinical indication for MRI of the liver to evaluate for known or suspected iron overload. Subjects underwent a standardized FerriScan® protocol (Table 1). Spin-echo (SE) data were securely transmitted to Resonance Health for off-site post-processing and analysis via a proprietary method that utilizes a simulated annealing curve-fitting algorithm [11]. Using the proprietary analysis report, the average R2 of the single segmented liver section was extracted. The corresponding estimated LIC (in mg Fe/g dry liver tissue) was calculated using the conversion formula developed for the proprietary method [9].
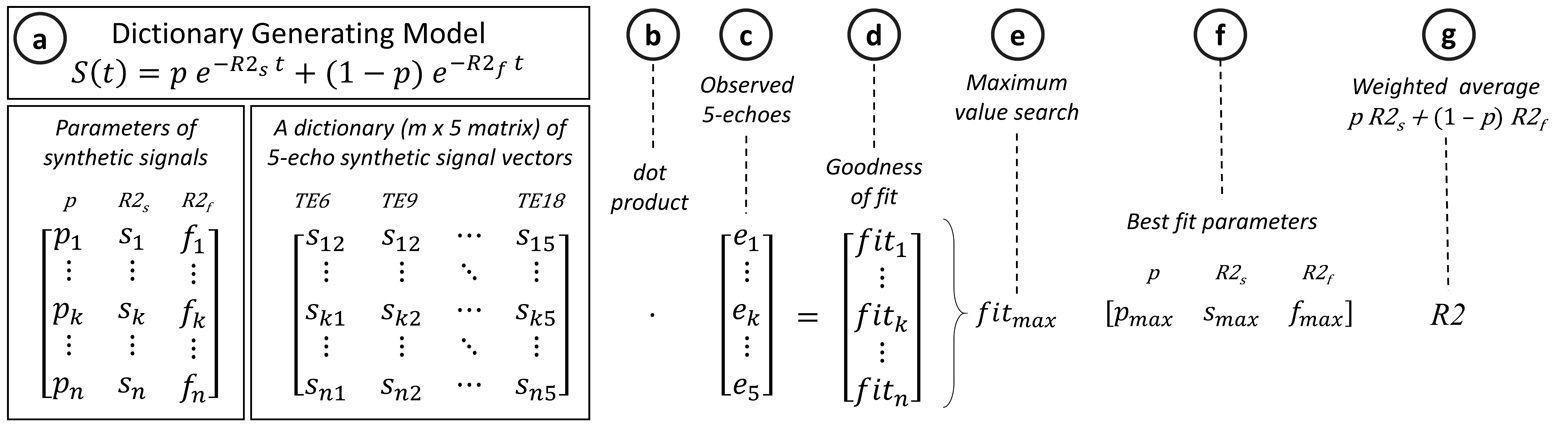
SE data were also post-processed and analyzed on-site using the dictionary-search curve-fitting algorithms written in MATLABTM (The MathWorks, Inc., Natick, MA). The liver was manually segmented on the same axial slice approximating the same region of interest (ROI) as used in the proprietary analysis. The SE data were corrected for scanner gain drift, background noise offset, and respiratory motion artifacts as previously described [12-14]. Biexponential R2-relaxometry was performed via a recently-introduced dictionary-search algorithm (Figure 1) by fitting the post-processed, noise-corrected signal intensity data, S(t), measured at different echo time (t), to a signal model with slow (R2s) and fast (R2f) relaxation components [12],
S(t) ∝ pe-R2st + (1 - p)e-R2ft ,
where p is the slow-component fraction. For each pixel, the weighted average of the slow and fast R2 components were calculated as: R2 = p × R2s + (1 – p) × R2f. Average liver R2 was calculated by averaging the pixel R2 values of the ROI, as done in the proprietary method. Each average liver R2 was converted to LIC using the validated formula developed for the proprietary method [9]. Inter-method reproducibility for liver R2 and LIC were assessed for linearity (using linear regression analysis) and absolute agreement (using intraclass correlation [ICC] and Bland-Altman analysis). For point estimates, 95% confidence intervals (CI) were calculated; P-values < 0.05 were considered statistically significant.
Results
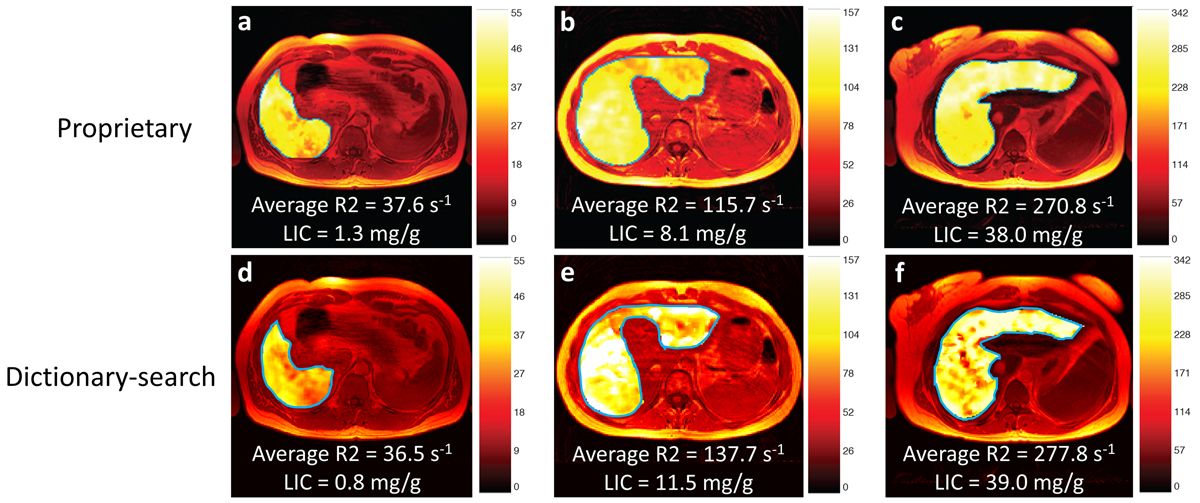
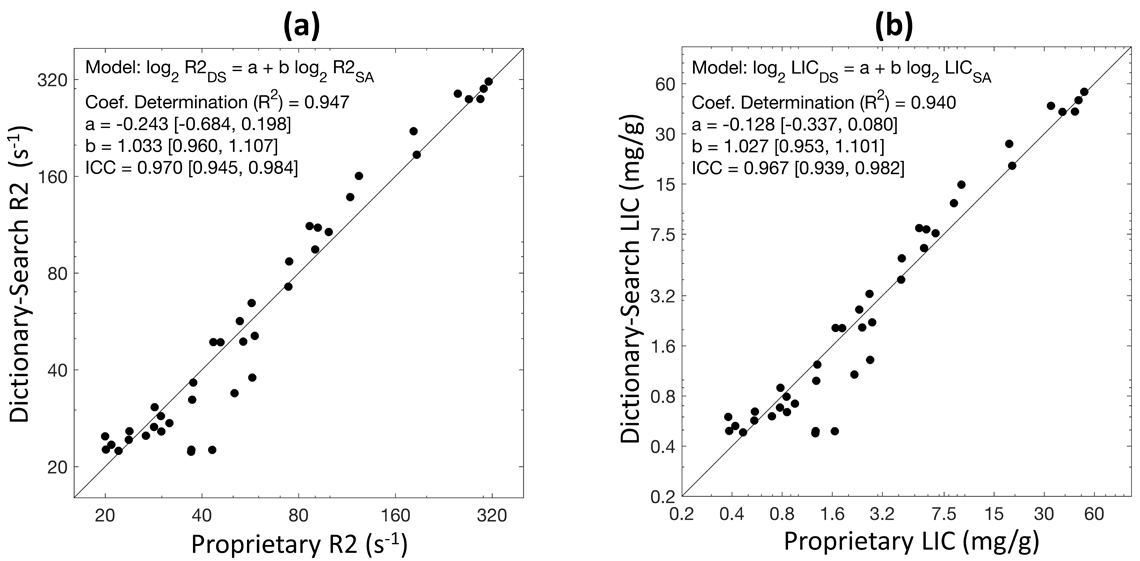
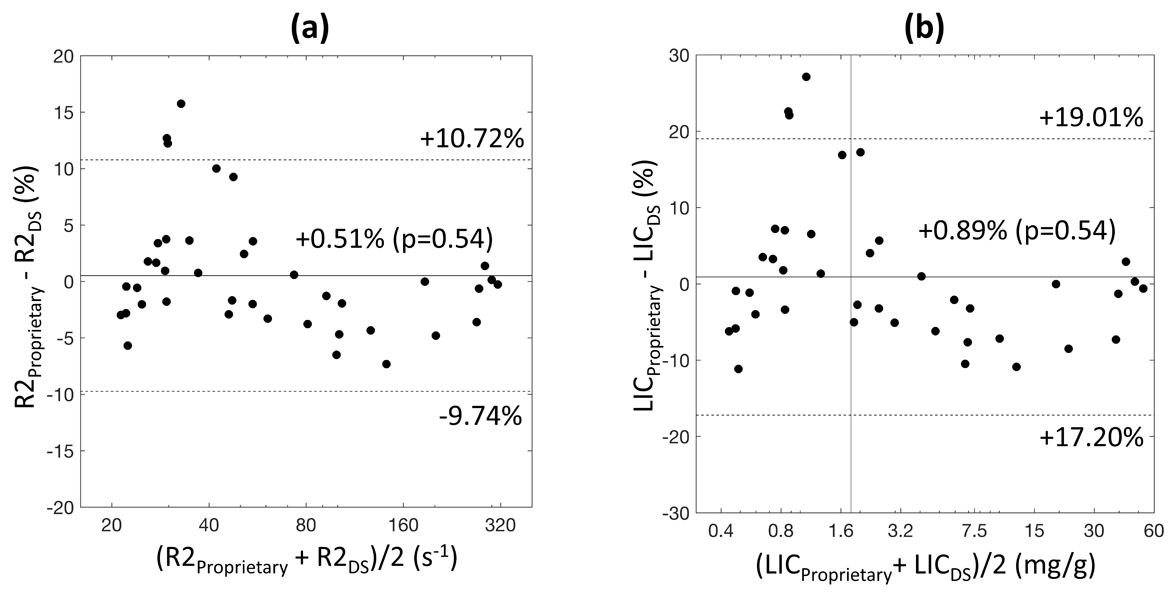
Figure 2 illustrates examples of generated R2 maps with the average liver R2 and LIC by the two different R2-relaxometry methods. Study population average liver R2 (range) by proprietary and dictionary-search relaxometry were respectively 86 s-1 (20 – 312) and 89 s-1 (22 – 315), with respective corresponding average LICs (range) of 8.3 mg/g (0.4 – 52.2) and 8.8 mg/g (0.4 – 53.6). Figure 3 illustrates the linear relationship between the two R2-relaxometry methods for R2 and for LIC. No statistically significant systematic difference was found between the two methods for average liver R2 or LIC (estimated slopes ~ 1 and intercepts ~ 0, P values > 0.05). No statistically significant inter-method bias was found by paired t-test (all P-values > 0.05). Agreement between the two methods was excellent, with ICCs ≥ 0.96 both R2 and LIC. Bland-Altman analysis showed 95% limits of agreement (LOA) of approximately ±10% for R2 and ±18% for LIC between the proprietary and nonproprietary methods (Figure 4).Discussion
In this single-center retrospective study we demonstrated excellent reproducibility between the proprietary and our nonproprietary methods for average liver R2 and LIC. The R2 reproducibility (95% LOA) of approximately ±10% between the two methods is similar to the previously reported inter-scanner reproducibility of ±10.9% for the proprietary method (calculated 95% LOA based on reported standard-deviation of 7.7% [9]). These results suggest the generalizability of biexponential R2-MRI approach to LIC estimation. To our knowledge, the implemented dictionary-search R2-relaxometry method is the first independent replications of the proprietary R2-MRI for LIC estimation.Conclusion
R2-MRI for LIC estimation is highly reproducible between proprietary and nonproprietary biexponential R2-relaxometry methods, suggesting generalizability of R2-MRI approach for noninvasive LIC estimation in patients with known or suspected liver iron overload.Acknowledgements
This project was in part supported by research grant R01 DK100651 (PI: Scott B. Reeder, MD PhD).References
1. Powell, L.W., et al., Screening for hemochromatosis in asymptomatic subjects with or without a family history. Arch Intern Med, 2006. 166(3): p. 294-301.
2. Brittenham, G.M., et al., Efficacy of deferoxamine in preventing complications of iron overload in patients with thalassemia major. N Engl J Med, 1994. 331(9): p. 567-73.
3. Bassett, M.L., J.W. Halliday, and L.W. Powell, Value of hepatic iron measurements in early hemochromatosis and determination of the critical iron level associated with fibrosis. Hepatology, 1986. 6(1): p. 24-9.
4. Angelucci, E., et al., Hepatic iron concentration and total body iron stores in thalassemia major. N Engl J Med, 2000. 343(5): p. 327-31.
5. Adams, P., P. Brissot, and L.W. Powell, EASL International Consensus Conference on Haemochromatosis. J Hepatol, 2000. 33(3): p. 485-504.
6. Brittenham, G.M., et al., Noninvasive measurement of iron: report of an NIDDK workshop. Blood, 2003. 101(1): p. 15-9.
7. Porter, J.B., Practical management of iron overload. Br J Haematol, 2001. 115(2): p. 239-52.
8. Kushner, J.P., J.P. Porter, and N.F. Olivieri, Secondary iron overload. Hematology Am Soc Hematol Educ Program, 2001: p. 47-61.
9. St Pierre, T.G., et al., Noninvasive measurement and imaging of liver iron concentrations using proton magnetic resonance. Blood, 2005. 105(2): p. 855-61.
10. St Pierre, T.G., et al., Multicenter validation of spin-density projection-assisted R2-MRI for the noninvasive measurement of liver iron concentration. Magn Reson Med, 2014. 71(6): p. 2215-23.
11. Press, W.H.T., S.A., Simulated Annealing Optimization Over Continuous Spaces. Computers in Physics, 1991. 5(4): p. 426-429.
12. Clark, P.R., W. Chua-anusorn, and T.G. St Pierre, Bi-exponential proton transverse relaxation rate (R2) image analysis using RF field intensity-weighted spin density projection: potential for R2 measurement of iron-loaded liver. Magn Reson Imaging, 2003. 21(5): p. 519-30.
13. St Pierre, T.G., P.R. Clark, and W. Chua-Anusorn, Single spin-echo proton transverse relaxometry of iron-loaded liver. NMR Biomed, 2004. 17(7): p. 446-58.
14. Clark, P.R., W. Chua-anusorn, and T.G. St Pierre, Reduction of respiratory motion artifacts in transverse relaxation rate (R2) images of the liver. Comput Med Imaging Graph, 2004. 28(1-2): p. 69-76.
Figures